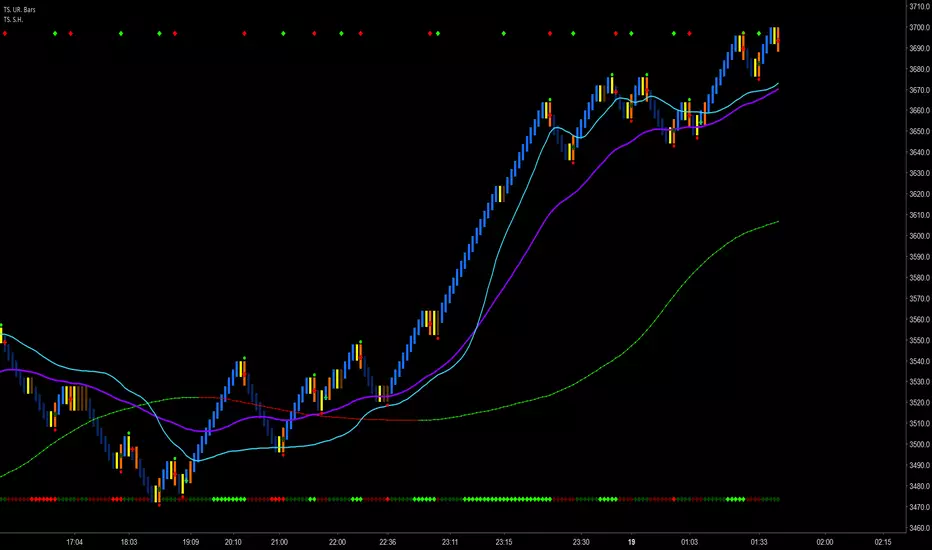
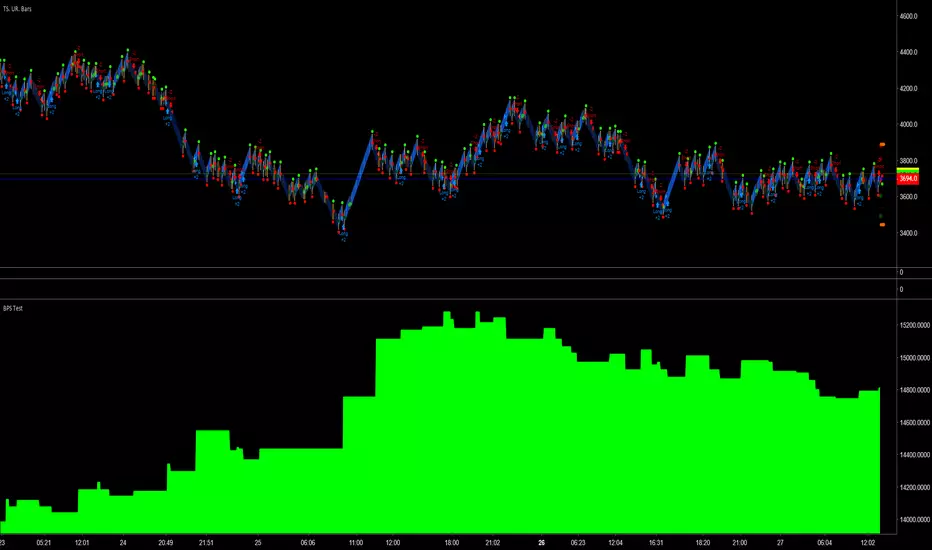
Directional filterThe idea is to show simply through colors "stronger or weaker" the relevance of candles in the current direction of the asset.
the indicator was made to be used in the graphics of 5m and 15m. based on the SMA20 already indicated previously and with a SMA20 of the graph of 60m.
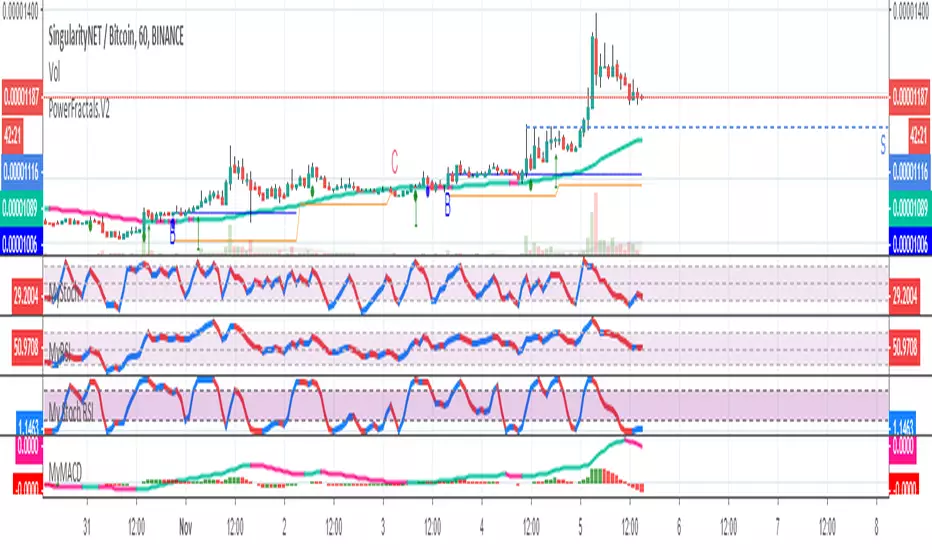
candles will have their colors modified according to their relevance in the current trend, "A" through "D", where "A" is the strongest and "D" is the weakest.
Conditions:
Buy candle A: price closes above SMA20 (5m or 15m) and above SM20 of 60m.
Buy candle B: price closes above the SMA20 (5m or 15m) and below the SMA20 of 60m.
Buy candle C: Price closes below the SMA20 (5m or 15m) and above the SMA20 60m.
Buy candle D: price closes below the SMA20 (5m or 15m) and below the SMA20 of 60m.
Sell candle A: price closes below the SMA20 (5m or 15m) and below the SMA20 of 60m.
Sell candle B: price closes below the SMA20 (5m or 15m) and above the SMA20 of 60m.
Sell candle C: price closes above the SMA20 (5m or 15m) and below the SMA20 of 60m.
Sell candle D: price closes above the SMA20 (5m or 15m) and above the SMA20 of 60m.
Note 1: SMA8 and SMA200 are also inserted (but they do not interfere with the indicator)
Note 2:
I will leave an image with the colors that represent the relevance of each candle.
imageshack.com
Индикатор Pine Script®