Supply and Demand - Order Block - Energy CandlesSupply and Demand - Order Block - Energy Candles
Description
An experimental script, designed as a visual aid, to highlight the last up or down candle before a fractal break. We can assume these candles where the point of origin that generated enough strength to break recent structure. By using them as reference points, traders are expected to follow their own set of rules and mark higher probability supply and demand zones in the area.
How to use:
Expect a potential retest in these areas, and if they fail, a potential retest in the opposite direction. The greater the number of times a zone is tested, the more likely it is to break. A fresh zone that has not yet been tested will have a higher probability of a bounce.
Fractal period and candle break type can be personalised in settings. Can be used on all timeframes (higher the better).
Indicator in use:
Extras:
An option to flip candle colours if current price is above or below them has been added.
Candle

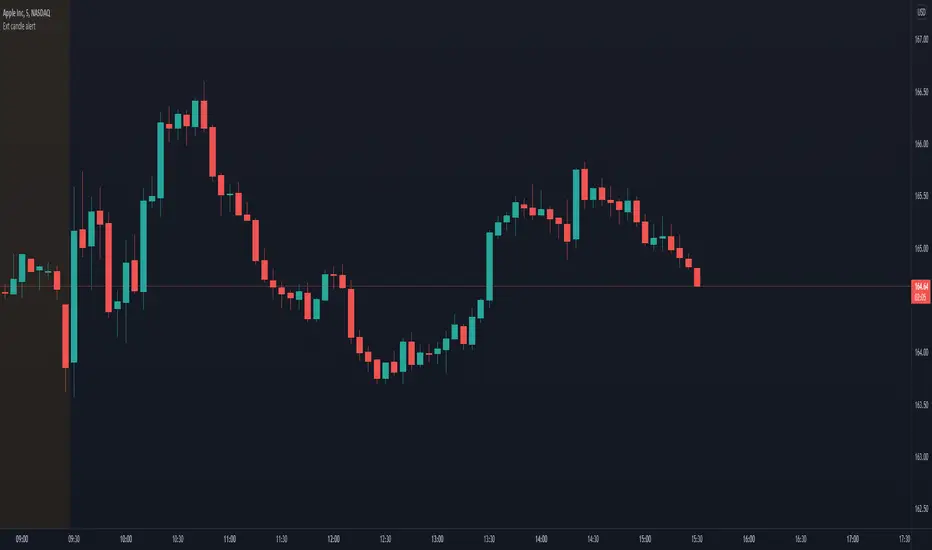
Extended candle alertThis indicator lets you set an alert that triggers when a candle body has got a specific % extension.
Customizable settings
Extension % threshold: the % of the candle extension that has to trigger the alert
Instructions to make it work
Add the indicator to your layout
Set the desidered extension % threshold
Create an alarm (Alt + A)
In the first condition toolbox select "Ext candle alert"
In the second condition toolbox select either long or short condition
Press create (unless you want to change secondary stuff like notification settings)
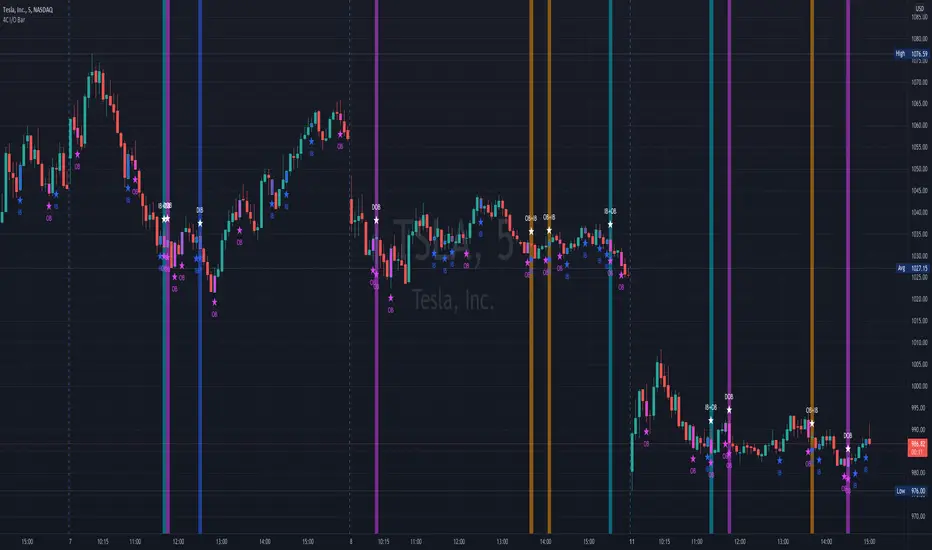
4C Inside/Outside BarThis indicator colors the candle body based on whether it closed as an Inside Bar (IB) or an Outside Bar (OB).
Inside and outside bars can be powerful triggers to enter or exit trades from, when price breaks above or below the candle.
The coloring of only the body and not the border of the candle makes it possible to still know whether the candle was bullish/bearish.
This indicator has the unique ability to add/hide labels for each IB and OB.
Small labels are printed on the chart directly below the candle. (See below)
It also has the unique ability to paint the chart background when an IB forms directly after an OB.
This is a special combination of the two, and can also be a powerful signal.
This feature can be turned on/off. (See below)
Thanks to Craig Stine, as some parts of this indicator were adapted from Custom Candle color Inside/Outside candles, Highwave, Star Patt. by Craig_Stine
Candle relative powerThis indicator tries to measure the power of candle.
You can also integrate some candles to measure the power. The “Length” is for integrating candles. If the Length is equal 5, it means indicator calculate power of recent 5 candles.
The second editable factor in “Shadow index” which represent the power of shadows.
The last factor in Average Criteria which is the module of comparing the integrated candles to the past market moves.
This indicator do not supposed to create trading signals! But, you can see every time it breaks the static line it is a sign of bulls or bears power.
I personally use it as a candle power meter so I will evaluate the power of breakouts or trend continuations.

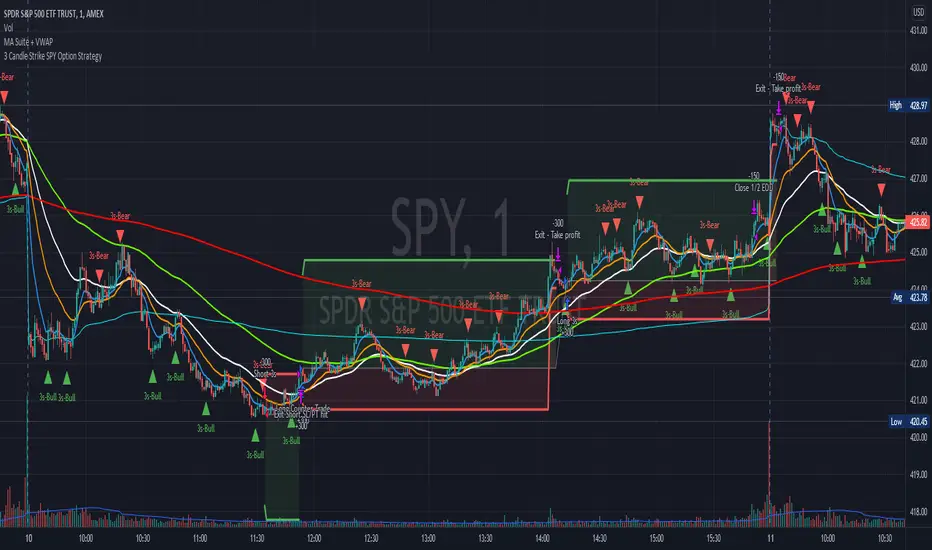
3 Candle Strike SPY Option StrategyImportant notes:
1. This strategy is designed for same day SPY option scalping. All profit shown in back testing report is based on Profit/Loss (P/L) estimates from trading options with approximately 7.5 weeks of data. By default, it is set to 10 option contracts. By default the initial capital is set to $5000.
2. This strategy also takes into account of extended market data, so turn it on for it to work as intended.
3. This strategy is mainly developed for SPY trading on 1 min chart, it probably will not work with other tickers without tweaking all the parameters first.
4. At the time of publish, the market is experiencing high volatility. Keep that in mind as market conditions changes constantly.
How it works:
Basic idea of this strategy is to look for 3 candle reversal pattern within trending market structure. The 3 candle reversal pattern consist of 3 consecutive bullish or bearish candles, followed by an engulfing candle in the opposite direction. This pattern usually signals a reversal of short term trend (a.k.a pullbacks). This strategy uses multiple moving averages to filter long or short entries. For example, if the 21 smoothed moving average is above the 50, only look for long (bullish) entries, and vise versa. There are settings to change these moving average periods to suit your needs. Linear Regression to determine whether the market is trending. The 3 candle pattern is more successful under trending market.
This strategy aims for approximately 1:3 risk to reward ratio. Stop losses are calculated using the closest low or high values for long or short entries, respectively, with an offset using a percentage of the daily ATR value. This allows some price fluctuation without being stopped out prematurely. Price target is calculated by multiplying the difference between the entry price and the stop loss by a factor of 3. When price target is reach, this strategy will set stop loss at the price target and wait for exit conditions to maximize potential profit.
By default, the strategy signals a trade in the opposite direction if the previous one had resulted in a loss. Often times, this opposite trade results in profit.
This strategy automatically signal to close all trades at 3:50 pm EST at the end of the day.
Enjoy~!!! Let's all make $$$
[_ParkF]RSI+RSI ----- UPGRADE ----> RSI+
-------------------------------------------------------------------------------------------------------------------------------------------------------------------------------------------
The RSI index has been upgraded.
The display function of RSI Candle, RSI Line, Divergence, and Divergence Line, which were previous functions, has been maintained.
As an upgrade, two linear regression and two trend lines are drawn.
Since the two linear regression values are different, support and resistance of long-term and short-term linear regression can be confirmed.
The two trend lines also have different period values, so it is possible to check support and resistance that could not be confirmed in linear regression.
Each linear regression and trend line can be turned on and off.
In addition, each linear regression and trend line can arbitrarily modify period values and deviation values.
Log charts and linear chart switches have been added to the trend line.
I hope it will help you with your trading.
-------------------------------------------------------------------------------------------------------------------------------------------------------------------------------------------
RSI 인덱스가 업그레이드되었습니다.
기존 기능이었던 캔들, 라인, 다이버전스, 다이버전스 라인의 디스플레이 기능은 그대로 유지됐다.
업그레이드로 두 개의 선형 회귀 분석과 두 개의 추세선이 그려집니다.
두 선형 회귀 값은 서로 다르기 때문에 장기 및 단기 선형 회귀의 지지 및 저항을 확인할 수 있습니다.
두 추세선의 주기 값도 다르므로 선형 회귀 분석에서 확인할 수 없었던 지지 및 저항을 확인할 수 있습니다.
각 선형 회귀선 및 추세선은 켜거나 끌 수 있습니다.
또한 각 선형 회귀선 및 추세선은 주기 값과 편차 값을 임의로 수정할 수 있습니다.
로그 차트 및 선형 차트 스위치가 추세선에 추가되었습니다.
당신의 트레이딩에 도움이 되었으면 합니다.
* I would like to express my gratitude to zdmre for revealing the linear regression source.
* I would like to express my gratitude to aaahopper for revealing the trendlines source.

[_ParkF]RSI (+ichimoku cloud)RSI
Typical RSI indicators were plotted with candles and expressed wick to resemble a candle chart,
and linear regression was added to predict changes in force intensity,
which allowed us to confirm support and resistance within linear regression .
In addition, divergence signal was marked as an additional basis for the price fluctuation point due to support and resistance .
In other words,
if the diversity signal appears together when the rsi candle is supported and resisted within linear regression ,
this is the basis for predicting that it is a point of change in the existing trend.
Finally, the period value and standard deviation of linear regression can be arbitrarily modified and used.
I hope it will help you with your trading.
--------------------------------------------------------------------------------------------------------------------------------------------------------------
(+ichimoku cloud)
Clouds made of the preceding span 1 and the preceding span 2 of the balance table can predict the trend by displaying the current price balance ahead of the future.
In addition to the role of clouds in the above-described balance sheet, this indicator also shows the cloud band support and resistance of the current RSI value.
일반적인 RSI 지표를 캔들화 하였고 꼬리까지 포함하여 캔들 차트와 유사하게 표현 하고,
캔들화한 RSI 지표에 선형회귀(채널)를 추가 하여 RSI 지표 특유의 힘의 강도의 변화를 지지와 저항으로 확인할 수 있게 해봤습니다.
또한 다이버전스 신호를 추가하여 선형회귀(채널)로 인한 지지와 저항에 따른 가격 변동의 근거로 삼을 수 있습니다.
즉, 선형회귀(채널) 안에서 RSI 캔들이 지지와 저항을 받을 때 다이버전스 신호가 함께 나타난다면 이는 기존 추세의 변화 지점임을
예측해 볼 수 있는 근거가 됩니다.
마지막으로 선형회귀(채널)의 기간값과 표준편차는 임의로 수정하여 사용할 수 있습니다.
당신의 트레이딩에 도움이 되었으면 합니다.
--------------------------------------------------------------------------------------------------------------------------------------------------------------
(+일목균형표의 구름)
일목균형표의 선행스팬1과 선행스팬2로 만들어진 구름은 현재 가격의 균형을 미래에 선행하여 표시하여 추세를 예측해볼 수 있습니다.
본 지표에서는 위에서 설명한 일목균형표의 구름의 역할과 더불어 현 RSI 값의 구름대 지지, 저항 또한 확인해볼 수 있습니다.
* I would like to express my gratitude to zdmre for revealing the linear regression source.

[_ParkF]RSIRSI
Typical RSI indicators were plotted with candles and expressed wick to resemble a candle chart,
and linear regression was added to predict changes in force intensity,
which allowed us to confirm support and resistance within linear regression.
In addition, divergence signal was marked as an additional basis for the price fluctuation point due to support and resistance.
In other words,
if the diversity signal appears together when the rsi candle is supported and resisted within linear regression,
this is the basis for predicting that it is a point of change in the existing trend.
Finally, the period value and standard deviation of linear regression can be arbitrarily modified and used.
I hope it will help you with your trading.
일반적인 RSI 지표를 캔들화 하였고 꼬리까지 포함하여 캔들 차트와 유사하게 표현 하고,
캔들화한 RSI 지표에 선형회귀(채널)를 추가 하여 RSI 지표 특유의 힘의 강도의 변화를 지지와 저항으로 확인할 수 있게 해봤습니다.
또한 다이버전스 신호를 추가하여 선형회귀(채널)로 인한 지지와 저항에 따른 가격 변동의 근거로 삼을 수 있습니다.
즉, 선형회귀(채널) 안에서 RSI 캔들이 지지와 저항을 받을 때 다이버전스 신호가 함께 나타난다면 이는 기존 추세의 변화 지점임을
예측해 볼 수 있는 근거가 됩니다.
마지막으로 선형회귀(채널)의 기간값과 표준편차는 임의로 수정하여 사용할 수 있습니다.
당신의 트레이딩에 도움이 되었으면 합니다.
* I would like to express my gratitude to zdmre for revealing the linear regression source.

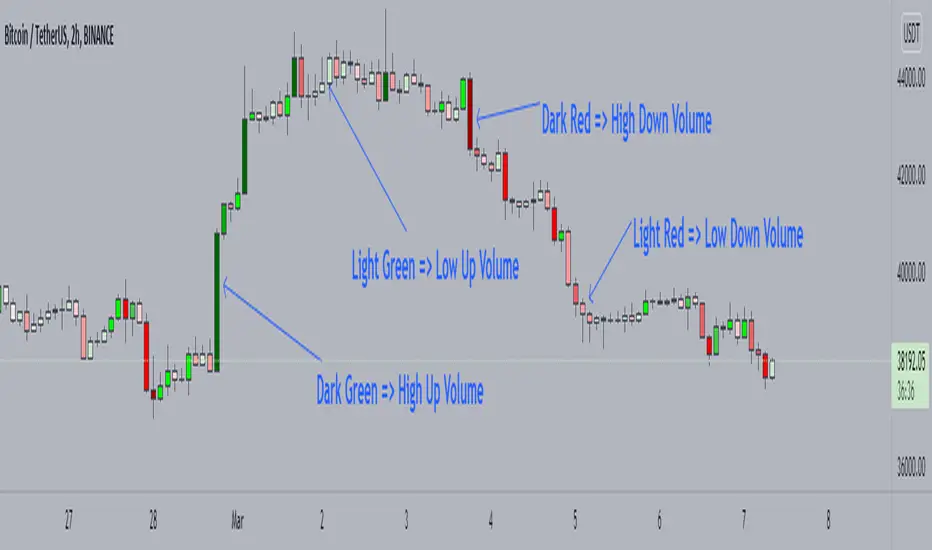
Candle Color by VolumeA simple but effective indicator that paints candles with different shades of colors based on the volume transacted.
-> Supports 6 levels of sensitivity at present. Might enhance the granularity later.
-> Darkest indicates the most volume transacted. Lightest, the least. Change it around however you see fit and based on your theme.
-> Use it for your Volume Spread Analysis and/or in conjunction with any other strategies that you employ.
-> Note that the volume ratio is calculated relative to the average volume of the last n candles ( EMA 20 by default).
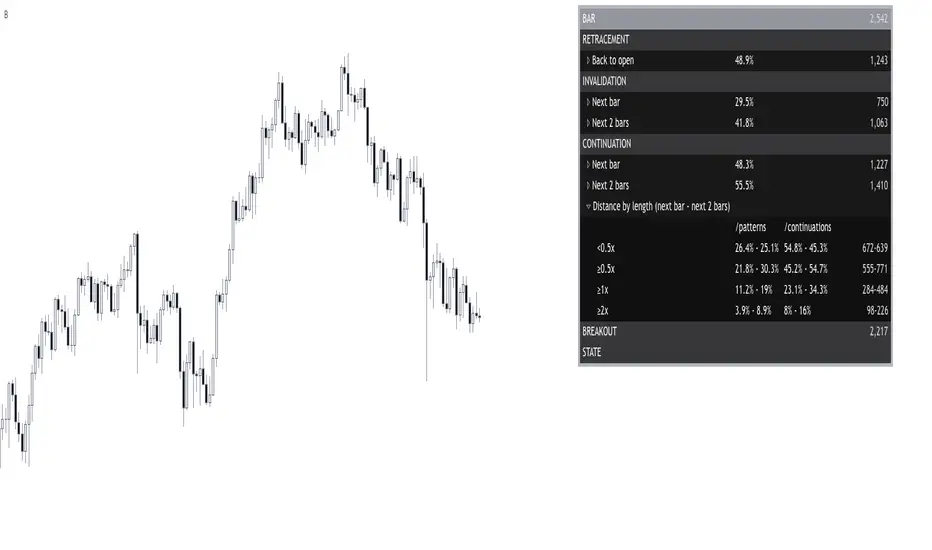
Bar█ OVERVIEW
This indicator demonstrates how we can use Pine script for collecting data to study the market.
By building a statistical report based on the chart candlestick analysis, discover if there is an edge or not, when and where?
Compare it with a specific candlestick pattern and know how its behavior diverges. I have already covered some here .
I hope it can bring you ideas for researching new edges, testing, and trying new things.
█ FEATURES
Sections
The report organizes the data into the following sections: retracement , invalidation , continuation , breakout , and state . Each of them provides insights into the price behavior and answers to questions such as: How often does price retrace? Does the pattern often invalidate? If it does not, does it break in the pattern's direction? How far does the price go? What are the odds of a false breakout? What is the likelihood of the next bar being a down candle?
Highlighter
The indicator highlights flat bars (open and close at the same price). It also highlights bullish and bearish bars once a filter is applied.
Settings
Filtering of bars closing beyond their prior bar’s high and low;
Filtering of reversal bars (two modes available);
Displaying distances relative to the bars length or Average True Range;
Collapsing/expanding each section;
Changing the report’s coloring and positioning;
█ NOTES
Computation
The script computation occurs on bar close.
Distances in ATR
When using a period of 20, for example, the first 19 candles are ignored because the ATR is not defined yet.
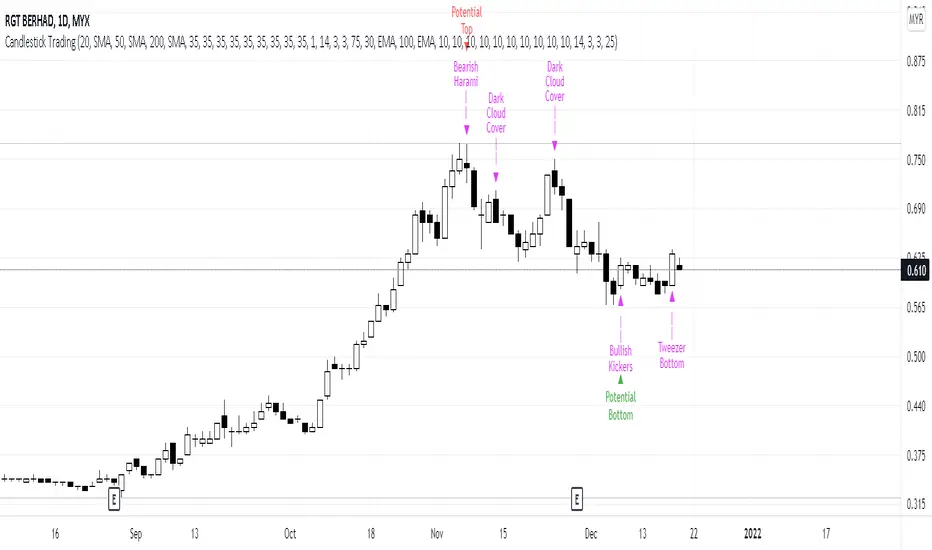
Candlestick Trading (Malaysia Stock Market)1. This indicator will indicate signals of bearish/bullish candlestick as below:
- 10 Bear Candles: Dark Cloud Cover, Bearish Kickers, Bearish Engulfing, Evening Star, Three Black Crows, Hanging Man, Shooting Star, Tweezer Top, Bearish Harami, Doji
- 10 Bull Candles: Piercing, Bullish Kickers, Bullish Engulfing, Morning Star, Three White Soldiers, Hammer, Inverted Hammer, Tweezer Bottom, Bearish Harami, Doji
2. In order for the Bear Candle signals to appear, these conditions should be met:
- Price must be above MA 1 (preset at SMA 20)
- Price must be above MA 2 (preset at SMA 50)
- Price must be above MA 3 (preset at SMA 200)
- In the range of specified trading days (preset at latest 10 days of trading)
3. For a strong bearish signal, a namely 'Potential Top' signal will appear on the top of the bearish candlestick signal. This 'Potential Top' signal will only appear under the condition of:
- Stochastic is at overbought area (preset at 75%)
4. In order for the Bull Candle signals to appear, these conditions should be met:
- Price must be in between MA 4 (preset at EMA 30) and MA 5 (preset at EMA 100)
- In the range of specified trading days (preset at latest 10 days of trading)
5. For a strong bullish signal, a namely 'Potential Bottom' signal will appear at the bottom of the bullish candlestick signal. This 'Potential Bottom' signal will only appear under the condition of:
- Stochastic is at oversold area (preset at 25%)
6. This indicator can help one to enter/exit a trade based on the bullish/bearish candlestick patterns that appear at the beginning/end of a trend, especially when the 'Potential Bottom/Top' appears with any of bullish/bearish candlestick signal.
7. However, this indicator is only designed for Malaysian Stocks Market as the script is based on the bids/pips calculation of the Malaysian Stocks Market. Nevertheless, I let the script open for everyone to modify it based on your own preference markets/instruments.
8. Hope you guys enjoy it. Thanks.
NSDT Bearish-Bullish CandlesThis is another interesting take on candlesticks . These Bearish-Bullish Candles do not show the wicks. Instead, the upper wick is made into a Red body and the lower wick is made into a Green body. If you match the candle body color in the chart settings (or turn off the candles completely), you get a unique way of seeing how Bearish or how Bullish a candle is because the wick will now match the body size and color.
This indicator is very similar to our NSDT Special High-Low Candles.

Aurora Candle with AlertThe indicator is derived from the concept of Aurora Candles (Credit to RK Arora)
Description
The script instantly calculates and highlights the largest candle (from high to low) in a user specified lookback period. It then plots the expected support, resistance, supply and demand levels. When a larger candle is printed, it will immediately plot the new levels.
How To Use
Use the indicator to find the largest candle in a specified lookback period.
• As soon as the Aurora candle is printed, future levels are plotted.
• If a larger candle is printed it will reset and create a new roadmap as big money dictates the market.
• The Aurora candle will mirror itself above and below X amount of times based on your settings.
• Colours, levels and lookback period are customizable.
• There is only 1 look back period. You can add more than one indicator if you want to set different lookback periods for long and short term levels.
• Alert function has been added
Access the indicator
• Contact me on TradingView

CandleEvaluationLibrary "CandleEvaluation"
Contains functions to evaluate bullish and bearish, engulfing, and outsized candles. They are different from the built-in indicators from TradingView in that these functions don't evaluate classical patterns composed of multiple candles, and they reflect my own understanding of what is "bullish" and bearish", "engulfing", and "outsized".
isBullishBearishCandle()
Determines if the current candle is bullish or bearish according to the length of the wicks and the open and close.
int _barsBack How many bars back is the candle you want to evaluate. By default this is 0, i.e., the current bar.
returns Two values, true or false, for whether it's a bullish or bearish candle respectively.
isTripleBull()
Tells you whether a candle is a "Triple Bull" - that is, one which is bullish in three ways:
It closes higher than it opens
It closes higher than the body of the previous candle
The High is above the High of the previous candle.
int _barsBack How many bars back is the candle you want to evaluate. By default this is 0, i.e., the current bar.
returns True or false.
isTripleBear()
Tells you whether a candle is a "Triple Bear" - that is, one which is bearish in three ways:
It closes lower than it opens
It closes lower than the body of the previous candle
The Low is below the Low of the previous candle.
int _barsBack How many bars back is the candle you want to evaluate. By default this is 0, i.e., the current bar.
returns True or false.
isBigBody()
Tells you if the current candle has a larger than average body size.
int _length - The length of the sma to calculate the average
float _percent - The percentage of the average that the candle body has to be to count as "big". E.g. 100 means it has to be just larger than the average, 200 means it has to be twice as large.
returns True or false
isBullishEngulfing()
Tells you if the current candle is a bullish engulfing candle.
int _barsBack How many bars back is the candle you want to evaluate. By default this is 0, i.e., the current bar.
int _atrFraction The denominator for the ATR fraction, which is the small amount by which the open can be different from the previous close.
returns True or false
isBearishEngulfing()
Tells you if the current candle is a bearish engulfing candle.
int _barsBack How many bars back is the candle you want to evaluate. By default this is 0, i.e., the current bar.
int _atrFraction The denominator for the ATR fraction, which is the small amount by which the open can be different from the previous close.
returns True or false

Heatmap Volume ColorBar trial v7FTJR20 This indicator is a heatmap of financial volume by repainting the candlesticks, I use three different ways to define the heatmap separating it into 3 phases:
Phase A: low volume
Phase B: average volume
Phase C: high volume
Don't worry about this data, the trial indicator is configured to auto-interpret the information.
The heat map uses the following colors and specifications
Red = Ultra High Volume
Orange = High volume
Yellow = Average Volume (balance)
Blue = Low volume
White = Volume below average
The heat map compares the phases to identify if it finds a standard deviation over time, that is, it is possible to see a smaller volume with the same red bar as before, because the aggressions are updated in real time.
I also created a trend line moved by the accumulated volume x the average price, there will always be an important zone, where the long/short can defend or not their position.
Tutorial:
1.0 - It is necessary that you have the minimum knowledge of waves, a quick explanation is that the market always works in 5 (1 to 5) or in 3 waves (ABC).
1.1- The Concept: When identifying the 3 wave or the C wave with a red cadle and a spread 2 to 3x larger than the average, mark the bottom and top of this red cadle.
-Note that in the example I marked it and named it "Support 3"
Note 1: Note that I had already marked the "Support 1" line from the moment the asset went down.
This candlestick is important for two reasons, it is a red candlestick with ultra volume and it was the beginning of the bullish impulse, if there was a place for the buyer to defend it was there.
Note 2: We don't know if the top or bottom of the candle was a support or resistance, check, be patient, watch the movement inside this red cadle and what the color of the cadles will be in the movements.
1.2 - see that the market makes several zig zags within our marking, and the color of the cadles turned white and blue (low volumes) someone was acting passively (probably who absorbed the red bar, we don't know yet).
1.3 - see that the price comes very close to the trend line and as it approaches the price drops with an aggression at the end, see that the cadle turned orange, even with the aggression the price goes back up, at this moment we already see that there is someone buying and defending the position.
Note: red, orange and yellow candles are aggressors.
1.4 - In the marking of point , see that the price falls in the region of the orange bar...
*remember, aggression bars are important regions, tick!
Note that the price drops with blue and white bars, breaks the previous bottom without aggression, see that the bars are blue, the seller has been absorbed and the buyer starts to attack.
On this occasion, see how many factors led you to believe that there was institutional defense there, be patient and study the attitudes within the chart.
1.5 - look at point 2 we see the price breaking the trend line,
there was a resistance there was a lot of money, so another red bar, the market from the sequence on the high and stops exactly at the line marked with "support 3", there was a region to protect the operation, my stop is below the red bar near 35k , where there is defense.
1.6 - Sequence market in the move and test the "resistance 1" and feel offer, see the perfection of the corrective zig zag in (ABC) on top of the red bar "the biggest red bar" of that move in point 4.
-see market tests 2x the top of "support 3" and takes the bear out of the game.
1.7 - From point 4 onwards, the market of the bullish sequence with aggression an orange bar and at point 5 we have another red bar, that is, we are close to a new resistance, "resistance 2", at this time the market is above this red bar from point 5, it is still bullish, below it, it may seek the trendline and its breakout may seek the "support 1" line.
- I like your feedback and leave your settings and experiences in the comments.

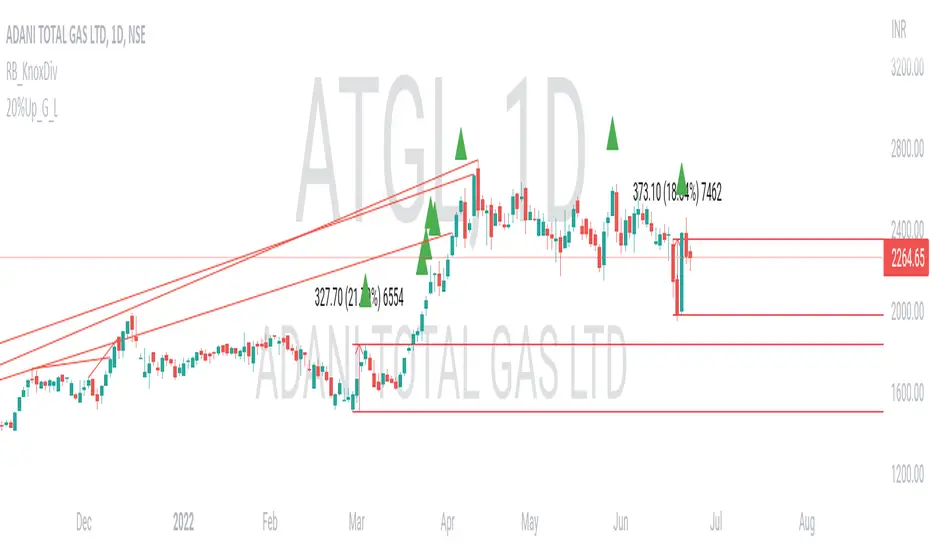
20% up with all continuously green candle: Lovevanshi It can be used to get the indication for 20% up movement among all continuously green candles formed in past. It is suitable for Indian company stock for short term trading plans.
Aurora CandleThe indicator is derived from the concept of Aurora Candles (Credit to RK Arora)
Description
The script instantly calculates and highlights the largest candle (from high to low) in a user specified lookback period. It then plots the expected support, resistance, supply and demand levels. When a larger candle is printed, it will immediately plot the new levels.
How To Use
Use the indicator to find the largest candle in a specified lookback period.
• As soon as the Aurora candle is printed, future levels are plotted.
• If a larger candle is printed it will reset and create a new roadmap as big money dictates the market.
• The Aurora candle will mirror itself above and below X amount of times based on your settings.
• Colours, levels and lookback period are customizable.
• There is only 1 look back period. You can add more than one indicator if you want to set different lookback periods for long and short term levels.
Access the indicator
• Contact me on TradingView

Special Time PeriodWith this indicator, you can choose candles in the period you want on your chart.
How ?
• If your chart is 5 minutes, the duration should be greater than 5 on this indicator.
If you do not do it this way, there will be gaps in the price, it will not give the right result.
• If you want to see it in minutes, you must enter a direct numerical value. For example, to see 2 hours, you must enter the number 120. Because 2 hours is 120 minutes.
Like the warning above, if you want to plot a 2-hour chart with this indicator, a maximum of 1 hour should be selected on your main chart.
• Resolution, eg. '60' - 60 minutes, 'D' - daily, 'W' - weekly, 'M' - monthly, '5D' - 5 days, '12M' - one year, '3M' - one quarter
• For example, if you want to see the 2-day chart, you should have a maximum of 1 day chart open on your home screen and write "2D" to the indicator value.
• You will get much better results if the period on your main chart and the period on this indicator are multiples of each other.
• In the image below, the period on the main chart is 30 minutes, but the period on the indicator is 90
• Click on the facing brackets at the top right of the legend and your chart will enlarge.

Longest CandleThe script detects and highlights the longest candle (from high to low) in a user specified lookback period.
Description
The longest candle in a specified range will form very strong predefined support and resistance levels. The concept is based on Aurora Candles.
How To Use
Use the indicator to find the longest candle in a specified lookback period. You can then mark the highs and lows for predefined S/R areas. Each trader can adjust the lookback period and colour.
Access the indicator
• Contact me on TradingView

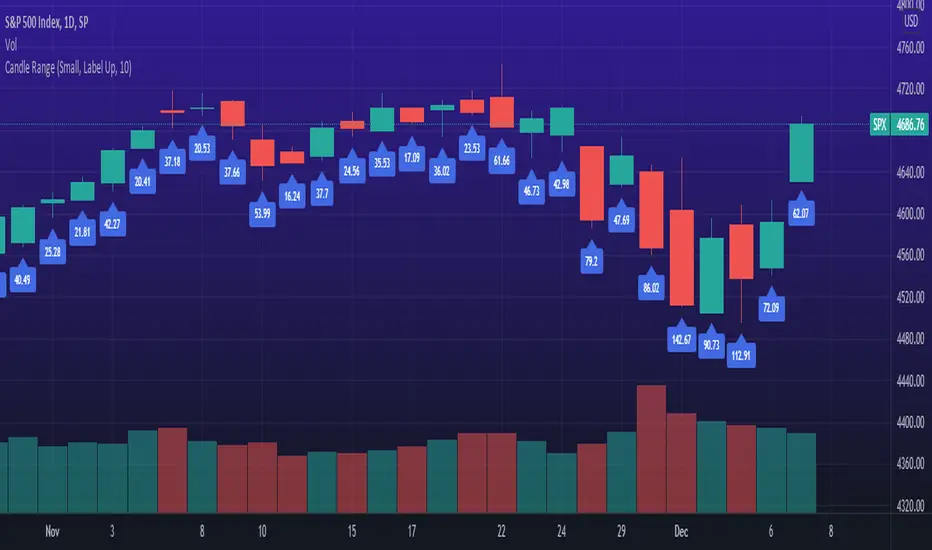
Bar StatisticsThis script calculates and displays some bar statistics.
For the bar length statistics, it takes every length of upper or lower movements and calculates their average (with SD), median, and max. That way, you can see whether there is a bias in the market or not.
Eg.: If for 10 bars, the market moved 2 up, then 1 down, then 3 up, then 2 down, and 2 up, the average up bars length would be at 2.33, while the average for the down length would be at 1.5, showing that upper movements last longer than down movements.
For the range statistics, it takes the true range of each bar and calculates where the close of the bar is in relation to the true low of it. So if the closing of the bar is at 10.0, the low is at 9.0, and the high is at 10.2, the candle closed in the upper third of the bar. This process is calculated for every bar and for both closing prices and open prices. It is very useful to locate biasses, and they can you a better view of the market, since for most of the time a bar will open on an extreme and close on another extreme.
Eg.: Here on the DJI, we can see that for most of the time, a month opens at the lower third (near the low) and closes at the upper third (near the high). We can also see that it is very difficult for a month to open or close on the middle of the candle, showing how important the first and the last day are for determining the trend of the rest of the month.

EM_RSI Gradient Candles
I've missed the beautiful trend visualization of Heiken Ashi candles ever since I first learned they don't play well with other indicators largely due to the method with which they're plotted.
I wanted to color code a gradient onto candles to help visualize trend strength, and the Relative Strength Index was the first thing to come to mind. For coloring, it's possible the new color.from_gradient function would have worked, but I couldn't guarantee a highly customizable indicator with a single gradient so I took a more classic approach.
First, RSI was calculated using Tradingview's built-in RSI code.
Then I broke down the RSI's range of 1-100 into 10 tiers and assigned each a color option with the ability to turn any particular tier off if desired.
I found it to be extremely modular and helpful in visualizing both trend strength and identifying potential trend reversals due to a reduction in strength.
You can use it on every candle to help inform decisions, or keep all but <10 and >90 turned off so that it only changes candle color during the most extreme trends.
Or anything in between!
This is my first self-coded indicator so I'm already proud.
Please let me know what you think, and feel free to suggest improvements for future versions in the comments!

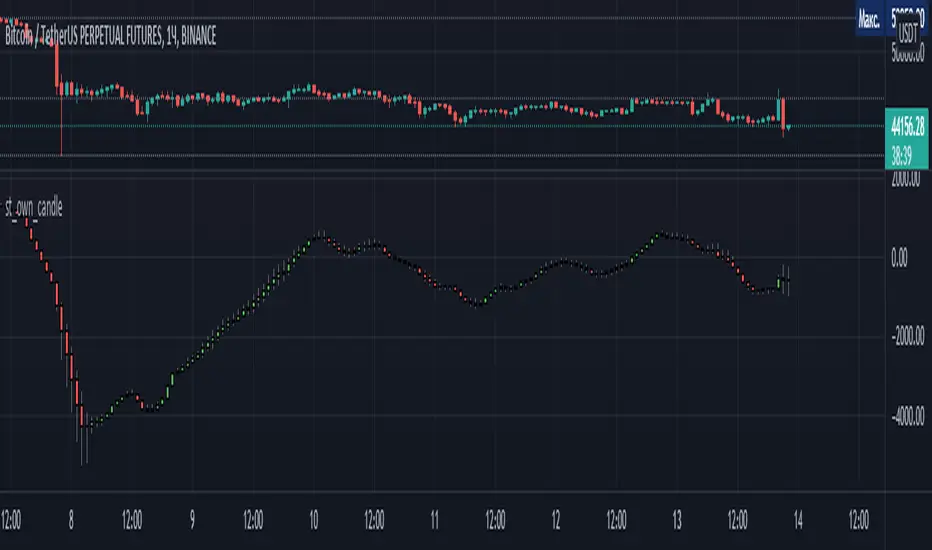
st_own_candleA script that builds candlesticks from the difference between a moving one for a short period and a moving one for a long period. Indicator parameters: long and short periods