Renko BandsThis is renko without the candles, just the endpoint plotted as a line with bands around it that represent the brick size. The idea came from thinking about what renko actually gives you once you strip away the visual brick format. At its core, renko is a filtered price series that only updates when price moves a fixed amount, which means it's inherently a trend-following mechanism with built-in noise reduction. By plotting just the renko price level and surrounding it with bands at the brick threshold distances, you get something that works like regular volatility bands while still behaving as a trend indicator.
The center line is the current renko price, which trails actual price based on whichever brick sizing method you've selected. When price moves enough to complete a brick in the renko calculation, the center line jumps to the new brick level. The bands sit at plus and minus one brick size from that center line, showing you exactly how far price needs to move before the next brick would form. This makes the bands function as dynamic breakout levels. When price touches or crosses a band, you know a new renko brick is forming and the trend calculation is updating.
What makes this cool is the dual-purpose nature. You can use it like traditional volatility bands where the outer edges represent boundaries of normal price movement, and breaks beyond those boundaries signal potential trend continuation or exhaustion. But because the underlying calculation is renko rather than standard deviation or ATR around a moving average, the bands also give you direct insight into trend state. When the center line is rising consistently and price stays near the upper band, you're in a clean uptrend. When it's falling and price hugs the lower band, downtrend. When the center line is flat and price is bouncing between both bands, you're ranging.
The three brick sizing methods work the same way as standard renko implementations. Traditional sizing uses a fixed price range, so your bands are always the same absolute distance from the center line. ATR-based sizing calculates brick range from historical volatility, which makes the bands expand and contract based on the ATR measurement you chose at startup. Percentage-based sizing scales the brick size with price level, so the bands naturally widen as price increases and narrow as it decreases. This automatic scaling is particularly useful for instruments that move proportionally rather than in fixed increments.
The visual simplicity compared to full renko bricks makes this more practical for overlay use on your main chart. Instead of trying to read brick patterns in a separate pane or cluttering your price chart with boxes and lines, you get a single smoothed line with two bands that convey the same information about trend state and momentum. The center line shows you the filtered trend direction, the bands show you the threshold levels, and the relationship between price and the bands tells you whether the current move has legs or is stalling out.
From a trend-following perspective, the renko line naturally stays flat during consolidation and only moves when directional momentum is strong enough to complete bricks. This built-in filter removes a lot of the whipsaw that affects moving averages during choppy periods. Traditional moving averages continue updating with every bar regardless of whether meaningful directional movement is happening, which leads to false signals when price is just oscillating. The renko line only responds to sustained moves that meet the brick size threshold, so it tends to stay quiet when price is going nowhere and only signals when something is actually happening.
The bands also serve as natural stop-loss or profit-target references since they represent the distance price needs to move before the trend calculation changes. If you're long and the renko line is rising, you might place stops below the lower band on the theory that if price falls far enough to reverse the renko trend, your thesis is probably invalidated. Conversely, the upper band can mark levels where you'd expect the current brick to complete and potentially see some consolidation or pullback before the next brick forms.
What this really highlights is that renko's value isn't just in the brick visualization, it's in the underlying filtering mechanism. By extracting that mechanism and presenting it in a more traditional band format, you get access to renko's trend-following properties without needing to commit to the brick chart aesthetic or deal with the complications of overlaying brick drawings on a time-based chart. It's renko after all, so you get the trend filtering and directional clarity that makes renko useful, but packaged in a way that integrates more naturally with standard technical analysis workflows.
Candlestick analysis

Trend Catch STFR - whipsaw Reduced### Summary of the Setup
This trading system combines **SuperTrend** (a trend-following indicator based on ATR for dynamic support/resistance), **Range Filter** (a smoothed median of the last 100 candles to identify price position relative to a baseline), and filters using **VIX Proxy** (a volatility measure: (14-period ATR / 14-period SMA of Close) × 100) and **ADX** (Average Directional Index for trend strength). It's designed for trend trading with volatility safeguards.
- **Entries**: Triggered only in "tradeable" markets (VIX Proxy ≥ 15 OR ADX ≥ 20) when SuperTrend aligns with direction (green for long, red for short), price crosses the Range Filter median accordingly, and you're not already in that position.
- **Exits**: Purely price-based—exit when SuperTrend flips or price crosses back over the Range Filter median. No forced exits from low volatility/trend.
- **No Trade Zone**: Blocks new entries if both VIX Proxy < 15 AND ADX < 20, but doesn't affect open positions.
- **Overall Goal**: Enter trends with confirmed strength/volatility, ride them via price action, and avoid ranging/choppy markets for new trades.
This creates a filtered trend-following strategy that prioritizes quality entries while letting winners run.
### Advantages
- **Reduces Noise in Entries**: The VIX Proxy and ADX filters ensure trades only in volatile or strongly trending conditions, avoiding low-momentum periods that often lead to false signals.
- **Lets Winners Run**: Exits based solely on price reversal (SuperTrend or Range Filter) allow positions to stay open during temporary lulls in volatility/trend, potentially capturing longer moves.
- **Simple and Balanced**: Combines trend (SuperTrend/ADX), range (Filter), and volatility (VIX Proxy) without overcomplicating—easy to backtest and adapt to assets like stocks, forex, or crypto.
- **Adaptable to Markets**: The "OR" logic for VIX/ADX provides flexibility (e.g., enters volatile sideways markets if ADX is low, or steady trends if VIX is low).
- **Risk Control**: Implicitly limits exposure by blocking entries in calm markets, which can preserve capital during uncertainty.
### Disadvantages
- **Whipsaws in Choppy Markets**: As you noted, SuperTrend can flip frequently in ranging conditions, leading to quick entries/exits and small losses, especially if the Range Filter isn't smoothing enough noise.
- **Missed Opportunities**: Strict filters (e.g., requiring VIX ≥ 15 or ADX ≥ 20) might skip early-stage trends or low-volatility grinds, reducing trade frequency and potential profits in quiet bull/bear markets.
- **Lagging Exits**: Relying only on price flips means you might hold losing trades longer if volatility drops without a clear reversal, increasing drawdowns.
- **Parameter Sensitivity**: Values like VIX 15, ADX 20, or Range Filter's 100-candle lookback need tuning per asset/timeframe; poor choices could amplify whipsaws or over-filter.
- **No Built-in Risk Management**: Lacks explicit stops/targets, so it relies on user-added rules (e.g., ATR-based stops), which could lead to oversized losses if not implemented.
### How to Use It
This system can be implemented in platforms like TradingView (via Pine Script), Python (e.g., with TA-Lib or Pandas), or MT4/5. Here's a step-by-step guide, assuming TradingView for simplicity—adapt as needed. (If coding in Python, use libraries like pandas_ta for indicators.)
1. **Set Up Indicators**:
- Add SuperTrend (default: ATR period 10, multiplier 3—adjust as suggested in prior tweaks).
- Create Range Filter: Use a 100-period SMA of (high + low)/2, smoothed (e.g., via EMA if desired).
- Calculate VIX Proxy: Custom script for (ATR(14) / SMA(close, 14)) * 100.
- Add ADX (period 14, standard).
2. **Define Rules in Code/Script**:
- **Long Entry**: If SuperTrend direction < 0 (green), close > RangeFilterMedian, (VIX Proxy ≥ 15 OR ADX ≥ 20), and not already long—buy on bar close.
- **Short Entry**: If SuperTrend direction > 0 (red), close < RangeFilterMedian, (VIX Proxy ≥ 15 OR ADX ≥ 20), and not already short—sell short.
- **Exit Long**: If in long and (SuperTrend > 0 OR close < RangeFilterMedian)—sell.
- **Exit Short**: If in short and (SuperTrend < 0 OR close > RangeFilterMedian)—cover.
- Monitor No Trade Zone visually (e.g., plot yellow background when VIX < 15 AND ADX < 20).
3. **Backtest and Optimize**:
- Use historical data on your asset (e.g., SPY on 1H chart).
- Test metrics: Win rate, profit factor, max drawdown. Adjust thresholds (e.g., ADX to 25) to reduce whipsaws.
- Forward-test on demo account to validate.
4. **Live Trading**:
- Apply to a chart, set alerts for entries/exits.
- Add risk rules: Position size 1-2% of capital, stop-loss at SuperTrend line.
- Monitor manually or automate via bots—avoid overtrading; use on trending assets.
For the adjustments I suggested earlier (e.g., ADX 25, 2-bar confirmation), integrate them into entries only—test one at a time to isolate improvements. If whipsaws persist, combine 2-3 tweaks.

Chanlun - Strokes & Central ZonesChanlun Indicator - Strokes and Central Zones
This indicator implements Chan lun's core concepts:
Bi (Stroke): Basic price movement units formed by local highs and lows
Zhongshu (Central Zone): Overlapping areas formed by at least 3 strokes
Extension Lines: Visual guides for the latest central zone boundaries
Key Features:
Automatic stroke identification based on local extremes
Central zone detection with customizable colors
Extension lines for latest central zone (upper/lower bounds)
Separate colors for strokes within central zones
Price labels on the axis for zone boundaries
Settings:
Max Bars: Maximum K-lines to analyze (default: 4900)
Lookback Period: Period for finding local extremes (default: 5)
Min Gap Bars: Minimum bars between strokes (default: 4)
Customizable colors for strokes, zones, and extension lines

Amiya's Doji / Hammer / Spinning Top Breakout Strategy v5How it works
1. Pattern Detection (Previous Candle):
• Checks if total shadow length ≥ 2 × body.
• Checks if candle height (high − low) is between 10 and 21.5 points.
• If true → marks that candle as a potential Doji, Hammer, or Spinning Top.
2. Long Setup:
• LTP (close) crosses above previous candle high.
• Previous candle is a valid pattern candle.
• Stop Loss = 3 points below previous candle low.
• Take Profit = 5 × (high − low) of previous candle added to previous high.
3. Short Setup:
• LTP (close) crosses below previous candle low.
• Previous candle is a valid pattern candle.
• Stop Loss = 3 points above previous candle high.
• Take Profit = 5 × (high − low) of previous candle subtracted from previous low.
4. Visualization:
• Yellow background highlights pattern candles.
• Green ▲ and Red ▼ markers show entry points.
Deep yellow candles → represent Doji / Hammer / Spinning Top patterns
• Green triangle → Buy signal
• Red triangle → Sell signal
• Dotted green line + label → Target
• Dotted red line + label → Stop loss
• Gray background → Outside trading hours
• Auto close → All trades square off at 3:29 PM IST

Devils Mark Plus Volume Imbalance Multi TimeframeFollowing the success of the devil marks multi timeframe indicator I decided to add volume imbalance. Devils mark code remains unchanged here.
Functionality of the Devils mark remains the same as in when a candle prints without a wick at either end it indicates an area of price imbalance and it is assumed that the market will want to re-balance this level at some point in the future.
The same can be said for volume imbalances where 2 adjacent candles bodies don't meet. Again it it assumed the market will come back at some point to readdress this imbalance. Once mitigated the volume imbalance will be removed by the indicator.
These areas are best used to add confluence to trade ideas and shouldn't be used to formulate trade ideas on their own.
A table is included for easy reference.
Please note that data for timeframes lower than the current timeframe will not be shown. It is also worth noting that data on much higher timeframes than the current chart timeframe may not be shown due to data restrictions. If in doubt go up a timeframe !
I hope you find this indicator useful.

Previous Period High/Low LevelsThis indicator plots the previous day, week, and month high and low levels to highlight key liquidity levels.
Perfect for traders using market structure, liquidity, or SMC concepts.
Features:
Auto-plots PDH/PDL, PWH/PWL, and PMH/PML
Adjustable line styles, widths, and label sizes
Toggle price display on or off
Accurate UTC offset handling

DAMMU AUTOMATICAL AI ENRTY AND TARGET AND EXITMain Components
Supertrend System –
Detects market trend direction (Buy/Sell zones).
→ Green = Uptrend (Buy)
→ Red = Downtrend (Sell)
SMA Filter –
Uses 50 & 200 moving averages to confirm overall trend.
→ Price above both → Bullish
→ Price below both → Bearish
Buy/Sell Signals –
Generated when Supertrend flips direction and SMA confirms.
→ Triangle up = Buy
→ Triangle down = Sell
Take Profit / Stop Loss Levels –
Automatically calculated after Buy/Sell entry.
→ TP1, TP2, SL shown on chart
ADX (Sideways Zone Filter) –
If ADX < 25 → Market sideways → Avoid trades
Shows “No Trade Zone” area
Smart Money Concepts (SMC) Tools –
🔹 Market structure (HH, HL, LH, LL)
🔹 Order blocks (OB)
🔹 Equal highs/lows
🔹 Fair Value Gaps (FVG)
🔹 Premium & Discount zones
Helps find institutional entry points
Visual Display –
Color-coded background (trend zones)
Labels for buy/sell/structure
Optional FVG and order block boxes
Risk Management –
Input-based position sizing, SL & TP management
(to calculate profit levels and minimize loss)

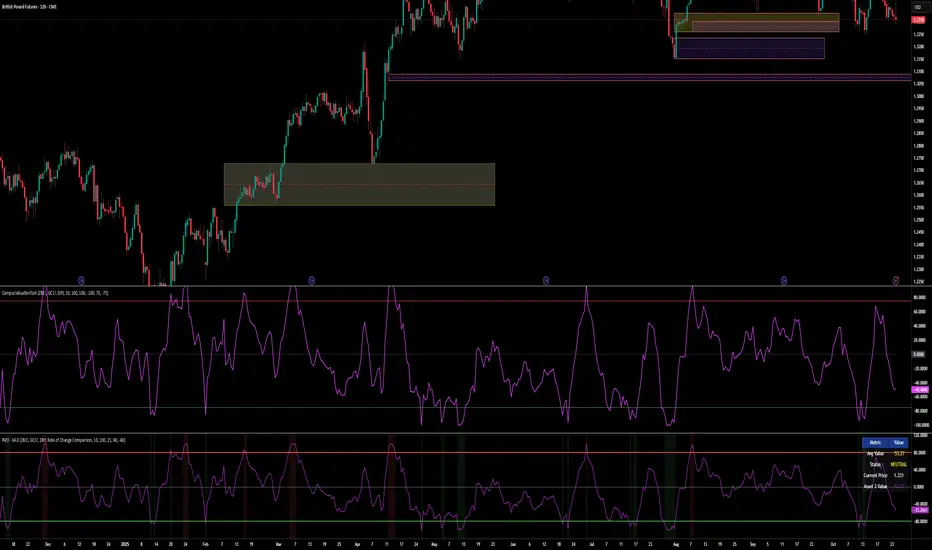
Relative Valuation OscillatorThis is a Relative Valuation Oscillator (RVO) this is attempt of replication OTC Valuation - a sophisticated multi-asset comparison indicator designed to measure whether the current asset is overvalued or undervalued relative to up to three reference assets.
Overview
The RVO compares the current chart's asset against reference assets (default: 30-Year Treasury Bonds, Gold, and US Dollar Index) to determine relative strength and valuation extremes. It outputs normalized oscillator values ranging from -100 (undervalued) to +100 (overvalued).
Key Features
Multiple Calculation Methods
The indicator offers 5 different calculation approaches:
Simple Ratio - Normalized ratio deviation from average
Percentage Difference - Percentage change comparison
Ratio Z-Score - Standard deviation-based comparison
Rate of Change Comparison - Momentum differential analysis (default)
Normalized Ratio - Min-max normalized ratio
Configurable Reference Assets
Asset 1: Default ZB (30-Year Treasury Bond Futures) - tracks interest rate sensitivity
Asset 2: Default GC (Gold Futures) - tracks safe-haven and inflation dynamics
Asset 3: Default DXY (US Dollar Index) - tracks currency strength
Each asset can be enabled/disabled independently
Fully customizable symbols
Visual Components
Multiple oscillator lines - One for each active reference asset (color-coded)
Average line - Combined signal from all active assets
Overbought/Oversold zones - Configurable threshold levels (default: ±80)
Zero line - Neutral valuation reference
Background coloring - Visual zones for extreme conditions
Signal line - Optional smoothed average
Entry markers - Long/short signals at key reversals
Signal Generation
Crossover alerts - When crossing overbought/oversold levels
Entry signals - Reversals from extreme zones
Divergence detection - Bullish/bearish divergences between price and oscillator
Zero-line crosses - Trend strength changes
Customization Options
Lookback period (10-500): Controls statistical calculation window
Normalization period (50-1000): Determines scaling sensitivity
Smoothing toggle: Optional EMA/SMA smoothing with adjustable period
Visual customization: Colors, levels, and display options
Information Table
Real-time dashboard showing:
Average oscillator value
Current status (Overvalued/Undervalued/Neutral)
Current asset price
Individual values for each active reference asset
Use Cases
Mean reversion trading - Identify extreme relative valuations for reversal trades
Sector rotation - Compare assets within similar categories
Hedging strategies - Understand correlation dynamics
Multi-asset analysis - Simultaneously compare against bonds, commodities, and currencies
Divergence trading - Spot price/oscillator divergences
Trading Strategy Applications
Long signals: When oscillator crosses above oversold level (asset recovering from undervaluation)
Short signals: When oscillator crosses below overbought level (asset declining from overvaluation)
Confirmation: Use multiple reference assets for stronger signals
Risk management: Avoid trading when all assets show neutral readings
This indicator is particularly useful for traders who want to incorporate inter-market analysis and relative strength concepts into their trading decisions, especially in OTC (Over-The-Counter) and futures markets.
Strat 1-2 Break AlertsThe Strat 1-2 Break Alerts
by Yolanda Marie Dixon
This indicator automatically identifies Inside Bars (1) and alerts when price breaks out into a 2-1-2 Bullish or 2-1-2 Bearish setup — two of the most actionable patterns in The Strat methodology created by Rob Smith.
📊 What It Does:
Marks Inside Bars with a yellow triangle below the candle.
Plots a green “2-1-2↑” triangle when a bullish breakout occurs.
Plots a red “2-1-2↓” triangle when a bearish breakdown occurs.
Provides built-in alerts so traders never miss a 2-1-2 setup.
💡 How to Use It:
Add the indicator to your chart, then go to Alerts → Create Alert → Condition: Strat 1-2 Break Alerts, and choose either 2-1-2 Up or 2-1-2 Down.
Perfect for traders who follow The Strat and want simple, reliable visual and alert-based signals for 1-2 setups.
—
🔔 Stay ready, stay Stratified.
Master The Strat with instant alerts for every 2-1-2 breakout.

NY Midnight High/Low Arrows (Auto-Show)🇺🇸 English Explanation
This indicator automatically marks the daily high and low of the New York session.
It draws arrows (▼▲) at the highest and lowest prices after New York midnight (00:00),
and can optionally display small horizontal dotted lines at those levels.
It helps traders identify daily liquidity zones and key turning points in price action.
🇸🇦 الشرح بالعربية
هذا المؤشر يحدد القمة والقاع اليومية لجلسة نيويورك بشكل تلقائي.
يرسم أسهماً (▼▲) عند أعلى وأدنى سعر بعد منتصف الليل بتوقيت نيويورك (00:00)،
ويمكنه أيضًا عرض خطوط أفقية منقطة صغيرة عند تلك المستويات.
يساعد المتداول في معرفة مناطق السيولة اليومية ونقاط الانعكاس المهمة في حركة السعر.

Strat 3-Bar (Outside Bar) AlertThis indicator automatically detects and alerts you when a Strat 3-Bar (Outside Bar) forms on any chart or timeframe.
An Outside Bar (3) occurs when both sides of the previous candle’s range are taken out — the high breaks above the prior bar’s high AND the low breaks below its low. It signals expansion in price discovery and potential reversals or continuations.
📈 How to Use:
1. Add this script to your chart.
2. Look for red “3” labels or triangles above outside bars.
3. To get alerts, click the TradingView alert icon (⏰):
• Condition → Strat 3-Bar (Outside Bar) Alert
• Option → “Outside Bar (3) Detected”
• Choose “Once per bar close.”
💡 Pro Tips:
- Use with Strat Assist for visual context.
- Combine with timeframe continuity for directional bias.
- Great on 15-min, 1H, and Daily charts.
---
👩🏽💻 Shared with love by Yolanda
Inspired by community discussions with Jalen (ChatGPT)
Let’s keep building each other up and mastering The Strat together! 💛
TheStrat, outsidebar, 3bar, priceaction, tradingstrategy, alert, reversal, continuation, stratassist, strat, technicalanalysis, pinev6, smartmoney

Buy vs Sell Liquidity + Difference (Bottom Right)Script Summary (Short Notes)
⚙️ Purpose
Tracks and displays Buy Volume vs Sell Volume difference during the day, based on candle direction.
Useful for spotting liquidity imbalance between buyers and sellers.
📊 How It Works
Volume Classification
If close > open → counts volume as Buy Volume
If close < open → counts volume as Sell Volume
Aggregation Timeframe
You can select a timeframe (1, 2, 3, 5, 15, 30 mins)
Script recalculates data from that aggregation level.
Daily Reset
At the start of a new trading day, totals reset to zero.
Cumulative Calculation
Adds all buy/sell volumes as the day progresses.
Calculates:
Total Volume
Difference (BUY − SELL)
Percentages (%)

Power Hour Breakout [LuxAlgo][Surge.Guru.Remastered]same script with better coloring and less intense
all credits goes to LuxAlgo

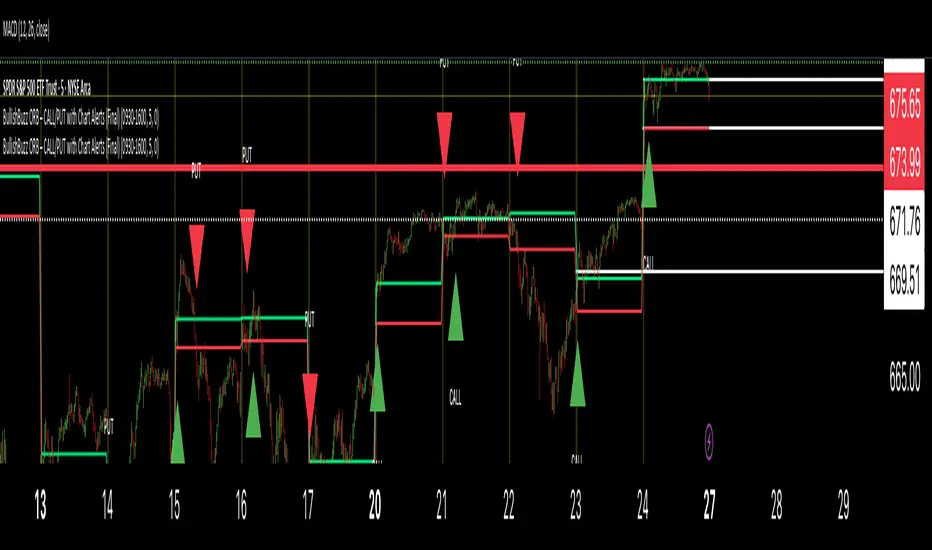
BullishBuzz ORB – CALL/PUT with Chart Alerts (Final)⚙️ The Bullish BuzzBot System
1️⃣ Data Feeds (Input Layer)
BuzzBot connects to live market data through TradingView’s chart engine (or via API for more advanced builds).
It continuously pulls:
Price data (open, high, low, close per bar)
Volume
RSI, MACD, VWAP, EMA 9/21 values
Timestamps & bar intervals (1m, 5m, 15m)
That’s the raw fuel — the same data you’d use for charting.
2️⃣ Indicator Engine (Signal Layer)
This is where the logic lives — it calculates conditions in real time.
BuzzBot checks for patterns like:
EMA 9/21 Cross: detects momentum shift
VWAP Reclaim or Reject: confirms intraday bias
RSI < 50 or > 70: momentum confirmation
MACD Cross: trend continuation signal
Volume > 2x average: validates conviction
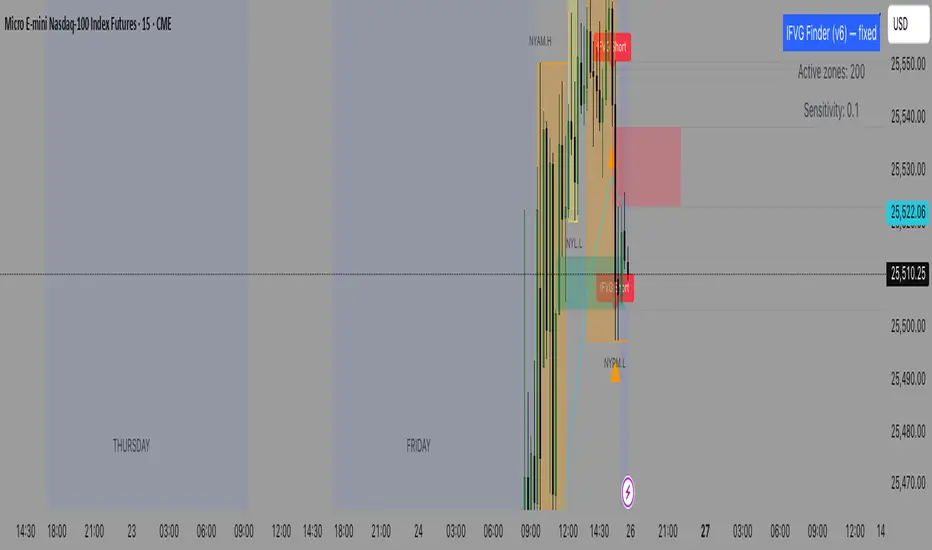
IFVG (Inverted Fair Value Gap) Finder Detects standard Fair Value Gaps (3-candle definition) on any timeframe.
Tracks those FVG zones on the chart.
Marks Inverted Fair Value Gaps (IFVGs) when price breaches (invalidates) an FVG and later retests it from the other side.
Draws the zones and plots clear entry arrows when a retest is detected (so you can use them to enter trades).
Has alertconditions you can enable for automated alerts.
Sonic R+EMA PYTAGOYou must determine the supply and demand zone as ema34, ema89, ema200, ema610. Then open the long position or the short position with SL and TP.


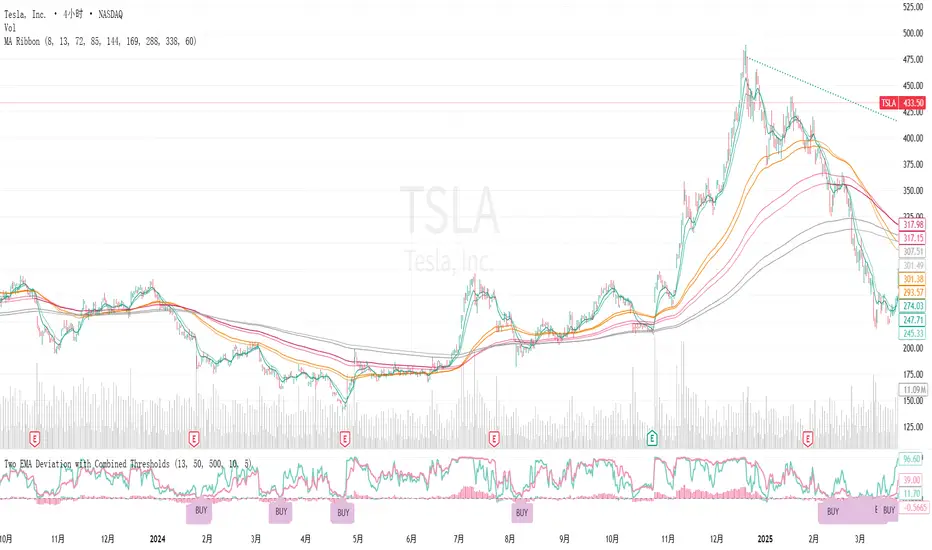
双EMA速度乖离Two EMA Deviation with Combined ThresholdsEMATwo EMA Deviation with Combined Thresholds
Two EMA Deviation with Combined ThresholdsTwo EMA Deviation with Combined ThresholdsTwo EMA Deviation with Combined ThresholdsTwo EMA Deviation with Combined ThresholdsTwo EMA Deviation with Combined ThresholdsTwo EMA Deviation with Combined ThresholdsTwo EMA Deviation with Combined Thresholds
NOVA Breakout Signals v2.2 (TF M30)A clean, rules-based breakout signal tool for 30-minute charts.
It detects Dow swing breakouts and filters them with RSI, MACD and Volume so you only see the higher-quality entries. The script does not place trades and does not calculate SL/TP – it only prints clear LONG/SHORT labels at the entry price.
⸻
How it works
1. Timeframe enforcement – Signals are generated only on M30. On other timeframes the script shows a notice and stays silent.
2. Breakout engine (Dow swings) – The last confirmed swing high/low (pivots) is tracked.
• Breakout Up: bar closes above the last swing high by a small buffer.
• Breakout Down: bar closes below the last swing low by a small buffer.
3. Quality filters (all must be true):
• RSI (default length 30):
• Long: RSI > threshold and rising.
• Short: RSI < threshold and falling.
• MACD (12/26/9):
• Long: histogram > 0 and line > signal.
• Short: histogram < 0 and line < signal.
• Volume: current volume > SMA(volume, 20) × multiplier.
4. Debounce / anti-spam
• Cooldown of 4 hours (8 M30 bars) after any signal.
• Minimum price distance from the previous signal to avoid clustered labels.
Signals appear once the bar closes (barstate.isconfirmed). No swing lines are drawn to keep the chart clean; only entry labels are shown.
⸻
Inputs (key)
• RSI length & thresholds for Long/Short confirmation.
• MACD uses 12/26/9 (fixed).
• Volume multiplier (relative to SMA 20).
• Breakout buffer %, Cooldown hours, Min distance %.
• Show labels (on/off).
⸻
Usage tips
• Start with gold/major FX/indices on M30; use “Once per bar close” if you attach alerts.
• Increase the breakout buffer and volume multiplier in choppy markets.
• Tighten RSI thresholds (e.g., 55/45) if you want fewer but stronger signals.
⸻
Notes & limitations
• Pivots confirm after a few bars by definition; signals themselves are printed only on confirmed bar close and do not repaint once shown.
• This is a signal indicator, not investment advice. Always manage risk.

COT Index Indicator 1) One‑liner
My version of the OTC COT Index indicator: a 0–120 oscillator built from CFTC COT data that shows where Commercial, Noncommercial, and Nonreportable net positions sit relative to recent extremes.
2) Short paragraph
This is my version of the OTC COT Index indicator. It converts CFTC Commitments of Traders (COT) net positions into a normalized 0–120 oscillator for each trader group—Commercials, Noncommercials, and Nonreportables—so you can quickly see when positioning is near recent highs or lows. Data comes from TradingView’s official COT library and supports both “Futures Only” and “Futures and Options” reports.
3) Compact bullets
What: My version of the OTC COT Index indicator
Why: Quickly spot when trader groups are near positioning extremes
Data: CFTC COT via TradingView/LibraryCOT/2; Futures Only or Futures & Options
How: Index = 120 × (Current − Min) ÷ (Max − Min) over a configurable lookback
Plots: Commercials (blue), Noncommercials (orange), Nonreportables (red)
Lines: Overbought, Midline, Oversold, optional 0/100, upper/lower bounds
Note: Values are relative to the chosen window; not trading advice
4) Publication‑ready (sections)
Overview
My version of the OTC COT Index indicator. It turns CFTC COT positioning into a 0–120 oscillator per trader group (Commercials, Noncommercials, Nonreportables) to highlight relative extremes.
Data source
CFTC Commitments of Traders via TradingView’s official library (TradingView/LibraryCOT/2).
Supports “Futures Only” and “Futures and Options.”
Method
Net positions = Longs − Shorts.
Index = 120 × (Current Net − Min(Net, Lookback)) ÷ (Max(Net, Lookback) − Min(Net, Lookback)).
Inputs
Weeks Look Back (normalization window)
Weeks Look Back for Historical Hi/Los (longer reference)
Report Type selection
Visuals
Three indexes by trader group, plus reference levels (OB/OS, Midline, optional 0/100).
Notes
Some symbols map to specific CFTC codes for reliability.
If no relevant COT data exists for the symbol, the script reports it clearly.
If you want this adapted to a specific platform’s character limits (e.g., TradingView’s publish dialog), tell me the target length and I’ll trim it to fit.

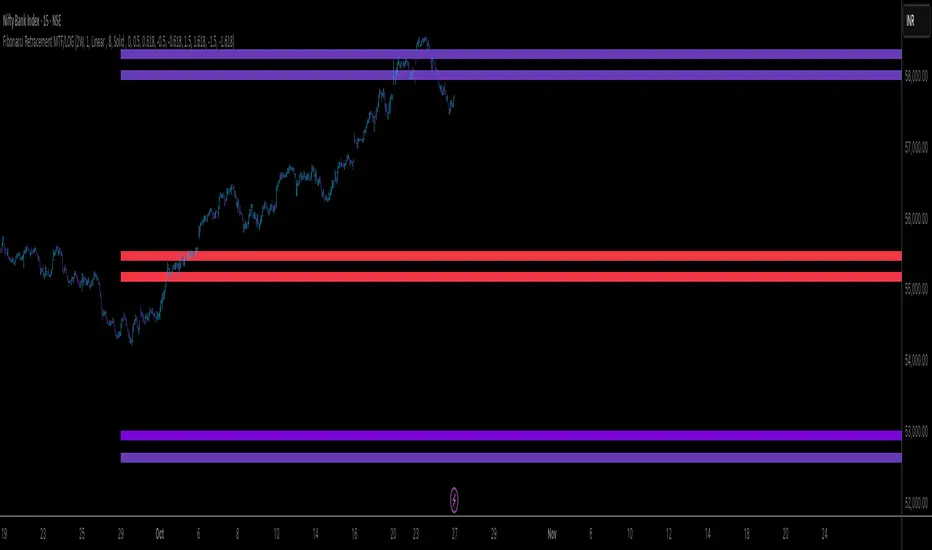
Fibonacci Retracement MTF/LOG 2WEEK KKKKFibonacci retracment should be used to create a line of lines to justify the rest of indicators to reduce stress in indicators because we should not shout
Nifty Candle Pattern IdentifierNifty Candle Pattern Identifier
✅ Doji
✅ Hammer
✅ Inverted Hammer
✅ Bullish Engulfing
✅ Bearish Engulfing
✅ Shooting Star

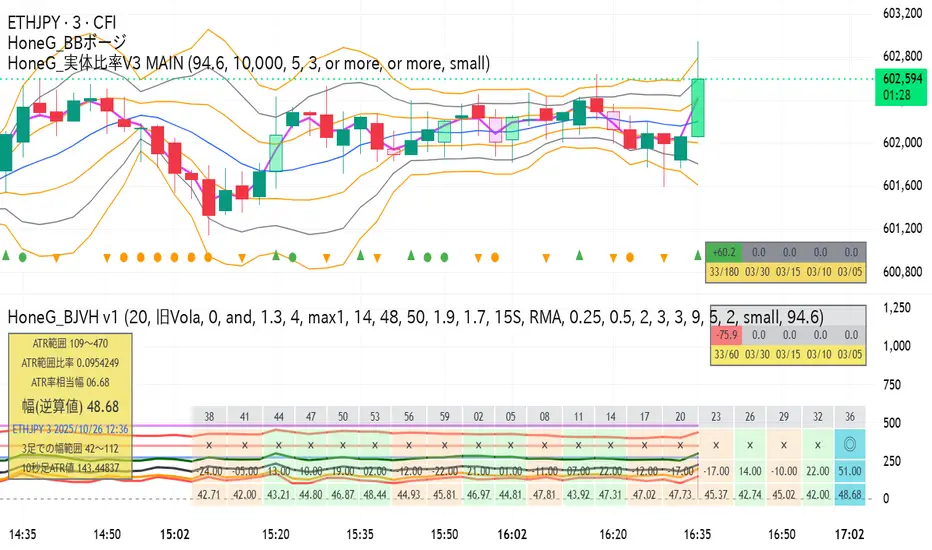
HoneG_BJVH 軽量化版v1
ザオプションのワンタッチ取引向けのサブチャート用ツールver1です
仮想通貨のpips換算時、変換式がイレギュラーなので、
ザオプションの現行画面仕様に合わせて作りました
このバージョンはテーブルを20列確保して、過去20足の勝敗も表現しています。
This is version 1 of the subchart tool for The Option's One-Touch trading.
Since the conversion formula for cryptocurrency pips is irregular,
it was created to match The Option's current screen specifications.
This version reserves 20 columns in the table and also displays the win/loss results for the past 20 candles.