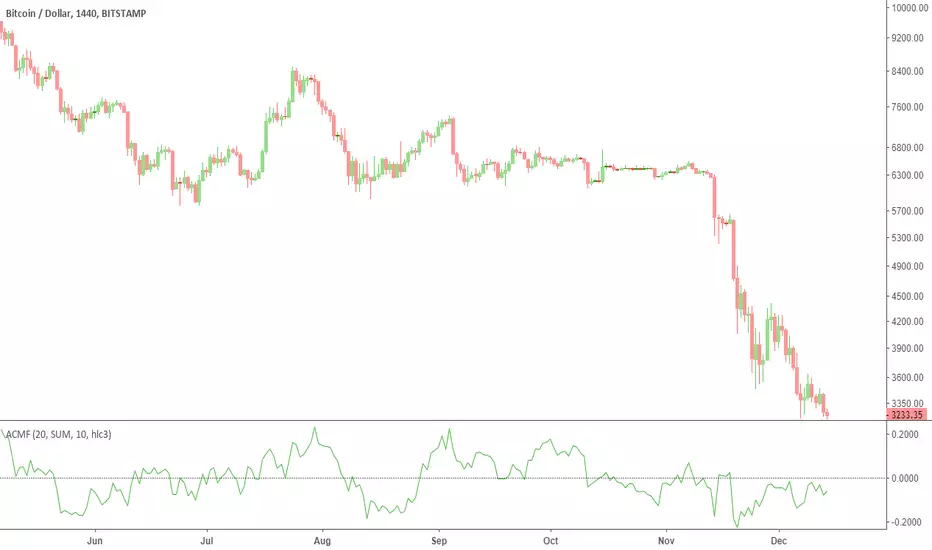
Chaikin Oscillator HystogramThis indicator shows an hystogram with the Chainkin Oscilator values, with color changes in function of the direction (up/down) . Also show the 0 crossovers, up and down.
Chaikin Oscillator gets its name from its creator, Marc Chaikin.
The Chaikin Indicator applies MACD to the accumulation-distribution line rather than closing price.
For me it's very usefull to identify (or confirm) trends up and trends down.
All my published scripts:
es.tradingview.com
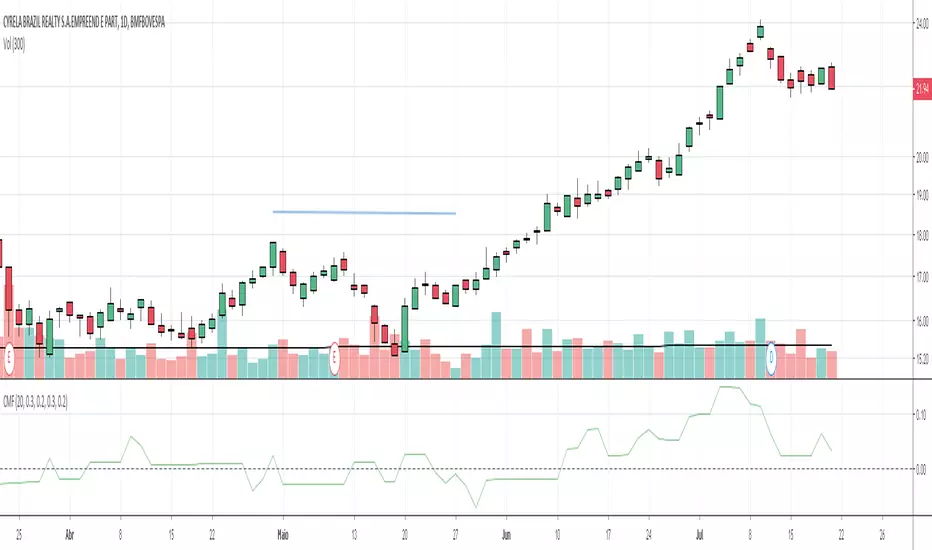
Денежный поток Чайкина (CMF)

Combo Backtest 123 Reversal & Chaikin Volatility This is combo strategies for get a cumulative signal.
First strategy
This System was created from the Book "How I Tripled My Money In The
Futures Market" by Ulf Jensen, Page 183. This is reverse type of strategies.
The strategy buys at market, if close price is higher than the previous close
during 2 days and the meaning of 9-days Stochastic Slow Oscillator is lower than 50.
The strategy sells at market, if close price is lower than the previous close price
during 2 days and the meaning of 9-days Stochastic Fast Oscillator is higher than 50.
Second strategy
Chaikin's Volatility indicator compares the spread between a security's
high and low prices. It quantifies volatility as a widening of the range
between the high and the low price.
You can use in the xPrice1 and xPrice2 any series: Open, High, Low, Close, HL2,
HLC3, OHLC4 and ect...
WARNING:
- For purpose educate only
- This script to change bars colors.

Combo Strategy 123 Reversal & Chaikin Volatility This is combo strategies for get a cumulative signal.
First strategy
This System was created from the Book "How I Tripled My Money In The
Futures Market" by Ulf Jensen, Page 183. This is reverse type of strategies.
The strategy buys at market, if close price is higher than the previous close
during 2 days and the meaning of 9-days Stochastic Slow Oscillator is lower than 50.
The strategy sells at market, if close price is lower than the previous close price
during 2 days and the meaning of 9-days Stochastic Fast Oscillator is higher than 50.
Second strategy
Chaikin's Volatility indicator compares the spread between a security's
high and low prices. It quantifies volatility as a widening of the range
between the high and the low price.
You can use in the xPrice1 and xPrice2 any series: Open, High, Low, Close, HL2,
HLC3, OHLC4 and ect...
WARNING:
- For purpose educate only
- This script to change bars colors.

Candle Money Flow (baseado no Chaikin Money Flow)O fluxo do dinheiro em velas eh baseado no Chaikin Money Flow e utiliza o conceito que o que importa eh a relacao do corpo com o tamanho total do candle. Assim, utilizamos a formula:
((close - open) / (high - low)) * volume
O grande diferencial eh que so colocamos no indicador os candles que sao permitidos. Os valores de descartes sao um percentual em relacao a maxima e minima dos candles.
Se esta configurado que um candle de baixa / negativo deve ser descartado por ter a abertura perto dos 50%, nos nao iremos considerar ele como um candle relavante e a contribuicao do mesmo para o calculo sera zero.
* Convido voce a ver o codigo e me mandar alguma sugestao de melhoria!
Abacus (CMF + Stoch. + Chop.) StrategyThis strategy combines uses Chaikin Money Flow, Stochastic Oscillator, and the Choppiness Index to determine trend strength and direction and generate entry and exit signals. This is a strategy adaptation of our earlier CMF + Stoch + Choppiness Index indicator.

Ultra CMF + Stoch. and Choppiness IndexThis is a fairly complex, but powerful indicator that combines 3 different indicators.
1. Chaikin Money Flow (CMF)-
Oscillator that uses the sum of Money Flow Volume (MFV) values over n periods to determine and compare the amount of
buying/selling pressure. We modified the CMF's scale so that values fluctuate between {-100, 100} for easier visualization.
If (CMF > 0)
then (buying pressure > selling pressure)
If (CMF < 0)
then (buying pressure < selling pressure)
Thus, CMF can be a valuable tool for confirming both uptrends and downtrends, as well as identifying divergences as a negative CMF
value in the midst of an uptrend indicates lack of strength.
In addition, we set bounds for the CMF values to prevent whipsaws during periods of horizontal price movement.
The CMF is shown on the bottom of the chart as the teal and fuchsia histogram.
Teal bars means (CMF < 0) and fuchsia bars means (CMF > 0).
2. Choppiness Index -
The Choppiness Index is another oscillator that works synergistically with the Chaikin Money Flow to prevent entries during choppy
conditions (when there is no clear trend direction and movement is horizontal). Although it is blind to the actual direction of the
price movement, we use it to distinguish periods of consolidation from "trendy" markets. Values fluctuate between {0, 100}, with 50
acting as the center-point. We've also set thresholds for chop values that are utlized to optimize entry and exit timing.
The Choppiness Index is plotted as the green and pink circle line at the top of the chart. If movement is choppy(choppy > 50), then
circles are pink. If choppiness is low(chop < 50), then the circles are green.
3. Fast and Slow Stochastics -
Lastly, we use a fast and a slow stochastic momentum oscillator. This is a fairly common approach, as it allows us to detect signals
on a wider range of sensitivity.The slow stochastic confirms the high quantity of signals generated by the more hyper-sensitive
fast stochastic.
The fast and slow K and D values are not plotted on the graph by default, but users can change that in the inputs to choose which
ones to show on the graph(as shown in the bottom pane). The upper and lower bounds can also be chosen to increase/decrease
signal sensitivity.
All values such as lengths, bounds, etc. can be changed by users through the input options.
The Graph:
Chaikin Money Flow - Shown as the teal and pink zero-centered oscillator at the bottom of the chart. Bars are teal when CMF is less than
zero and fuchsia when CMF value is greater than 0. Users can choose whether the CMF is plotted by changing the 'plotCMF' input.
-The CMF histogram is shown in the second and third panes.
Choppiness Index - Plotted as the pink and teal line of circles at the top of the chart. Circles are pink if they are above 50 (high chop) and
teal when they are below 50 (low chop). Users can choose whether it is plotted through the 'plotChop' input.
-The Choppiness Index is shown in the second and third panes.
Stochastics - Not plotted by default, but users can choose to have them shown by adjusting the values in the input options menu. If you want,
there is an option to plot both fast and slow K and D values (4 total lines) and the upper and lower bounds that are used to determine entries
and exits.
NOTE: I tried to show all the ways that you can choose to display all the different indicators in the different panes, but there are a million
different ways you can choose to have the chart laid out through changing the inputs. You could have it be as simple as plotting just the 'B'
and 'S' for entries and exits or a complex graph with the CMF, Chop, and stochastics all plotted together.
HOW TO USE:
There is a set of conditionals for each of the three indicators to determine both entry and exit points. To simplify this, we decided to divide them
into red circles for exit conditions and green squares for entry conditions.
LONG ENTRIES:
1. If the conditions for the stochastics are met, a green square is plotted at the top of the chart.
2. If the conditions for the CMF are met, a green square is plotted at the center of the chart.
3. If the conditions for Choppiness Index are met, a blue circle is plotted at the bottom.
TRADE WHEN: There is a green square at the top, green square in the middle, and a blue circle at the bottom.
A GREEN 'B' IS PLOTTED IN THE CENTER OF THE GRAPH WHEN THE ABOVE REQUIREMENTS ARE TRUE...Enter position at that point.
LONG EXIT:
1. If the conditions for the stochastics are met, a red circle is plotted at the top of the chart.
2. If the conditions for CMF are met, a red circle is plotted at the center of the chart.
3. If the conditions for Choppiness Index are met, a blue circle is plotted the bottom.
TRADE WHEN: There is a red circle at the top, red circle in the middle, and blue circle at the bottom.
A RED 'S' IS PLOTTED AT THE CENTER OF THE GRAPH WHEN THE ABOVE REQUIREMENTS ARE TRUE....Exit Position at that point.
ALERTS:
An alert is sent when all buy conditions are met, informing the trader to enter a long position.
The same is done for sell conditions.
Like I said earlier, there are tons of input options to change this indicator to fit your specific use, as well as display options. I've tailored the settings
for trading BTC/USD, but it is a very versatile indicator and can be adapted for whatever you're trading.

💸 Divergence Finder v1.0 by Cryptothythms💸 Divergence Finder v1.0 by Cryptothythms
Intro
This indicator is meant as a quantitative look at divergences. Special thanks to RicardoSantos (legend!) for his divergence detection script which was used as a basis to construct this.
Usage
Lime Green = Regular Bullish Divergence
Dark Green = Hidden Bullish Divergence
Red = Regular Bearish Divergence
Maroon = Hidden Bearish Divergence
Remember... divergences do not have a high probability success overall. So to mitigate that this is an attempt to source many "opinions" on the state of divergence from many different classes of indicators.
Leading indicators - Lead price action, but have a higher probability of false signals
Real time indicators - Track price action, momentum, etc in a tick by tick state. Generally a 1-3 bars lag can be present.
Lagging indicators - Lag price action a little, but offer more in terms of confirmation of the divergence
Volume indicators - Look at volume flow in different fashions and give an added dimension to divergence finding. Remember volume divergences interact with price independently. For instance volume can be going down, but price going up. Be sure to understand the relationship of volume and price action when considering these readings.
👍 Enjoying this indicator or find it useful? Please give me a like and follow! I post crypto analysis, price action strategies and free indicators regularly.
💬 Questions? Comments? Want to get access to an entire suite of proven trading indicators? Come visit us on telegram and chat, or just soak up some knowledge. We make timely posts about the market, news, and strategy everyday. Our community isn't open only to subscribers - everyone is welcome to join.
For Trialers & Chat: t.me/cryptorhythms

Chaikin Money Flow Filtered [aamonkey]What I don't like about the CMF indicator is that it can be very choppy.
That's why I created the Filtered Chaikin Money Flow.
I don't know if someone else already had the same idea but I think it improves the indicator.

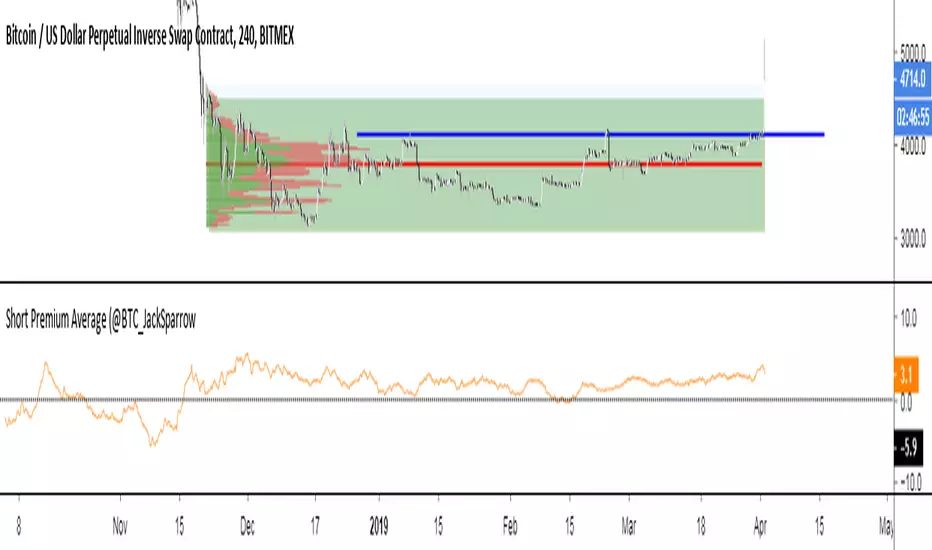
Short Premium Average (@BTC_JackSparrow)Used to calculate average premium on shorts.
Choose index and contract tickers & you are good to go.
Analyze for each asset what PA premium on a certain side leads to.
Use this to get an understanding for HTF bias.
Zero Lag Money Flow [jwammo12]This indicator adds Zero Lag principles to a modified Chaikin Money Flow.
This is essentially the Chaikin Money Flow indicator that uses true range to remove the issues that arise from gaps that the original CMF algorithm had. Then, momentum is used to remove lag from the indicator.
The Lag parameter is the lookback used for the momentum component

TJ Money FlowTJ Money Flow, one of the most frequently used indicators by me.
This indicator is a modification of the CMF and it has great use and multiple interpretation possibilities.
I like treating it like the addition of StochRSI to RSI, just that TJ-MoneyFlow works like a "behind the scenes tool" of the volume indicator.
The first most important thing about it are the spikes. I like seeing a movement either up or down, confirming it with a spike in the TJ-MF.
The next sparkle about it is the modification of movements down and movements up.
When it moves down, it is in blue color, when it moves up it is in green color.
This lets me compare the candle direction to the Money Flow direction.
Bigger clouds of the same color indicate strength in the direction.
One more step that I like using the TJ-MoneyFlow for is for divergences. Either divergences on a cloud itself, regardless from its color.
Or divergences over two separate clouds. The idea is, if there is a significant trend, then it should be confirmed by the MoneyFlow.
Like and Follow me and you will find this page interesting because I am a TA expert and professional day trader in crypto since 2012 that does daily updates and new posts about the hottest and most discussed coins.
Cheers, TJ

Chaikin Money FlowSimple indicator, so there's not really much to enhance. This is a more colorful version of the built-in CMF.
// Developed by Marc Chaikin, Chaikin Money Flow measures the amount of Money Flow Volume over a specific period.
// Money Flow Volume forms the basis for the Accumulation Distribution Line. Instead of a cumulative total of
// Money Flow Volume, Chaikin Money Flow simply sums Money Flow Volume for a specific look-back period, typically
// 20 or 21 days. The resulting indicator fluctuates above/below the zero line just like an oscillator. Chartists
// weigh the balance of buying or selling pressure with the absolute level of Chaikin Money Flow. Chartists can
// also look for crosses above or below the zero line to identify changes on money flow.
Chaikin Money FlowThis script plots the original Chaikin Money Flow in addition of highlighting positive/negative pressure areas.


Ultimate Money Flow (UMF), Stoch, Multi Time Frame (MTF) [cI8DH]This indicator adds stochastic, multi time frame, signal line, histogram, and bar coloring options to my previous indicators. It can also replicate standard Money Flow Index ( MFI ), Chaikin's Accumulation/Distribution Line ( ADL ), On Balance Volume ( OBV ) and Price-Volume Trend ( PVT ). This indicator can be used for analyzing momentum, buy/sell pressure, overbought/oversold conditions, and trendiness/choppiness, as well as identifying swings (stoch). Chart below shows example multi-TF setup with bar coloring.
For analyzing price, I made a similar indicator based on Absolute and Relative Strength Indices, which you can find in the link below.
Equation
Here is part of the code used in the script: pastebin.com
Standard MFI, OBV, ADL and PVT
To validate the calculations, I stacked UMF on MFI, OBV, ADL, and PVT in the chart below (100% overlaps validate the calculations). It also shows how you can replicate these indicator if you'd like to use them, or if you want to make your own custom indicator by combining features from different indicators. I do not recommend MFI, ADL or OBV; read "why invent a new indicator" section below. (bear in mind that MFI scale is 0-100, while UMF scales is -100 to 100)
Money Flow based on "Balance of Power" (this is the default mode)
Balance of Power (BoP) equation is: (close - open) / (high - low)
In my opinion, BoP is the most accurate equation to measure the amount of volume accumulated or distributed. I used BoP in my previous open source indicators ADV , ADL , ADP and ADMF . I applied the "True Range" fix to BoP equation similar to what Twiggs did on CMF .
Aggregation Method
By changing aggregation methods, you can replicate my previous indicators which are also linked at the bottom of this page. Please read more about their applications in their respective pages.
aggregation method = Cumulative => ADL indicator: accumulation/distribution (price factoring should be turned off)
aggregation method = MA => ADMF indicator: accurate buy/sell pressure, momentum and divergence
aggregation method = MA Percent => ADP indicator: overbought/oversold conditions, buy/sell pressure, momentum and divergence, failure swings
Smoothing, signal line and histogram to detect trend and choppiness
You can apply additional smoothing to UMF. Also, you can add a signal line and histogram (histogram is the difference between main line and signal line). To do so, set the signal length to a number greater than one. Signal line can help you detect changes in trend similar to the signal line on MACD. If signal line criss-crosses UMF, it shows market is choppy. The worst case is when this criss-crossing coincides with UMF flattening near neutral line and histogram height is short; that means market is ded (until it is not; expansion following a contraction period is a common phenomena)! (Bear in mind that histogram will not show in stoch mode.)
Stochastic
To enable stoch, change the stoch length to a number greater than 1 (default stoch length for the built-in stoch RSI is 14). This length should be calibrated depending on TF and asset. If done correctly, it can be a powerful tool for identifying swings. Stoch can be combined with any aggregation method. I recommend using stoch with MA or cumulative aggregation methods. For conventional uses of stochastic, please read www.tradingview.com(STOCH) and www.tradingview.com(STOCH_RSI).
Experimental Bar coloring Feature
There is an option to color bars depending on UMF's position relative to the signal line. If both TFs are used in coloring and they are in disagreement, the TF with greater histogram height wins. There are two shades of green and red. The darker shade means both TFs agree. If you use the signal line, bar coloring can help with calibrating the indicator (play with parameters until you see a good looking chart i.e. a lot of green candles followed by a lot of red candles in a row). Please note that bar colors might change until candle(s) close(s). The bar coloring rules will most likely change in the future.
Notes
- Uncheck "Factor Price" for Bitmex or any other exchange that shows volume in terms of money.
- UMF is a replacement to ADP , ADMF and ADL , so no more updates for the old indicators!
- Smooth MA length N = EMA length 2*N-1
- Combined tickers, e.g. (COINBASE:BTCUSD+BITSTAMP:BTCUSD+KRAKEN:XBTUSD)/3, can mitigate inconsistency issues between different exchanges (I recommend not mixing USD and USDT pairs together)
Why invent a new indicator
I have spent a great deal of time to find the best equation that represents accumulation/distribution. Each of the well-known methods have a major flaw.
- Winner-take-all problem
MFI, OBV and to some extent Williams AD assign accumulation or distribution based on the direction of change in price. They don't account for the amount of change. That means the indicator does not differentiate between a full candle and a doji candle.
- Extreme divergence problem
Chaikin tried to avoid winner-take-all problem. However, he ended up with a solution that, in my opinion, is even worse. A big flaw of Chaikin's indicators is that they can diverge too much from price. Most responsive indicators in this class, require at least two candles to diverge from price, but CMF/ADL can diverge in a single candle. Chaikin used the same component ( aka Chaikin's money flow multiplier) in both CMF and ADL. CMF 's flaws may not be as visible because it is a normalized oscillator. However, this common flaw is more evident in accum/dist indicator which keeps all past information in its memory. As you can see in the chart below, accum/dist is constantly rising during an obviously distribution period.
ADV (Volume)
ADP
ADMF
ADL
Please give a like, and share the interesting configurations you find in the comments.

CMF+CMF+ is a CMF study enhanced with a linear regression moving average.
Default Settings:
CMF: 13
Linear Regression of CMF: 34
Activate Vertical Bar Highlights and/or Signal Flags for:
- CMF Oversold/Overbought. (Default: Highlight Bar)
- CMF Extended Oversold/Overbought. (Default: Highlight Bar)
- CMF crossing its Linear Regression . (Default: Signal Flag)
Users can also do extra tuning in Style Section of Format options.
To use this indicator we need to observe the market's behaviour and identify which settings are fit for the timeframe and type market you trading.
Recommended suggested settings
CMF: 13/14
Linear Regression of CMF: 34/21
The market behaves differently when the pacing changes, volatility change and, when it trends or when it ranges. Develop an understanding of it with the help of this study.
Avoid risking more than 1% per trade. Be responsible for always making a priority about protecting capital and managing risk.

Chaikin MF% (CMFP) w. Alerts, Bells & Whistles [LucF]This is Chaikin’s Money Flow indicator on a 0-100 scale with buy/sell signals, alerts and other bells & whistles.
It includes:
- a fast EMA (16 periods by default),
- a slow MA (64 periods by default),
- histograms,
- 3 different sorts of crosses,
- big swings identification,
- buy/sell signals on CMFP crossing back from outside user-defined levels,
- buy/sell signals on the slow MA pivots above/below user-defined levels,
- alerts on big swings and buy/sells.
This indicator started with @LazyBear code (VAPI) at:
@cI8DH then changed the scale to 0-100, which I find very useful:
I then added the rest.
The chart above shows both clean and busy versions of the indicator.
Note that the default length is 10 rather than the commonly used 20. I use CMFP in conjunction with VFI and like the fact that it is faster than VFI. The default inputs show the way I normally use this indicator, with the slow MA shown in histogram mode. I find it gives good context to the signal line. Crosses between the two are often useful.
The buy/sell signals aren’t the main attraction of this indicator, and nothing to write home about. Like the big swing markers, I think it’s more realistic to view them as pointers to potentially interesting areas on charts. Their nature makes them more suited to identifying reversals. They certainly aren’t reliable enough to turn this study into a strategy and I normally don’t use them. The levels pre-defined for the buy/sell signals on CMFP are most useful on short intervals. The buy/sell signals on the slow MA pivots work on a more complete range of intervals. Optimization for your specific instruments and intervals will improve their reliability.
As usual when defining alerts, be sure you already have defined proper inputs and that you are on the intended interval, as they will be used when triggering alerts.

AtraxaLooking for:
X - Momentum divergence
Y - RSI Divergence
Z - Stochastic oversold/overbought region
Filter some signals with cmf
Each overlap prints different combination example...
XY - Momentum + RSI
YZ - RSI + Stochastic
True Range Specified VolumeThis indicator measures the "Effort" required to shift price.
By using Volume and Average True Range, it reveals how much volume was used to create each candle period.
The resistance threshold is set to 1.5x and will light up with an aqua or purple colour (bullish or bearish candle).
This means that the current bar is 1.5 times the previous bar and can be seen as a signal of a buying or selling frenzy - potential reversal.
If the bars light up with lime green or red, then this indicates that the value has exceeded TWICE the resistance threshold - a very strong signal.
A moving average is also included and can be set to filter out lower level signals. you can choose either a SMA or EMA and can adjust this moving average up or down by a percentage.
There is also an option to use the standard candle range rather than Average true range, should you get curious.
Enjoy!!
------------------------------------------------------------------
Kind regards
Created 2018 - by @Squiggles#8806
Want to support the creation of these indicators?
LTC Tip Jar: LX4bUBdjiRPsagUbZoAczSGgDC4YqTJL7w

Variable Volume Oscillator v1 [NeoButane]These are volume based indicators put onto an oscillator by using SMA for most of them. Most volume based indicators are leading indicators so you may find a use for each of them. The WMA is a length of 21, as suggested by the original inventor of OBV. It is useful for crosses and determining future moves.
What's currently included:
OBV Oscillator, remade. The formula has been changed to smooth out the way OBV is calculated during a trending move
OBV Oscillator, original OBV formula.
Price Volume Trend Oscillator. Similar to OBV, except price is taken into account as well.
Price Volume Trend Oscillator, log.
Accumulation/Distribution. (close - low) - (high - close) / (high - low), then multiplied by volume
Chaikin Money Flow. Very similar to accum/dist except it was already made into an oscillator.
OBV just by itself
Experimental function that utilizes a part of CCI

Accumulation/Distribution Percentage (ADP) [Cyrus c|:D]Accumulation/Distribution Percentage ( ADP ) is used to measure money flow similar to Chaikin Money Flow ( CMF ) and Money Flow. It is the range-bound version of my previous indicator ADMF. This indicator can be used for analyzing momentum, buy/sell pressure, and overbought/oversold conditions. I believe that this indicator is more accurate than CMF and MFI (I will publish a TA about it one day!).
What to look for:
- When this indicator moves up, it means buy pressure is increasing and the other way around for sell pressure. Crossing 0 means that trend has changed in the given period (it is best to look for confirmation of buy/sell pressure in larger TFs)
- Overbought above 40 and oversold below -40 (these numbers vary depending on the security. Look for historical levels to determine overbought and oversold conditions of each security)
- Regular divergence shows that momentum of a trend is declining. Hidden divergence implies continuation of a trend. The non-bound mode should be more accurate for identifying divergence.
- Failure swings can detect potential reversals.
Please read Relative Strength Index and Money Flow for more information and similar disclaimers.
Recommendations:
- hlc3 (AKA typical price) as input source might be better than "close" as it captures more information. If you use hlc3 as a source, then change the chart type to line and set hlc3 as the source for identifying divergence.
- Use hybrid tickers e.g.(BITFINEX:BTCUSD+COINBASE:BTCUSD+BITSTAMP:BTCUSD)/3. Volume-based indicators are susceptible to wash trading/volume printing and hybrid tickers mitigate this issue.
- In non-bound mode, small TFs with longer length should be more accurate than larger TFs with standard length (same is true for many other indicators)
Background:
I have developed 4 indicators based on a simple but elegant concept of A/D ratio. A/D ratio is equal to (current close - previous close)/True Range (when there are no price gaps, True Range = High - Low)
1) What you see on ADV indicator as darker green and red is equal to A/D ratio x volume.
2) ADL indicator shows the summation of ADV
3) ADMF (or ADP in non-bound mode) shows Moving Average of ADV
4) ADP shows relative accumulation strength which is calculated as RMA (accumulations)/RMA(accumulation + distribution). ADP equation is based on RSI equation which is RMA(gains)/RMA(gains + losses). That is why these two indicators look quite similar.
PS: Please leave a like if you find these indicators useful. I am working on improvements on these and other indicators. I am trying my best to keep them as simple as possible. Please let me know in the comments if you want me to make future indicators even simpler.
--------
Complementary indicators based on the same concept:
ADL: a replacement for Chaikin's Accum/Dist, On Balance Volume, and Price Volume Trend
ADV: a replacement for regular volume indicator
ADP also has a scaled RSI and ADMF built in (ie ADMF is obsolete).

Accumulation/Distribution Money Flow [Cyrus c|:D]This indicator should be more accurate than other indicators in its class (including MFI, CMF, ADL, and OBV) for measuring buy/sell pressure, identifying trend change through divergence and calculating Accumulation/Distribution (A/D) level (I will explain why in a separate TA).
This indicator is based on my previous indicator "Accumulation/Distribution Volume". It does not include the volume bars. The volume effect is adjustable as well.
Application:
- Buy/sell pressure: above 0 shows buy pressure, below 0 shows sell pressure.
- Divergence: as shown in the chart above, this indicator diverged from BTC price during swing lows and highs in the shown period.
- Accumulation/distribution: set Aggregation=Sum, Volume Exponent=10 and uncheck Price Factor.
Recommendations:
- Never use SMA
- Use larger length EMA for confirmation of divergence or buy/sell pressure (EMA 27 is equal to RMA 14 which is used in RSI).
. A/D mode is not recommended for hidden divergence.
My Setup:
- I use one instances of this indicator with default settings for buy/sell pressure
- A second instance for A/D level overlaid on the main chart
- One instance of "Accumulation/Distribution Volume" as a replacement for volume indicator
This indicator can also replicate Accumulation/Distribution Line (improved by True Range), On Balance Volume, and Price Volume Trend. Read more details on the description of the previous indicator:
I strongly recommend reading about similar indicators for potential uses e.g. www.tradingview.com(MFI) and www.tradingview.com(PVT)
I will publish a TA about correctly measuring divergence and using these indicators.
Please report any problems you find in the comments.

Advanced Chaikin Money Flow (CMF)TL;DR: change the aggregation to EMA to achieve similar results to Twiggs Money Flow. Play with the rest of parameters to get the desired results.
This script allows customization of CMF. It also includes all the improvements made by Twiggs Money flow.
Regular CMF does not take price gaps into account as you can see in the chart below. True range fixes this issue, as done in Twiggs Money flow (TMF).
More info here: www.incrediblecharts.com
Customization Options:
- You can change the effect of volume by setting volume exponent. 0 to 10 reduces the effect and 10+ increases it. In exchanges with too much wash trading, you may want to reduce volume effect.
- You can factor in price in CMF. It gives you a slightly different results. See my Volume x price (VxP) indicator for why it might be useful.
- The range can be changed to percentage (similar to RSI)
PS: I do not recommend using CMF in today's Crypto markets. Chaikin uses the same multiplier in CMF and Accumulation/Distribution Line (ADL). ADL is a totally broken indicator for BTC. If you look at the period after ATH (chart below), you will notice that ADL keeps increasing implying accumulation. While it is clear that there was distribution going on. The reason might be the artificially inflated prices in Crypto that is achieved by the help of bots and having "certain" exchanges as a price reference. So, my reasoning is that if ADL is a broken indicator, so should be CMF. CMF diverges from BTC price frequently. This is a double edged sword IMO. Still CMF is a much better indicator than ADL because it works relative to prior periods which covers some of its flaws.
Note for super nerds: Twiggs Money Flow includes true range and Welles Wilder's Moving Average (WWMA). I have seen some other scripts using their own calculations for WWMA which is not efficient. WWMA is equal to built-in RMA/SMMA which is equal to EMA with length 2x-1.