Breakout Pro (B:Pro) v4.0Breakout PRO (B:Pro) v4.0 is a multi-filter breakout and trend suite designed for discretionary trading on any symbol and timeframe. It combines a custom EMA cloud, volatility and momentum filters, higher-timeframe trend, and quality scoring into one tool, instead of using multiple separate indicators.
Core concept
The script builds a three-layer EMA cloud around price. The relative position of fast, mid, and slow EMAs plus an ATR padding defines:
Bull regime: stacked EMAs with cloud acting as dynamic support
Bear regime: stacked EMAs with cloud acting as dynamic resistance
Neutral regime: mixed EMAs, cloud fades to neutral color
This cloud defines the main trend and the breakout levels (cloud upper / cloud lower).
A higher-timeframe 200 EMA (configurable timeframe) adds a long-term bias filter.
Support, resistance and structure
Last confirmed swing high and swing low are detected with pivot logic and plotted as dotted support / resistance lines.
These levels are invalidated with a small ATR buffer when price clearly breaks them.
Optional long-term EMA targets (T1 and T2, default 233 and 377) are plotted on the price scale as potential mean-reversion or trend-continuation targets.
Filters used in entries
Long and short breakout signals are only shown when multiple conditions agree. You can enable or disable each filter:
Volume: current volume vs volume SMA
MACD: direction and histogram momentum
RSI: classic OB/OS, with sentiment-adjusted levels
Stoch RSI: direction of K vs D in valid zones
Bollinger Bands + Keltner Channel: squeeze and BB breakouts
VWAP: price relative to VWAP
ADX: trend strength threshold
OBV and Ichimoku: optional extra trend confirmation
A separate Market Sentiment input (Standard, Bullish, Bearish, Consolidation) shifts RSI zones, ADX threshold, and volume requirements so the same logic adapts to different environments.
Signals and exits
The main entry logic:
Long signal: bull EMA stack, breakout above the last pivot resistance and above the upper cloud, plus all enabled long filters are satisfied.
Short signal: mirror conditions below support and below the lower cloud.
Trade state is tracked inside the script:
ATR-based stop level is set on entry using mode-dependent ATR multipliers.
Optional maximum trade duration (different for Short, Mid and Long modes).
Exit markers are plotted when stops are hit, the cloud / EMA stack flips against the trade, MACD or RSI contradict the position, or the time limit is exceeded.
Additional icons mark:
Strong breakouts / breakdowns with large ATR and volume
Squeeze releases after a volatility contraction
EMA cross signals
Continuation and potential reversal zones inside the cloud
Optional RSI divergence arrows based on a separate RSI tuned per trade mode.
Quality and safety scoring
For every entry the script computes:
Safety score (1–3): based mainly on volume, ADX trend strength, and alignment with the cloud regime.
Quality score (1–3): based on BB breakout, MACD and RSI agreement, and whether the signal matches the selected market sentiment.
You can:
Show small S/Q labels next to the entry signal
Use the fixed panel in the bottom-left corner to view the last 5 trade events (opens, closes, crosses) with their S and Q values.
Inputs and layout options
Key inputs:
Trade Mode: Short (e.g. 30 min), Mid (e.g. 4h), Long (e.g. 1D+). Adjusts EMA lengths, ATR settings and the RSI length used for divergences.
Market Sentiment: adjusts filters as described above.
Per-filter toggles for volume, MACD, RSI, Stoch RSI, BB, Ichimoku, ADX, OBV, VWAP, HTF levels.
Panel size: Desktop, Phone, or None for the signal history table.
Side labels: Desktop (full text labels on the price scale) or Phone (compact labels without text) for better compatibility on small screens.
Usage notes
This is a technical analysis tool, not a trading system or financial advice. Signals are calculated on closed data without intentional look-ahead, but values on the current forming bar can still change until the bar closes. Use the script as a structured framework for trend, breakout and confluence analysis, and always confirm signals with your own risk management and testing.
Cloud

Future Ichimoku Cloud - HorizonIchimoku Horizon is an advanced Ichimoku indicator that projects future cloud formations and component lines, giving traders unprecedented visibility into potential support/resistance zones before they form.
1. Future Ichimoku Projections
Project Ichimoku components forward in time using simulated price evolution based on rolling Tenkan/Kijun windows
Manual forecast periods up to 125 bars (all 4 components) or 500 bars (cloud only)
Smart limit management automatically adjusts to TradingView's drawing object limits while maximizing visible projections
2. Preset & Custom Ichimoku Configurations
Choose from multiple common Ichimoku presets or fully customize your own
3. Multi-Timeframe Display & Projections
Display Ichimoku from higher/lower timeframes directly on your current timeframe chart
Automatic scaling adjusts Ichimoku periods correctly across timeframes
Intelligent handling of 24/7 markets (crypto/forex) vs traditional session-based markets
Built-in detection of problematic timeframe combinations with optional MTF cloud fetching for accuracy
Automatic notifications when future projections are unavailable due to MTF constraints
4. Tenkan & Kijun Range Windows
Visual range windows that display the exact high/low range used for Tenkan and Kijun calculations
Optional High/Low markers placed at the exact bars they occur
Optional countdown labels show how many bars remain until the current High/Low expires from the rolling window
Range windows scale up and down dynamically to match display timeframe
5. Comprehensive Alert Suite
Built-in alerts for all major Ichimoku events: TK crosses, E2E entires, Kumo breakouts, etc.
All alerts are cloud-aware and displacement-correct.
How It Works
The indicator uses the traditional Donchian channel method to calculate Ichimoku components, then extends this logic forward by simulating future price action within the calculation windows (no new highs or lows). This creates a forward-looking projection of where support and resistance zones will form.
The range display feature helps traders understand why the lines are where they are by showing the exact high/low points and countdown timers for when these points will expire from the calculation.
Who This Indicator Is For:
Ichimoku traders who want future-aware context
Multi-timeframe analysts seeking correctly aligned clouds
Traders who want to understand Tenkan/Kijun mechanics
Users who need precision without manual recalculation
Notes:
Maximum 500 drawing objects limit managed automatically
Due to Pinescript/TradingView limitations, future Tenkan/Kijun line width is only modifiable in the source code.

VWMA CloudA volume-weighted moving average (VWMA) cloud consisting of fast and slow VWMAs. The lines are dynamically colored based on their relative positions, forming a visual cloud that highlights bullish and bearish trends.
A normal moving average (SMA or EMA) weights prices equally (or by recency) and ignores volume, so it reacts the same regardless of how much trading occurred. A volume-weighted moving average (VWMA) weights each price by its trading volume, so high-volume moves shift the average more and low-volume moves shift it less. This makes VWMA more representative of where the market is actually trading and filters out weak, low-participation moves.

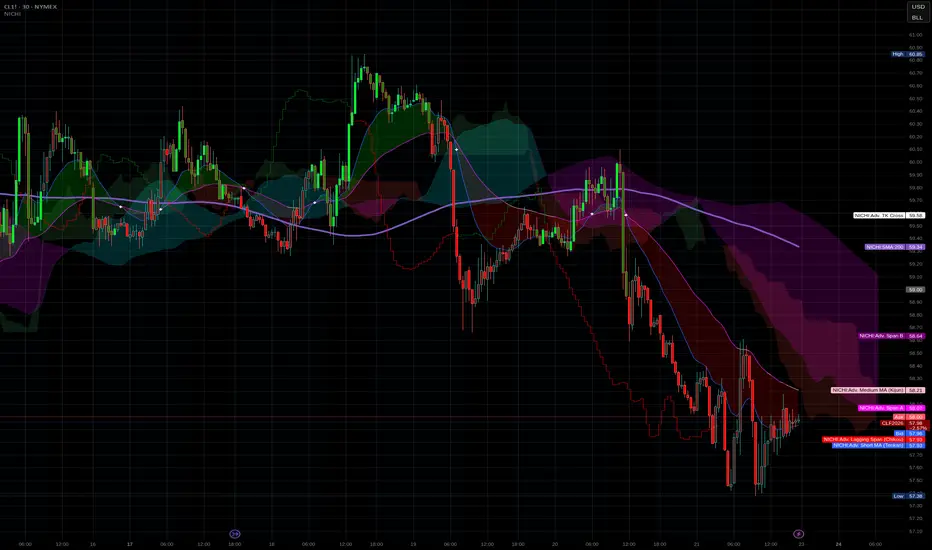
NICHI Beta (NuwenPham's Ichimoku)# **NuwenPham’s Ichimoku (NICHI)**
**Version BETA.251123a.3.1.2 – Pine Script v6**
**Author:** NuwenPham
**Forked from:** Donovan Wall
**Contributors:** Claude (Anthropic)
**License:** MPL 2.0
---
# **Overview**
**NICHI (Nuwen’s Ichimoku)** is a next-generation Ichimoku system that merges the classical Hosoda Ichimoku with a modular adaptive-smoothing engine, enhanced Kumo logic, directional trend counters, and multi-mode bar coloring.
The indicator includes **two completely separate Ichimoku engines**:
* **Standard Ichimoku** – Traditional Donchian-based Tenkan, Kijun, Senkou A/B, and Chikou
* **Advanced Ichimoku** – Fully customizable Ichimoku using 15+ moving-average filters and enhanced logic
NICHI is designed for modern markets—especially **futures and volatile instruments** (NG, CL, ES, NQ, crypto).
---
# **Key Features**
## **1. Dual Ichimoku Systems**
* **Standard Mode:**
Classic Donchian Ichimoku with Tenkan, Kijun, Senkou A/B, and Chikou.
Clean, faithful implementation.
* **Advanced Mode:**
Every Ichimoku line uses a **selected smoothing filter** (EMA, KAMA, FRAMA, Hull, McGinley, etc.).
Includes directional persistence tracking, enhanced cloud logic, and adaptive bar coloring.
---
## **2. Advanced Filter Engine (15+ Smooth Types)**
Use any of the following for Tenkan, Kijun, Senkou B, or Chikou:
* EMA
* DEMA
* SMA
* SMMA (RMA)
* WMA
* VWMA
* Hull MA
* ALMA
* LSMA (Linear Regression)
* McGinley Dynamic
* KAMA
* FRAMA
* COVWMA
* Moving Median
* 50th Percentile (Nearest Rank)
This transforms Ichimoku into an **adaptive trend system**.
---
## **3. Enhanced Cloud (Kumo) Modeling**
* Independent forward offsets for Span A & Span B
* Cloud colors adapt based on strength, direction, and filter behavior
* Cloud thickness reflects volatility
* Neutral cloud state available when spans disagree
---
## **4. Directional Persistence Counters**
NICHI tracks the **trend streak** of each main component:
* Tenkan rising/falling
* Kijun rising/falling
* Span A rising/falling
* Span B rising/falling
These counters make cloud and line colors more accurate and stable.
---
## **5. Regime-Based Bar Coloring (3 Modes)**
NICHI includes three built-in trading frameworks:
### **Mode 1: Kumo-Based**
Bar color reflects price relative to the cloud:
* Green = Above Kumo
* Red = Below Kumo
* Orange = Inside Kumo
Ideal for **trend-following** and **market regime detection**.
---
### **Mode 2: Tenkan/Kijun-Based**
Bar color reflects momentum structure:
* Green = Price above both Tenkan & Kijun
* Red = Price below both
Designed for **momentum entries and TK breakouts**.
---
### **Mode 3: Chikou-Based**
Bars reflect historical confirmation:
* Green = Chikou > price (offset period)
* Red = Chikou < price
Excellent for **confirmation-first strategies** where accuracy matters most.
---
## **6. Multi-MA Overlay System**
Up to **four optional moving averages**:
* SMA, EMA, SMMA, WMA, HMA, VWMA
* Independent lengths, widths, colors
* Useful for bias, confluence, trend filters
Default: **SMA 200** enabled.
---
## **7. TK Cross Signals**
Both systems show TK crosses:
* Standard TK Cross (classic)
* Advanced TK Cross (filtered version)
Crosses appear with clear markers for entry/exit logic.
---
# **How to Use NICHI**
## **1. Choose Your Engine**
* **Standard:** Clean, classic Ichimoku
* **Advanced:** Adaptive, filter-driven Ichimoku
* **Both:** Comparative analysis
---
## **2. Select Your Filter Type (Advanced Mode)**
Suggested filters:
| Market | Filter Type | Notes |
| ---------------- | ---------------- | -------------------------- |
| Natural Gas (NG) | KAMA or FRAMA | Handles extreme volatility |
| Crude Oil (CL) | McGinley Dynamic | Smooths spikes |
| ES / NQ | SMMA or WMA | Balanced response |
| Crypto | Hull or ALMA | Handles momentum bursts |
| FX | EMA or SMMA | Classic, stable |
---
## **3. Choose a Bar-Color Strategy**
* **Kumo-Based:** Trend following
* **TK-Based:** Momentum and breakouts
* **Chikou-Based:** Highest confirmation/accuracy
Each strategy is valid and intentionally distinct.
---
## **4. Reading the Cloud**
* **Bullish Cloud:** Span A > Span B
* **Bearish Cloud:** Span A < Span B
* **Neutral Cloud:** Disagreement between spans
* **Thick Cloud:** High volatility / stronger structure
* **Thin Cloud:** Weak trend / potential twist
---
## **5. Entry & Exit Concepts**
### **Entries**
* **Momentum Entry:** TK cross with price above the cloud
* **Reversal Entry:** TK cross before a cloud twist
* **Confirmation Entry:** Chikou breaks cleanly above/below past price
### **Exits**
* Price falling through Kijun
* Re-entering the cloud
* Opposite TK cross
* Cloud flipping against position
---
# **Recommended Trading Approaches**
## **Kumo-Based Trend Strategy**
* Long above cloud, short below
* Avoid signals inside cloud
Best for swing/position trading.
---
## **TK-Based Momentum Strategy**
* Enter on Tenkan/Kijun breakout
* Bar color confirms momentum
* Cloud filter optional but helps
Great for high-velocity markets.
---
## **Chikou-Based Confirmation Strategy**
* Enter only when Chikou confirms structure
* Highest accuracy, fewest trades
* Ideal for volatile markets (NG, CL)
---
# **Closing Notes**
NICHI is a **research-grade Ichimoku framework** designed to handle modern volatility where traditional Ichimoku often fails.
It supports scalpers, swing traders, and system developers alike.
Experiment with:
* Filter types
* Cloud offsets
* Bar-color modes
* MA overlays
to match your strategy and market.


Luxy Adaptive MA Cloud - Trend Strength & Signal Tracker V2Luxy Adaptive MA Cloud - Professional Trend Strength & Signal Tracker
Next-generation moving average cloud indicator combining ultra-smooth gradient visualization with intelligent momentum detection. Built for traders who demand clarity, precision, and actionable insights.
═══════════════════════════════════════════════
WHAT MAKES THIS INDICATOR SPECIAL?
═══════════════════════════════════════════════
Unlike traditional MA indicators that show static lines, Luxy Adaptive MA Cloud creates a living, breathing visualization of market momentum. Here's what sets it apart:
Exponential Gradient Technology
This isn't just a simple fill between two lines. It's a professionally engineered gradient system with 26 precision layers using exponential density distribution. The result? An organic, cloud-like appearance where the center is dramatically darker (15% transparency - where crossovers and price action occur), while edges fade gracefully (75% transparency). Think of it as a visual "heat map" of trend strength.
Dynamic Momentum Intelligence
Most MA clouds only show structure (which MA is on top). This indicator shows momentum strength in real-time through four intelligent states:
- 🟢 Bright Green = Explosive bullish momentum (both MAs rising strongly)
- 🔵 Blue = Weakening bullish (structure intact, but momentum fading)
- 🟠 Orange = Caution zone (bearish structure forming, weak momentum)
- 🔴 Deep Red = Strong bearish momentum (both MAs falling)
The cloud literally tells you when trends are accelerating or losing steam.
Conditional Performance Architecture
Every calculation is optimized for speed. Disable a feature? It stops calculating entirely—not just hidden, but not computed . The 26-layer gradient only renders when enabled. Toggle signals off? Those crossover checks don't run. This makes it one of the most efficient cloud indicators available, even with its advanced visual system.
Zero Repaint Guarantee
All signals and momentum states are based on confirmed bar data only . What you see in historical data is exactly what you would have seen trading live. No lookahead bias. No repainting tricks. No signals that "magically" appear perfect in hindsight. If a signal shows in history, it would have triggered in real-time at that exact moment.
Educational by Design
Every single input includes comprehensive tooltips with:
- Clear explanations of what each parameter does
- Practical examples of when to use different settings
- Recommended configurations for scalping, day trading, and swing trading
- Real-world trading impact ("This affects entry timing" vs "This is visual only")
You're not just getting an indicator—you're learning how to use it effectively .
═══════════════════════════════════════════════
THE GRADIENT CLOUD - TECHNICAL DETAILS
═══════════════════════════════════════════════
Architecture:
26 precision layers for silk-smooth transitions
Exponential density curve - layers packed tightly near center (where crossovers happen), spread wider at edges
75%-15% transparency range - center is highly opaque (15%), edges fade gracefully (75%)
V-Gradient design - emphasizes the action zone between Fast and Medium MAs
The Four Momentum States:
🟢 GREEN - Strong Bullish
Fast MA above Medium MA
Both MAs rising with momentum > 0.02%
Action: Enter/hold LONG positions, strong uptrend confirmed
🔵 BLUE - Weak Bullish
Fast MA above Medium MA
Weak or flat momentum
Action: Caution - bullish structure but losing strength, consider trailing stops
🟠 ORANGE - Weak Bearish
Medium MA above Fast MA
Weak or flat momentum
Action: Warning - bearish structure developing, consider exits
🔴 RED - Strong Bearish
Medium MA above Fast MA
Both MAs falling with momentum < -0.02%
Action: Enter/hold SHORT positions, strong downtrend confirmed
Smooth Transitions: The momentum score is smoothed using an 8-bar EMA to eliminate noise and prevent whipsaws. You see the true trend , not every minor fluctuation.
═══════════════════════════════════════════════
FLEXIBLE MOVING AVERAGE SYSTEM
═══════════════════════════════════════════════
Three Customizable MAs:
Fast MA (default: EMA 10) - Reacts quickly to price changes, defines short-term momentum
Medium MA (default: EMA 20) - Balances responsiveness with stability, core trend reference
Slow MA (default: SMA 200, optional) - Long-term trend filter, major support/resistance
Six MA Types Available:
EMA - Exponential; faster response, ideal for momentum and day trading
SMA - Simple; smooth and stable, best for swing trading and trend following
WMA - Weighted; middle ground between EMA and SMA
VWMA - Volume-weighted; reflects market participation, useful for liquid markets
RMA - Wilder's smoothing; used in RSI/ADX, excellent for trend filters
HMA - Hull; extremely responsive with minimal lag, aggressive option
Recommended Settings by Trading Style:
Scalping (1m-5m):
Fast: EMA(5-8)
Medium: EMA(10-15)
Slow: Not needed or EMA(50)
Day Trading (5m-1h):
Fast: EMA(10-12)
Medium: EMA(20-21)
Slow: SMA(200) for bias
Swing Trading (4h-1D):
Fast: EMA(10-20)
Medium: EMA(34-50)
Slow: SMA(200)
Pro Tip: Start with Fast < Medium < Slow lengths. The gradient works best when there's clear separation between Fast and Medium MAs.
═══════════════════════════════════════════════
CROSSOVER SIGNALS - CLEAN & RELIABLE
═══════════════════════════════════════════════
Golden Cross ⬆ LONG Signal
Fast MA crosses above Medium MA
Classic bullish reversal or trend continuation signal
Most reliable when accompanied by GREEN cloud (strong momentum)
Death Cross ⬇ SHORT Signal
Fast MA crosses below Medium MA
Classic bearish reversal or trend continuation signal
Most reliable when accompanied by RED cloud (strong momentum)
Signal Intelligence:
Anti-spam filter - Minimum 5 bars between signals prevents noise
Clean labels - Placed precisely at crossover points
Alert-ready - Built-in ALERTS for automated trading systems
No repainting - Signals based on confirmed bars only
Signal Quality Assessment:
High-Quality Entry:
Golden Cross + GREEN cloud + Price above both MAs
= Strong bullish setup ✓
Low-Quality Entry (skip or wait):
Golden Cross + ORANGE cloud + Choppy price action
= Weak bullish setup, likely whipsaw ✗
═══════════════════════════════════════════════
REAL-TIME INFO PANEL
═══════════════════════════════════════════════
An at-a-glance dashboard showing:
Trend Strength Indicator:
Visual display of current momentum state
Color-coded header matching cloud color
Instant recognition of market bias
MA Distance Table:
Shows percentage distance of price from each enabled MA:
Green rows : Price ABOVE MA (bullish)
Red rows : Price BELOW MA (bearish)
Gray rows : Price AT MA (rare, decision point)
Distance Interpretation:
+2% to +5%: Healthy uptrend
+5% to +10%: Getting extended, caution
+10%+: Overextended, expect pullback
-2% to -5%: Testing support
-5% to -10%: Oversold zone
-10%+: Deep correction or downtrend
Customization:
4 corner positions
5 font sizes (Tiny to Huge)
Toggle visibility on/off
═══════════════════════════════════════════════
HOW TO USE - PRACTICAL TRADING GUIDE
═══════════════════════════════════════════════
STRATEGY 1: Trend Following
Identify trend : Wait for GREEN (bullish) or RED (bearish) cloud
Enter on signal : Golden Cross in GREEN cloud = LONG, Death Cross in RED cloud = SHORT
Hold position : While cloud maintains color
Exit signals :
• Cloud turns ORANGE/BLUE = momentum weakening, tighten stops
• Opposite crossover = close position
• Cloud turns opposite color = full reversal
STRATEGY 2: Pullback Entries
Confirm trend : GREEN cloud established (bullish bias)
Wait for pullback : Price touches or crosses below Fast MA
Enter when : Price rebounds back above Fast MA with cloud still GREEN
Stop loss : Below Medium MA or recent swing low
Target : Previous high or when cloud weakens
STRATEGY 3: Momentum Confirmation
Your setup triggers : (e.g., chart pattern, support/resistance)
Check cloud color :
• GREEN = proceed with LONG
• RED = proceed with SHORT
• BLUE/ORANGE = skip or reduce size
Use gradient as confluence : Not as primary signal, but as momentum filter
Risk Management Tips:
Never enter against the cloud color (don't LONG in RED cloud)
Reduce position size during BLUE/ORANGE (transition periods)
Place stops beyond Medium MA for swing trades
Use Slow MA (200) as final trend filter - don't SHORT above it in uptrends
═══════════════════════════════════════════════
PERFORMANCE & OPTIMIZATION
═══════════════════════════════════════════════
Tested On:
Crypto: BTC, ETH, major altcoins
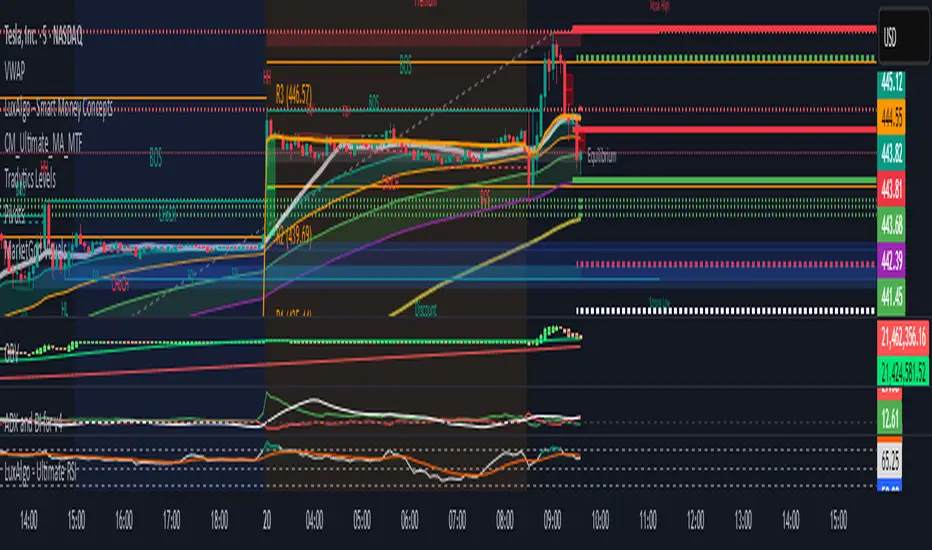
Stocks: SPY, AAPL, TSLA, QQQ
Forex: EUR/USD, GBP/USD, USD/JPY
Indices: S&P 500, NASDAQ, DJI
═══════════════════════════════════════════════
TRANSPARENCY & RELIABILITY
═══════════════════════════════════════════════
Educational Focus:
Detailed tooltips on every input
Clear documentation of methodology
Practical examples in descriptions
Teaches you why , not just what
Open Logic:
Momentum calculation: (Fast slope + Medium slope) / 2
Smoothing: 8-bar EMA to reduce noise
Thresholds: ±0.02% for strong momentum classification
Everything is transparent and explainable
═══════════════════════════════════════════════
COMPLETE FEATURE LIST
═══════════════════════════════════════════════
Visual Components:
26-layer exponential gradient cloud
3 customizable moving average lines
Golden Cross / Death Cross labels
Real-time info panel with trend strength
MA distance table
Calculation Features:
6 MA types (EMA, SMA, WMA, VWMA, RMA, HMA)
Momentum-based cloud coloring
Smoothed trend strength scoring
Conditional performance optimization
Customization Options:
All MA lengths adjustable
All colors customizable (when gradient disabled)
Panel position (4 corners)
Font sizes (5 options)
Toggle any feature on/off
Signal Features:
Anti-spam filter (configurable gap)
Clean, non-overlapping labels
Built-in alert conditions
No repainting guarantee
═══════════════════════════════════════════════
IMPORTANT DISCLAIMERS
═══════════════════════════════════════════════
This indicator is for educational and informational purposes only
Not financial advice - always do your own research
Past performance does not guarantee future results
Use proper risk management - never risk more than you can afford to lose
Test on paper/demo accounts before using with real money
Combine with other analysis methods - no single indicator is perfect
Works best in trending markets; less effective in choppy/sideways conditions
Signals may perform differently in different timeframes and market conditions
The indicator uses historical data for MA calculations - allow sufficient lookback period
═══════════════════════════════════════════════
CREDITS & TECHNICAL INFO
═══════════════════════════════════════════════
Version: 2.0
Release: October 2025
Special Thanks:
TradingView community for feedback and testing
Pine Script documentation for technical reference
═══════════════════════════════════════════════
SUPPORT & UPDATES
═══════════════════════════════════════════════
Found a bug? Comment below with:
Ticker symbol
Timeframe
Screenshot if possible
Steps to reproduce
Feature requests? I'm always looking to improve! Share your ideas in the comments.
Questions? Check the tooltips first (hover over any input) - most answers are there. If still stuck, ask in comments.
═══════════════════════════════════════════════
Happy Trading!
Remember: The best indicator is the one you understand and use consistently. Take time to learn how the cloud behaves in different market conditions. Practice on paper before going live. Trade smart, manage risk, and may the trends be with you! 🚀

Tradytics Levels with EMA CloudThis indicator has tradytics price chart levels where you can put in the input code seen below.
The code has positive gamma (green lines), negative gamma (Red lines) and white dotted line are the darkpool levels.
This is Amazon's 5 minute from Sep30th to October 20th Gammas and weekly Darkpool levels. Just copy and paste code below in the input code and the chart would show the levels.
212.8*1*neutral 220.07*1*neutral 216.038*1*neutral 215.57*1*neutral 219.988*1*neutral 217.401*1*neutral 217.351*1*neutral 212.815*1*neutral 212.75*1*neutral 212.4*1*neutral 215*0*negative 222.5*0*positive 217.5*0*positive 220*0*positive
Smooth Cloud + ZigZag VPOC CORE v6📌 Description
The Smooth Cloud + ZigZag VPOC indicator is designed to help traders visualize market structure and potential confluence zones.
Smooth Cloud: Built from smoothed moving averages (EMA, RMA, or HMA), this cloud highlights the underlying short-term trend by shading bullish and bearish phases.
Pivots (ZigZag style): Marks confirmed swing highs and lows, helping to identify support/resistance and breakout areas without repainting.
VPOC (Volume Point of Control): Plots the price level with the highest traded volume, either from a rolling lookback or anchored to a custom date. This often acts as a magnet or reaction level.
ATR Bands: Optional dynamic bands based on volatility to frame potential extension zones.
Signals & Alerts: Generates long/short labels when price breaks pivot levels in line with trend filters, with optional confluence from HTF trend, VPOC, and ATR.
This tool combines trend context, structure, and volume confluence in a single view to support decision-making.
✅ Notes
This script is intended for technical analysis and educational use only.
It does not provide financial advice or guaranteed outcomes.
Signals are purely analytical and should be combined with independent risk management.

RSI Cloud v1.0 [PriceBlance] RSI Cloud v1.0 — Ichimoku-style Cloud on RSI(14), not on price.
Recalibrated baselines: EMA9 (Tenkan) for speed, WMA45 (Kijun) for stability.
Plus ADX-on-RSI to grade strength so you know when momentum persists or fades.
1. Introduction
RSI Cloud v1.0 applies an Ichimoku Cloud directly on RSI(14) to reveal momentum regimes earlier and cleaner than price-based views. We replaced Tenkan with EMA9 (faster, more responsive) and Kijun with WMA45 (slower, more stable) to fit a bounded oscillator (0–100). Forward spans (+26) and a lagging line (−26) provide a clear framework for trend bias and transitions.
To qualify signals, the indicator adds ADX computed on RSI—highlighting whether strength is weak, strong, or very strong, so you can decide when to follow, fade, or stand aside.
2. Core Mapping (Hook + Bullets)
At a glance: Ichimoku on RSI(14) with recalibrated baselines for a bounded oscillator.
Source: RSI(14)
Tenkan → EMA9(RSI) (fast, responsive)
Kijun → WMA45(RSI) (slow, stable)
Span A: classic Ichimoku midline, displaced +26
Span B: classic Ichimoku baseline, displaced +26
Lagging line: RSI shifted −26
3. Key Benefits (Why traders care)
Momentum regimes on RSI: position vs. Cloud = bull / bear / transition at a glance.
Cleaner confirmations: EMA9/WMA45 pairing cuts noise vs. raw 30/70 flips.
Earlier warnings: Cloud breaks on RSI often lead price-based confirmations.
4. ADX on RSI (Enhanced Strength Normalization)
Grade strength inside the RSI domain using ADX from ΔRSI:
ADX ≤ 20 → Weak (transparency = 60)
ADX ≤ 40 → Strong (transparency = 15)
ADX > 40 → Very strong (transparency = 0)
Use these tiers to decide when to trust, fade, or ignore a signal.
5. How to Read (Quick rules)
Bias / Regime
Bullish: RSI above Cloud and RSI > WMA45
Bearish: RSI below Cloud and RSI < WMA45
Neutral / Transition: all other cases
6. Settings (Copy & use)
RSI Length: 14 (default)
Tenkan: EMA9 on RSI · Kijun: WMA45 on RSI
Displacement: +26 (Span A/B) · −26 (Lagging)
Theme: PriceBlance Dark/Light
Visibility toggles: Cloud, Baselines, Lagging, labels/panel, Overbought/Oversold, Divergence, ADX-on-RSI (via transparency coloring)
7. Credits & License
Author/Brand: PriceBlance
Version: v1.0 (Free)
Watermark: PriceBlance • RSI Cloud v1.0
Disclaimer: Educational content; not financial advice.
8. CTA
If this helps, please ⭐ Star and Follow for updates & new tools.
Feedback is welcome—comment what you’d like added next (alerts, presets, visuals).

OBV Cloud v1.0 [PriceBlance]🌐 English
OBV Cloud v1.0 – Free & Open-Source
OBV Cloud v1.0 integrates On-Balance Volume (OBV) with a Cloud model and enhanced trend filters.
It helps traders quickly identify:
Money Flow Trend: OBV Cloud acts as a dynamic support/resistance zone.
Trend Filters: EMA9 (short-term) and WMA45 (medium-term) directly applied on OBV.
OBV–Price Divergence: Detects both regular and hidden bullish/bearish divergences.
Trend Strength: Measured with ADX calculated on OBV.
OBV Cloud is suitable for both swing and day trading, allowing traders to spot breakouts, reversals, or sustained trends through volume-based analysis.

Uptrick: Volatility Weighted CloudIntroduction
The Volatility Weighted Cloud (VWC) is a trend-tracking overlay that combines adaptive volatility-based bands with a multi-source smoothed price cloud to visualize market bias. It provides users with a dynamic structure that adapts to volatility conditions while maintaining a persistent visual record of trend direction. By incorporating configurable smoothing techniques, percentile-ranked volatility, and multi-line cloud construction, the indicator allows traders to interpret price context more effectively without relying on raw price movement alone.
Overview
The script builds a smoothed price basis using the open, and close prices independently, and uses these to construct a layered visual cloud. This cloud serves both as a reference for price structure and a potential area of dynamic support and resistance. Alongside this cloud, adaptive upper and lower bands are plotted using volatility that scales with percentile rank. When price closes above or below these bands, the script interprets that as a breakout and updates the trend bias accordingly.
Candle coloring is persistent and reflects the most recent confirmed signal. Labels can optionally be placed on the chart when the trend bias flips, giving traders additional visual reference points. The indicator is designed to be both flexible and visually compact, supporting different strategies and timeframes through its detailed configuration options.
Originality
This script introduces originality through its combined use of percentile-ranked volatility, adaptive envelope sizing, and multi-source cloud construction. Unlike static-band indicators, the Volatility Weighted Cloud adjusts its band width based on where current volatility ranks within a defined lookback range. This dynamic scaling allows for smoother signal behavior during low-volatility environments and more responsive behavior during high-volatility phases.
Additionally, instead of using a single basis line, the indicator computes two separate smoothed lines for open and close. These are rendered into a shaded visual cloud that reflects price structure more completely than traditional moving average overlays. The use of ALMA and MAD, both less commonly applied in volatility-band overlays, adds further control over smoothing behavior and volatility measurement, enhancing its adaptability across different market types.
Inputs
Group: Core
Basis Length (short-term): The number of bars used for calculating the primary basis line. Affects how quickly the basis responds to price changes.
Basis Type: Option to choose between EMA and ALMA. EMA provides a standard exponential average; ALMA offers a centered, Gaussian-weighted average with reduced lag.
ALMA Offset: Determines the balance point of the ALMA window. Only applies when ALMA is selected.
Sigma: Sets the width of the ALMA smoothing window, influencing how much smoothing is applied.
Basis Smoothing EMA: Adds additional EMA-based smoothing to the computed basis line for noise reduction.
Group: Volatility & Bands
Volatility: Choose between StDev (standard deviation) and MAD (median absolute deviation) for measuring price volatility.
Vol Length (short-term): Length of the window used for calculating volatility.
Vol Smoothing EMA: Smooths the raw volatility value to stabilize band behavior.
Min Multiplier: Minimum multiplier applied to volatility when forming the adaptive bands.
Max Multiplier: Maximum multiplier applied at high volatility percentile.
Volatility Rank Lookback: Number of bars used to calculate the percentile rank of current volatility.
Show Adaptive Bands: Enables or disables the display of upper and lower volatility bands on the chart.
Group: Trend Switch Labels
Show Trend Switch Labels: Toggles the appearance of labels when the trend direction changes.
Label Anchor: Defines whether the labels are anchored to recent highs/lows or to the main basis line.
ATR Length (offset): Length used for calculating ATR, which determines label offset distance.
ATR Offset (multiplier): Multiplies the ATR value to place labels away from price bars for better visibility.
Label Size: Allows selection of label size (tiny to huge) to suit different chart setups.
Features
Adaptive Volatility Bands: The indicator calculates volatility using either standard deviation or MAD. It then applies an EMA smoothing layer and scales the band width dynamically based on the percentile rank of volatility over a user-defined lookback window. This avoids fixed-width bands and allows the indicator to adapt to changing volatility regimes in real time.
Volatility Method Options: Users can switch between two volatility measurement methods:
➤ Standard Deviation (StDev): Captures overall price dispersion, but may be sensitive to spikes.
➤ Median Absolute Deviation (MAD): A more robust measure that reduces the effect of outliers, making the bands less jumpy during erratic price behavior.
Basis Type Options: The core price basis used for cloud and bands can be built from:
➤ Exponential Moving Average (EMA): Fast-reacting and widely used in trend systems.
➤ Arnaud Legoux Moving Average (ALMA): A smoother, more centered alternative that offers greater control through offset and sigma parameters.
Multi-Line Basis Cloud: The cloud is formed by plotting two individually smoothed basis lines from open and close prices. A filled area is created between the open and close basis lines. This cloud serves as a dynamic support or resistance zone, allowing users to identify possible reversal areas. Price moving through or rejecting from the cloud can be interpreted contextually, especially when combined with band-based signals.
Persistent Trend Bias Coloring: The indicator uses the last confirmed breakout (above upper band or below lower band) to determine bias. This bias is reflected in the color of every subsequent candle, offering a persistent visual cue until a new signal is triggered. It helps simplify trend recognition, especially in choppy or sideways markets.
Trend Switch Labels: When enabled, the script places labeled markers at the exact bar where the bias direction switches. Labels are anchored either to recent highs/lows or to the main basis line, and spaced vertically using an ATR-based offset. This allows the trader to quickly locate historical trend transitions.
Alert Conditions: Two built-in alert conditions are available:
➤ Long Signal: Triggered when the close crosses above the upper adaptive band.
➤ Short Signal: Triggered when the close crosses below the lower adaptive band.
These conditions can be used for custom alerts, automation, or external signaling tools.
Display Control and Flexibility: Users can disable the adaptive bands for a cleaner layout while keeping the basis cloud and candle coloring active. The indicator can be tuned for fast or slow response depending on the strategy in use, and is suitable for intraday, swing, or position trading.
Summary
The Volatility Weighted Cloud is a configurable trend-following overlay that uses adaptive volatility bands and a structured cloud system to help visualize market bias. By combining EMA or ALMA smoothing with percentile-ranked volatility and a four-line price structure, it provides a flexible and informative charting layer. Its key strengths lie in the use of dynamic envelopes, visually persistent trend indication, and clearly defined breakout zones that adapt to current volatility conditions.
Disclaimer
This indicator is for informational and educational purposes only. Trading involves risk and may not be suitable for all investors. Past performance does not guarantee future results.

Uptrick: ATR ModelIntroduction
The Uptrick: ATR Model is a multi-regime directional tool designed to adapt to various trading styles and timeframes. It combines trend assessment, market state evaluation, visual overlays, and signal filtering into a single, highly configurable system. This indicator is intended to help traders interpret directional conditions, structure their entries and exits, and view real-time shifts in market context, all without relying on external scripts or multiple chart layers.
Core Functionality
At its foundation, the Uptrick: ATR Model builds a framework that responds to user-defined structure and market behavior. Through a wide range of inputs, traders can adjust the internal responsiveness, signal frequency, and volatility interaction of the system. The core behavior of the model can be shaped via:
Custom starting date for signal activation
Flexible smoothing structure
Adjustable expansion control for range boundaries
Signal persistence settings to limit noise
Conditional plotting of directional signals
Real-time bar coloring and overlays
Custom routing between long, short, and neutral positioning
This indicator is not tied to a single interpretation of market movement. Instead, it adapts to how the user defines structural behavior, volatility confirmation, and trend alignment.
Multi-Regime Architecture
The script includes four unique operating regimes, each offering a distinct model of interpreting market conditions:
Trend Mode
This regime focuses on trend state transitions over time. Signal behavior is aligned with directional market shifts and transitions are plotted with visual labels. Optional filters and persistence settings help control signal quality and responsiveness.
Cloud Close Mode
Cloud Close mode detects transitions when price interacts with dynamic boundaries. Signals are generated when the asset moves in or out of these ranges. This regime supports state memory to avoid repeated signals and emphasizes confirmation over reactivity.
Lightning Trend Mode
This mode evaluates momentum alignment across selected structures. Its behavior is based on composite assessments and dynamically reflects changes in directional agreement. This regime is well-suited for intraday or high-resolution users seeking visual confirmation of trend shifts.
Final Verdict Mode
A meta-regime that combines the output of the other three modes into a single directional consensus. A live decision table is displayed on-screen, showing the current verdict of each regime and a final, averaged output. This mode is designed for high-conviction or conservative traders who prefer confirmation across multiple systems.
Each regime can be enabled through a single selector, and the indicator adapts its signal behavior and bar coloring to reflect the active mode.
Signal System and Visual Feedback
The indicator generates Long, Short, or Cash (neutral/exit) signals depending on the active regime, directional configuration, and filter conditions. Signal shapes are plotted only once per state transition and are color-coded for clarity.
Users can define:
Whether signals should support both long and short, or long-only
Whether repeated signals are allowed (pyramiding control)
Whether to enforce a minimum number of confirming bars before a signal is allowed (persistence)
Signals are accompanied by real-time bar coloring, giving users an instant visual cue of the current state without relying on shape markers alone. These signals adjust based on the selected regime and are subject to any active confirmation filters.
Confirmation Filters
To reduce noise and improve the relevance of each signal, the model includes two optional filters:
Strength Filter
[Applies a condition based on the asset’s momentum. When enabled, signals will only fire if this condition aligns with the trade direction. Includes parameters for sensitivity and smoothness.
Trend Filter
Applies a directional filter based on a broader trend context. Signals will only trigger when this larger structure supports the directional bias. This filter is useful for avoiding signals during counter-trend moves or consolidations.
Both filters can be toggled independently. When disabled, the model will operate with fewer restrictions.
Dynamic Structure Customization
Users can control how the internal structure of the model behaves using:
Source selection (e.g., close, open, high, etc.)
Smoothing configuration using a tiered structure with up to three stages
Custom length inputs to adjust responsiveness
Selectable method options for each layer
Expansion settings to adjust the distance of dynamic boundaries
Signal persistence threshold to delay entries until confirmation is met
This modular control allows traders to define whether they want faster reaction to movement or more conservative, delayed responses depending on their strategy.
Final Verdict Table
The Final Verdict table is a live display that summarizes the signal output of the three core regimes (Trend, Cloud Close, and Lightning Trend). It includes:
Regime names and their current directional state
Directional scores for each regime
A final averaged score and directional label
The table is updated every bar and is fully customizable:
Position on screen (top left, center, bottom right, etc.)
Text size for readability
Color-coded state labels for fast interpretation
This feature is designed to offer structured decision support by showing consensus or divergence across all logic models in real time.
Static Levels Module
An optional module allows the user to anchor a high point (typically an all-time high) from a user-defined historical date. From that anchor, multiple levels are projected downward using fixed ratios. These levels are:
Automatically updated when new highs occur
Visualized using horizontal step-lines
Fully customizable in terms of count, color, and source
These levels serve as contextual guides and can assist with price projection, risk management, or discretionary confluence zones.
Directional Control
The model supports both Long & Short and Long Only signal modes. In Long Only mode, exit signals are routed to neutral (Cash) instead of Short. This allows users to align the indicator with personal strategy, risk appetite, or portfolio rules. Neutral signals are also plotted with distinct labels and coloring to indicate a directional reset.
Input Summary
All components of the script are user-configurable through the following inputs:
Start date selector to restrict signal generation
Source selection for core price input
Custom lengths and responsiveness settings
Smoothing structure with optional stacking
Expansion control for range width
Signal persistence threshold
Signal type selector (long-only or long & short)
Regime selector between four logic systems
Filters: strength-based and trend-based
Verdict table display settings (position and size)
Static levels: anchor date, count, source, and visual customization
Originality
What sets the Uptrick: ATR Model apart is its integration of multiple directional systems into a single, configurable interface. Each regime is distinct and interprets market behavior from a unique perspective, while the Final Verdict mode offers a consolidated view that few tools provide in a fully visual and non-redundant format. The Lightning Trend scoring engine and modular structural design offer a level of control and flexibility uncommon in single-layer indicators. The combination of signal gating, decision tables, and state tracking creates a cohesive, structured environment for directional evaluation.
Summary
The Uptrick: ATR Model is a complete directional and volatility analysis system designed for customizable trend evaluation, signal clarity, and strategic filtering. It adapts to different trader needs through its configurable regimes, state-aware signals, dynamic overlays, and visual decision tools. It is suitable for discretionary traders seeking structured guidance, as well as systematic users who require configurable state management and signal control.
Disclaimer
This tool is provided for informational and research purposes only. It does not constitute investment advice or a recommendation to buy or sell any financial instrument. All trading involves risk, and past performance does not guarantee future results. Users are solely responsible for their own decisions.

HawkEye EMA Cloud
# HawkEye EMA Cloud - Enhanced Multi-Timeframe EMA Analysis
## Overview
The HawkEye EMA Cloud is an advanced technical analysis indicator that visualizes multiple Exponential Moving Average (EMA) relationships through dynamic color-coded cloud formations. This enhanced version builds upon the original Ripster EMA Clouds concept with full customization capabilities.
## Credits
**Original Author:** Ripster47 (Ripster EMA Clouds)
**Enhanced Version:** HawkEye EMA Cloud with advanced customization features
## Key Features
### 🎨 **Full Color Customization**
- Individual bullish and bearish colors for each of the 5 EMA clouds
- Customizable rising and falling colors for EMA lines
- Adjustable opacity levels (0-100%) for each cloud independently
### 📊 **Multi-Layer EMA Analysis**
- **5 Configurable EMA Cloud Pairs:**
- Cloud 1: 8/9 EMAs (default)
- Cloud 2: 5/12 EMAs (default)
- Cloud 3: 34/50 EMAs (default)
- Cloud 4: 72/89 EMAs (default)
- Cloud 5: 180/200 EMAs (default)
### ⚙️ **Advanced Customization Options**
- Toggle individual clouds on/off
- Adjustable EMA periods for all timeframes
- Optional EMA line display with color coding
- Leading period offset for cloud projection
- Choice between EMA and SMA calculations
- Configurable source data (HL2, Close, Open, etc.)
## How It Works
### Cloud Formation
Each cloud is formed by the area between two EMAs of different periods. The cloud color dynamically changes based on:
- **Bullish (Green/Custom):** When the shorter EMA is above the longer EMA
- **Bearish (Red/Custom):** When the shorter EMA is below the longer EMA
### Multiple Timeframe Analysis
The indicator provides a comprehensive view of trend strength across multiple timeframes:
- **Short-term:** Clouds 1-2 (faster EMAs)
- **Medium-term:** Cloud 3 (intermediate EMAs)
- **Long-term:** Clouds 4-5 (slower EMAs)
## Trading Applications
### Trend Identification
- **Strong Uptrend:** Multiple clouds stacked bullishly with price above
- **Strong Downtrend:** Multiple clouds stacked bearishly with price below
- **Consolidation:** Mixed cloud colors indicating sideways movement
### Entry Signals
- **Bullish Entry:** Price breaking above bearish clouds turning bullish
- **Bearish Entry:** Price breaking below bullish clouds turning bearish
- **Confluence:** Multiple cloud confirmations strengthen signal reliability
### Support/Resistance Levels
- Cloud boundaries often act as dynamic support and resistance
- Thicker clouds (higher opacity) may provide stronger S/R levels
- Multiple cloud intersections create significant price levels
## Customization Guide
### Color Schemes
Create your own visual style by customizing:
1. **Bullish/Bearish colors** for each cloud pair
2. **Rising/Falling colors** for EMA lines
3. **Opacity levels** to layer clouds effectively
### Recommended Settings
- **Day Trading:** Focus on Clouds 1-2 with higher opacity
- **Swing Trading:** Use Clouds 1-3 with moderate opacity
- **Position Trading:** Emphasize Clouds 3-5 with lower opacity
## Technical Specifications
- **Version:** Pine Script v6
- **Type:** Overlay indicator
- **Calculations:** Real-time EMA computations
- **Performance:** Optimized for all timeframes
- **Alerts:** Configurable long/short alerts available
## Risk Disclaimer
This indicator is for educational and informational purposes only. Always combine with proper risk management and additional analysis before making trading decisions. Past performance does not guarantee future results.
---
*Enhanced and customized version of the original Ripster EMA Clouds by Ripster47. This modification adds comprehensive color customization and enhanced user control while preserving the core analytical framework.*

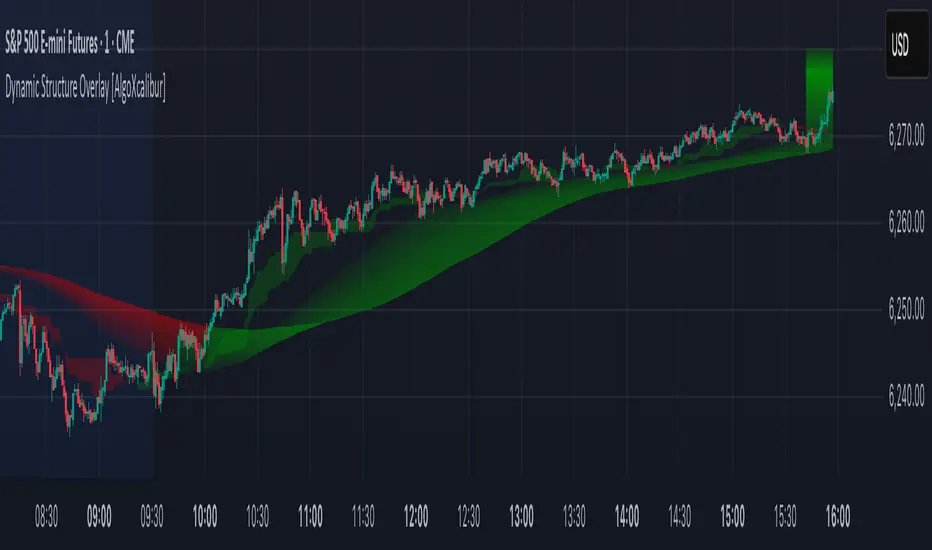
Dynamic Structure Overlay [AlgoXcalibur]Dynamic Structure Overlay combines an ultra-dynamic Ribbon, adaptive supply/demand Zones, and a versatile momentum-based Cloud to paint a stunning picture of market structure. Whether you're riding strong trends or patiently analyzing consolidation, this tool helps visualize factors that influence trend direction and price movement.
📊 Indicator Components and Functions
This indicator integrates three core elements to provide an intuitive analysis of trend and market structure. Each component can be independently enabled or disabled to suit your preferences.
• Dynamic Ribbon
At the center of attention is the Dynamic Ribbon, which uses multi-layered moving averages rendered as a flowing ribbon with adaptive color gradients. It reacts to price action in real time, revealing trend direction, strength, and periods of expansion or compression.
• Dynamic Zones
These volume-weighted supply and demand zones are derived from price-to-volume deviations relative to VWAP. These zones often guide price action during strong trends.
• Dynamic Cloud
A unique momentum-based structure derived from dynamic price ranges by averaging the highs and lows from recent price action. The Cloud captures momentum strength and directional pressure, providing a visual guide to trend continuations and transitions.
Together, these components form a comprehensive overlay that adapts in real time to changing market conditions.
🚀 Ride the Trend
Dynamic Structure Overlay is a multi-dimensional tool — its framework helps visualize dynamic factors that often influence price action, assisting traders in staying aligned with the evolving trend.
Expanded Cloud [LuxAlgo]The Expanded Cloud tool allows traders to identify and follow trends accurately. It is based on the well-known Donchian Channels, but with enhanced features.
It features a trailing cloud that expands with the price and a trading stats dashboard.
🔶 USAGE
The tool is super easy to use. Traders can identify bigger or smaller trends just by adjusting the length from the settings panel.
Trend identification is based on Donchian Channels. An uptrend is indicated when the cloud is located below the price, while a downtrend is indicated when the cloud is above it.
Dots signal the start of a new trend, and the width of the clouds identifies the strength of the price expansion. The wider the cloud, the bigger the move.
The expanded cloud, due to its visual, can also act as a trailing stop.
🔹 Trend Identification
As we can see in the chart above, different length values identify different trends on the same BTC daily chart. Larger values identify larger trends.
🔹 Cloud Expansion
From the settings panel, traders can adjust how the clouds expand based on the Expansion % parameter. It accepts values from 0 to 100, which controls how much of the expansion is taken into account. Higher values will make the cloud expand and get closer to the price faster.
When the cloud moves opposite to the direction of the indicated trend (e.g: the cloud decreases while being below the price), it is often indicative of the end of a retracement, and we can expect the price to move with the indicated trend.
The chart above shows the effect of different Expansion % values.
🔹 Dashboard
The trading statistics dashboard informs traders of key metrics derived from the tool. The following are notable:
PNL: Theoretical profit or loss from all trends identified by the tool in the right scale units.
EXPECT.: Expected value of each trade. It is derived from win rate and risk-to-reward metrics.
AVG: 1st TOUCH: The average number of bars from the beginning of a new trend until the price touches the cloud for the first time.
🔶 SETTINGS
Length: Length for trend detection
Expansion %: Percentage of price expansion for cloud formation
Source: Source of the data
🔹 Dashboard
Show Dashboard: Enable/disable the statistics dashboard
Location: Dashboard location
Size: Dashboard size

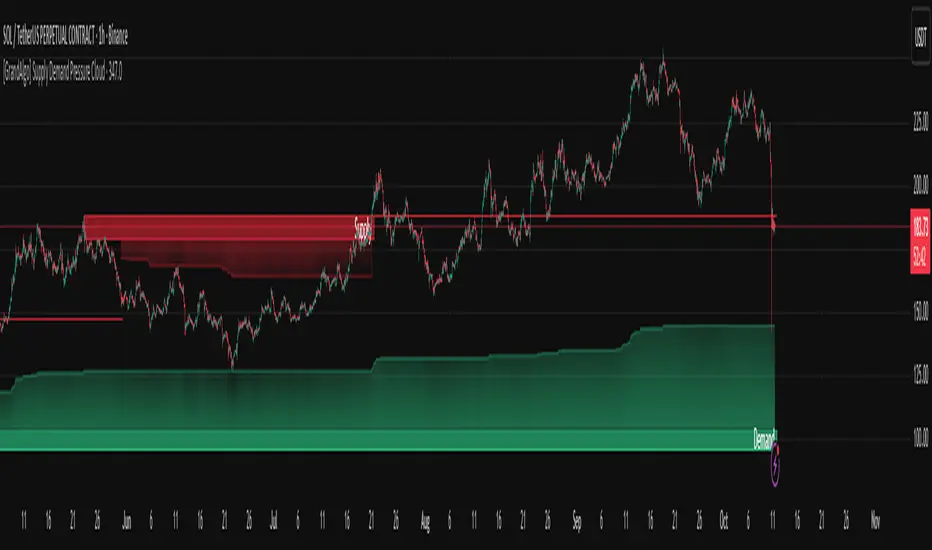
[GrandAlgo] Supply Demand Pressure CloudThe Supply Demand Pressure Cloud takes traditional supply and demand analysis to the next level by incorporating a dynamic pressure cloud. This cloud visually represents the intensity of market activity within supply and demand zones, offering traders an edge in identifying key levels of buying and selling pressure. Unlike conventional supply and demand indicators, the Pressure Cloud provides enhanced insights into market dynamics by focusing on the buildup of pressure within these zones.
In addition to pressure analysis, the indicator allows customization of zone strength—Major, Intermediate, or Minor—enabling users to adapt the tool to their trading strategy and preferred levels of significance.
Key Features:
Unique Pressure Cloud Visualization:
Red Supply Clouds: Indicate areas with significant selling pressure, often acting as resistance.
Green Demand Clouds: Indicate areas with significant buying pressure, often acting as support.
The cloud shading dynamically represents the buildup of market pressure, providing a visual edge that simple supply/demand indicators lack.
Customizable Pressure Levels:
Choose between Mild, Moderate, or Strong pressure levels to highlight zones with varying levels of market intensity.
Adjustable Zone Strength:
Select between Major, Intermediate, and Minor zones to focus on the levels most relevant to your trading style.
Real-Time Adaptability:
Automatically adjusts to reflect the most current market conditions, ensuring the zones are always relevant.
Clear and Intuitive Visuals:
Gradual color shading for the Pressure Cloud enhances clarity and usability, making it easy to spot key levels at a glance.
Comprehensive Market Coverage:
Works seamlessly across multiple markets, including Forex, crypto, stocks, and commodities.
Why Choose Supply Demand Pressure Cloud?
While traditional supply and demand indicators only highlight zones, the Pressure Cloud adds another layer of actionable insight by visually representing the intensity of pressure within these areas. This feature allows traders to:
Anticipate potential reversals with greater accuracy.
Prioritize zones with higher market activity.
Stay ahead of significant price movements.
The Pressure Cloud sets this indicator apart, making it an essential tool for traders who want a deeper understanding of market dynamics.
How It Works:
The Supply Demand Pressure Cloud identifies supply and demand zones by analyzing historical price data. It then overlays a Pressure Cloud within these zones, representing the intensity of pressure. Users can further refine the analysis by:
Selecting Pressure Levels:
🔹 Mild: Highlights pressure clouds with lower intensity.
🔹 Moderate: Displays pressure clouds with medium intensity.
🔹 Strong: Focuses on pressure clouds with the highest intensity for precise trading insights.decisions.
Adjusting Zone Strength:
🔹 Major: High-impact zones that attract significant market attention.
🔹 Intermediate: Medium-significance levels for additional context.
🔹 Minor: Lesser impact zones for detailed analysis.
The image showcases the Supply Demand Pressure Cloud in action, dynamically highlighting key supply and demand zones on the chart. These zones, combined with the pressure clouds, provide a clear visualization of potential areas of market interest:
Supply Zone (Red): Represents areas of concentrated selling pressure. The overlayed Supply Cloud (red gradient) highlights the buildup of supply pressure within the zone, offering insights into potential resistance areas.
Demand Zone (Green): Represents areas of concentrated buying pressure. The overlayed Demand Cloud (green gradient) highlights the buildup of demand pressure, indicating potential support zones.
This powerful combination of zones and pressure clouds equips traders with actionable insights to identify market turning points, reversals, and areas of consolidation. Let the Supply Demand Pressure Cloud be your guide to navigating market dynamics.
Disclaimer:
This indicator is a technical analysis tool designed to assist traders by providing insights into market conditions. It does not guarantee future price movements or trading outcomes and should not be relied upon as a sole decision-making tool. The effectiveness of this indicator depends on its application, which requires your trading knowledge, experience, and judgment.
Trading involves significant financial risk, including the potential loss of capital. Past performance of any tool or indicator does not guarantee future results. This script is intended for educational and informational purposes only and does not constitute financial or investment advice. Users are strongly encouraged to perform their own analysis and consult with a qualified financial professional before making trading decisions.
N Bar Reversal Detector [LuxAlgo]The N Bar Reversal Detector is designed to detect and highlight N-bar reversal patterns in user charts, where N represents the length of the candle sequence used to detect the patterns. The script incorporates various trend indicators to filter out detected signals and offers a range of customizable settings to fit different trading strategies.
🔶 USAGE
The N-bar reversal pattern extends the popular 3-bar reversal pattern. While the 3-bar reversal pattern involves identifying a sequence of three bars signaling a potential trend reversal, the N-bar reversal pattern builds on this concept by incorporating additional bars based on user settings. This provides a more comprehensive indication of potential trend reversals. The script automates the identification of these patterns and generates clear, visually distinct signals to highlight potential trend changes.
When a reversal chart pattern is confirmed and aligns with the price action, the pattern's boundaries are extended to create levels. The upper boundary serves as resistance, while the lower boundary acts as support.
The script allows users to filter patterns based on the trend direction identified by various trend indicators. Users can choose to view patterns that align with the detected trend or those that are contrary to it.
🔶 DETAILS
🔹 The N-bar Reversal Pattern
The N-bar reversal pattern is a technical analysis tool designed to signal potential trend reversals in the market. It consists of N consecutive bars, with the first N-1 bars used to identify the prevailing trend and the Nth bar confirming the reversal. Here’s a detailed look at the pattern:
Bullish Reversal : In a bullish reversal setup, the first bar is the highest among the first N-1 bars, indicating a prevailing downtrend. Most of the remaining bars in this sequence should be bearish (closing lower than where they opened), reinforcing the existing downward momentum. The Nth (most recent) bar confirms a bullish reversal if its high price is higher than the high of the first bar in the sequence (standard pattern). For a stronger signal, the closing price of the Nth bar should also be higher than the high of the first bar.
Bearish Reversal : In a bearish reversal setup, the first bar is the lowest among the first N-1 bars, indicating a prevailing uptrend. Most of the remaining bars in this sequence should be bullish (closing higher than where they opened), reinforcing the existing upward momentum. The Nth bar confirms a bearish reversal if its low price is lower than the low of the first bar in the sequence (standard pattern). For a stronger signal, the closing price of the Nth bar should also be lower than the low of the first bar.
🔹 Min Percentage of Required Candles
This parameter specifies the minimum percentage of candles that must be bullish (for a bearish reversal) or bearish (for a bullish reversal) among the first N-1 candles in a pattern. For higher values of N, it becomes more challenging for all of the first N-1 candles to be consistently bullish or bearish. By setting a percentage value, P, users can adjust the requirement so that only a minimum of P percent of the first N-1 candles need to meet the bullish or bearish condition. This allows for greater flexibility in pattern recognition, accommodating variations in market conditions.
🔶 SETTINGS
Pattern Type: Users can choose the type of the N-bar reversal patterns to detect: Normal, Enhanced, or All. "Normal" detects patterns that do not necessarily surpass the high/low of the first bar. "Enhanced" detects patterns where the last bar surpasses the high/low of the first bar. "All" detects both Normal and Enhanced patterns.
Reversal Pattern Sequence Length: Specifies the number of candles (N) in the sequence used to identify a reversal pattern.
Min Percentage of Required Candles: Sets the minimum percentage of the first N-1 candles that must be bullish (for a bearish reversal) or bearish (for a bullish reversal) to qualify as a valid reversal pattern.
Derived Support and Resistance: Toggles the visibility of the support and resistance levels/zones.
🔹 Trend Filtering
Filtering: Allows users to filter patterns based on the trend indicators: Moving Average Cloud, Supertrend, and Donchian Channels. The "Aligned" option only detects patterns that align with the trend and conversely, the "Opposite" option detects patterns that go against the trend.
🔹 Trend Indicator Settings
Moving Average Cloud: Allows traders to choose the type of moving averages (SMA, EMA, HMA, etc.) and set the lengths for fast and slow moving averages.
Supertrend: Options to set the ATR length and factor for Supertrend.
Donchian Channels: Option to set the length for the channel calculation.
🔶 RELATED SCRIPTS
Reversal-Candlestick-Structure.
Reversal-Signals.

Moving averages & clouds
Hi all!
This is a script that lets you have 3 moving averages (of a user defined type) and maybe have an alternative cloud (fill) between them. The cloud can be customized and turned on/off in the "style" tab for the indicator.
Alerts can be configured to fire on up/down/all crosses and are activated when the whole candle has crossed the morning average.
A higher time frame can be configured for the moving averages.
You can hide the moving average, but show the cloud:
You can have multiple clouds:
You can have moving averages from a higher time frame (here from weekly time frame on a daily chart):
Best of trading luck!

Supertrend x4 w/ Cloud FillSuperTrend is one of the most common ATR based trailing stop indicators.
The average true range (ATR) plays an important role in 'Supertrend' as the indicator uses ATR to calculate its value. The ATR indicator signals the degree of price volatility. In this version you can change the ATR calculation method from the settings. Default method is RMA, when the alternative method is SMA.
The indicator is easy to use and gives an accurate reading about an ongoing trend. It is constructed with two parameters, namely period and multiplier.
The implementation of 4 supertrends and cloud fills allows for a better overall picture of the higher and lower timeframe trend one is trading a particular security in.
The default values used while constructing a supertrend indicator is 10 for average true range or trading period.
The key aspect what differentiates this indicator is the Multiplier. The multiplier is based on how much bigger of a range you want to capture. In our case by default, it starts with 2.636 and 3.336 for Set 1 & Set 2 respectively giving a narrow band range or Short Term (ST) timeframe visual. On the other hand, the multipliers for Set 3 & Set 4 goes up to 9.736 and 8.536 for the multiplier respectively giving a large band range or Long Term (LT) timeframe visual.
A ‘Supertrend’ indicator can be used on equities, futures or forex, or even crypto markets and also on minutes, hourly, daily, and weekly charts as well, but generally, it fails in a sideways-moving market. That's why with this implementation it enables one to stay out of the market if they choose to do so when the market is ranging.
This Supertrend indicator is modelled around trends and areas of interest versus buy and sell signals. Therefore, to better understand this indicator, one must calibrate it to one's need first, which means day trader (shorter timeframe) vs swing trader (longer time frame), and then understand how it can be utilized to improve your entries, exits, risk and position sizing.
Example:
In this chart shown above using SPX500:OANDA, 15R Time Frame, we can see that there is at any give time 1 to 4 clouds/bands of Supertrends. These four are called Set 1, Set 2, Set 3 and Set 4 in the indicator. Set's 1 & 2 are considered short term, whereas Set's 3 & 4 are considered long term. The term short and long are subjective based on one's trading style. For instance, if a person is a 1min chart trader, which would be short term, to get an idea of the trend you would have to look at a longer time frame like a 5min for instance. Similarly, in this cases the timeframes = Multiplier value that you set.
Optional Ideas:
+ Apply some basic EMA/SMA indicator script of your choice for easier understanding of the trend or to allow smooth transition to using this indicator.
+ Split the chart into two vertical layouts and applying this same script coupled with xdecow's 2 WWV candle painting script on both the layouts. Now you can use the left side of the chart to show all bearish move candles only (make the bullish candles transparent) and do the opposite for the right side of the chart. This way you enhance focus to just stick to one side at a given time.
Credits:
This indicator is a derivative of the fine work done originally by KivancOzbilgic
Here is the source to his original indicator: ).
Disclaimer:
This indicator and tip is for educational and entertainment purposes only. This not does constitute to financial advice of any sort.

Super Cloud Support and Resistance Signal [5ema]This indicator can supply the trending and signal.
-----
How to calculate?
The cloud be create by the min/max of the EMA lines:
+ (avg(EMA(source, 20), EMA(source, 50), EMA(source, 200), EMA(source, 460), EMA(source, 610))
+ with source = high / low / open and close.
The signal bar is a reversal candle pattern such as engulfing, hammer, ....
For avoid to against the trend, use the number left bars are completely above or below the cloud.
-----
How to set up?
Input the number left bars to get the number left bars are completely above or below the cloud. Its purpose is avoid to get signal against the trend. Can set it bigger than 2.
Can filter the signal only buy or only sell to follow the current trend.
-----
How to use?
Refer the trend cloud:
Can refer the signal:
Make an alert when signal appear.
-----
This indicator is for reference only, you need your own method and strategy.
If you have any questions, please let me know in the comments.

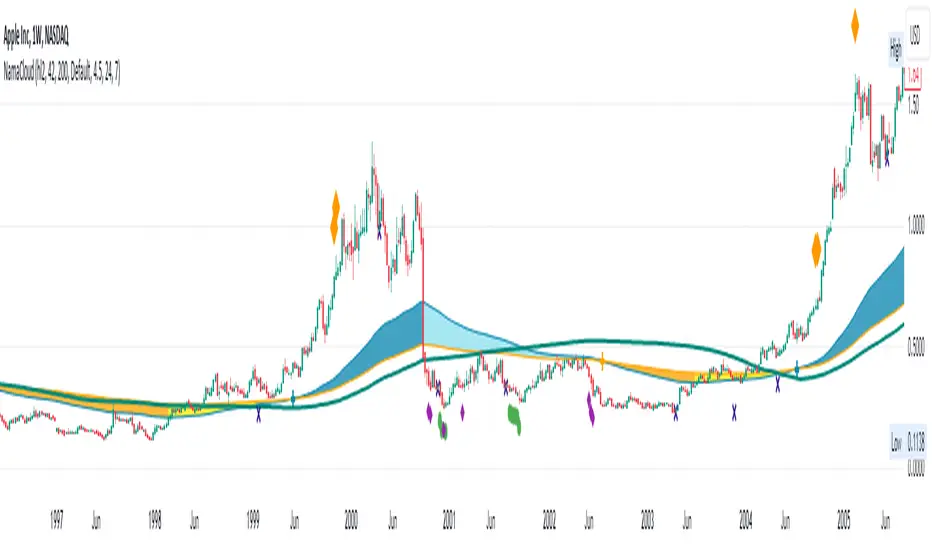
NAMA Cloud - Quan DaoApplication of Non-Adaptive Moving Average (NAMA) by using a fast and slow MAs to draw a trending cloud.
Using this indicator, one might have an overview look on the trend of the security now.
- These 2 MAs are NOT dependant on the starting length (thus user does not have to choose the length of the MAs anymore).
- When the fast MA is above the slow MA, most likely the trend is up (blue color).
- When the fast MA is below the slow MA, most likely it's an down trend (orange color).
- When the two MAs cross, most likely there will be a trend change (small or big) soon.
You can also show/hide a bands (ATR, Bollingers, ...) in this indicator as well.
Cloud Levels [Import Price Levels]This script allows you to import TA and price levels from an external source. For example, you may do some TA on a different software but want to import it to TradingView. Or you may have a script or bot that calculates levels for you end-of-day. Or you may be part of a community that provides TA and levels. There are many different reasons why you may want to import levels from an external source.
All you need is a source for the data. The data format shouldn't really matter since it can usually be converted fairly easily to a custom format. Information about the necessary format can be found below.
The script currently supports:
Labelled lines with customs style and colors
Boxes / zones with custom fill color and borders
Fibonacci ratios
In the plans:
Channel support
Trend lines
The input format looks like this:
FIGURE 1 - Lines with labels
Columns: ,,,,;
Example: 1677724019999,3976.50,Label text,255/255/0/125,sol
FIGURE 2 - Boxes
Columns: ,,,,,,,;
Example: 1686715971428,4430.18,1686773561538,4409.52,68/98/194/15,1,1,153/204/255/204
FIGURE 3 - Fibonacci ratios
Columns: ,,,,,,,,
Example: 1656649151300,4588.75,1656649151300,3639,dot,1,3,0.236|0.382|0.5|0.618|0.706|0.786|0.886,170/200/255/76|170/200/255/76|170/200/255/76|0/255/0/76|255/153/0/76|255/153/0/76|255/153/0/76
*ratios and ratio colors are separated by '|'
*RGBA colors must look like this: 255/255/0/125, each value separated by '/'
*Line style s must be one of these values: dsh, sol or dot (dashed, solid or dotted)
Separate each item within the same figure with a semicolon (;), e.g for two labelled lines: 1677724019999,3976.50,Label text,255/255/0/125,sol;1677724019999,4026,Label text 2,255/255/0/125,sol
Only put a semicolon at the end if there is a new item after it.
Finally, put all figures together with '§' separator between each figure/category, in the correct order:
1 - Lines with labels
2 - Boxes
3 - Fibonacci ratios
The result looks like this for the examples above:
1677724019999,3976.50,Label text,255/255/0/125,sol§1686715971428,4430.18,1686773561538,4409.52,68/98/194/15,1,1,153/204/255/204§1656649151300,4588.75,1656649151300,3639,dot,1,3,0.236|0.382|0.5|0.618|0.706|0.786|0.886,170/200/255/76|170/200/255/76|170/200/255/76|0/255/0/76|255/153/0/76|255/153/0/76|255/153/0/76
An incorrect format will give you errors.
With basic programming skills you can create a simple tool to convert your data to this format, that's what I do. If needed, I may be able to provide a customized converting tool for this, PM if interested.
