Angular Resistance & Breakout/BreakdownAngular Resistance & Breakout/Breakdown (Dynamic Trendlines)
This indicator provides a dynamic approach to identifying major support and resistance levels by fitting Linear Regression lines to recent pivot points (swing highs and swing lows). Unlike static horizontal lines, these "Angular" trendlines adapt to the market's slope, providing continuously adjusting targets for resistance and support, along with signals for confirmed breakouts and breakdowns.
💡 Key Features
Dynamic Trendlines: Utilizes Linear Regression to automatically draw sloped trendlines based on a configurable number of the most recent swing pivots.
Confirmed Signals: Generates clear Breakout (▲) and Breakdown (▼) signals with optional buffer and sensitivity filters to reduce noise.
Customizable Inputs: Fine-tune the pivot detection period, the number of points used for regression, line extension, and signal sensitivity.
On-Chart Info Panel: A table displays real-time data, including the number of detected pivot points and the current calculated price level of the dynamic lines.
⚙️ How It Works (The Logic)
Pivot Detection: The script uses the standard ta.pivothigh() and ta.pivotlow() functions to reliably identify swing points, based on the Pivot Left and Pivot Right settings. These points are stored in dynamic arrays (highs for resistance, lows for support).
Angular Line Generation: A custom function, f_regression_from_array, performs a Linear Regression analysis using the bar index (X-axis) and the pivot price (Y-axis) for the Points to use. This calculation determines the optimal slope and intercept to draw a best-fit dynamic line through the identified pivot points.
Breakout/Breakdown Confirmation:
Breakout: Triggered when the current close price crosses above the dynamic resistance line plus the user-defined Breakout buffer.
Breakdown: Triggered when the current close price crosses below the dynamic support line minus the user-defined Breakout buffer.
Sensitivity Filter: An optional filter requires the price movement on the signal bar to exceed a minimum percentage (Label sensitivity) away from the line to confirm the momentum of the move.
Commodity

Average Daily Range [Blaz]Version 1.0 – Published October 2025: Initial release
1. Overview & Purpose
The Average Daily Range is an advanced volatility assessment tool designed to give traders a clear, real-time view of the market's expected daily movement. It calculates the average range between daily highs and lows over a user-defined historical period and projects this average onto the current trading session.
By visualising the potential high and low boundaries for the day, this indicator assists in setting realistic profit targets, managing risk effectively, and identifying when price action is becoming overextended relative to its recent volatility profile. It is an essential tool for day traders and swing traders across all markets, including Forex, Stocks, Crypto, Futures, and Commodities.
2. Core Functionality & Key Features
The indicator provides a dynamic, multi-faceted analysis of daily volatility:
Historical ADR Calculation: Automatically computes the Average Daily Range based on the specified number of previous trading days (configurable from 1 to 20).
Real-Time Range Tracking: Monitors and displays the current day's live price range as it develops.
Percentage Used Metric: Shows the percentage of the historical ADR that the current day's range has already consumed, providing an immediate gauge of remaining volatility potential.
Remaining Range Projection: Visually highlights the potential upward and downward movement remaining to meet the average range, displayed as semi-transparent areas on the chart.
Daily Open Reference: Plots customisable vertical separation lines and horizontal price lines at the daily open to clearly anchor the current session's price action.
3. Visual Components & Analytical Insights
A fully configured Average Daily Range setup displays several key analytical components that work together to provide a comprehensive volatility overview.
3.1. Information Table
A highly customizable data table provides a concise summary of all critical metrics at a glance:
Historical Ranges: Displays the individual daily ranges for the selected lookback period.
ADR Value: The calculated average range.
Today's Range: The live, developing range for the current session.
% Used: A colour-coded percentage (turning orange upon exceeding 100% and red upon exceeding 150%) showing how much of the average volatility has been consumed.
3.2. Visual Range Projections
Remaining Range Zones: When the current day's range is below the historical average, semi-transparent zones extend from the current day's extreme high and low, illustrating the additional movement required to reach the ADR. This provides an instant visual cue for potential target zones.
Daily Open Markers: Clean, customisable lines mark the start of each trading day (vertical line) and the daily open price (horizontal line), helping to contextualise intraday price moves.
4. Input Parameters and Settings
4.1. General Settings
Lookback: Set the number of days used to calculate the Average Daily Range (1-20).
Set Alert: Configure alerts to be notified when the current day's range consumes a significant portion (e.g., 100% or more) of the historical ADR.
4.2. Table Customization
Visibility & Style: Toggle the table and historical data on/off. Fully customise the header and body colours, text colours, border style, and font sizes.
Placement & Orientation: Precisely position the table anywhere on the chart (Top/Bottom/Centre, Left/Right) and choose between Horizontal or Vertical layout to best suit your chart layout.
4.3. Visual Style Controls
Remaining Range: Toggle the projection zones on/off and customise their colour and transparency.
Daily Open Markers: Independently control the visibility, colour, style, and width of the daily separation line and the open price line.
5. Protected Logic & Original Design
The Average Daily Range indicator incorporates proprietary logic for efficiently tracking intraday extremes, managing historical data arrays, and dynamically rendering visual elements. The closed-source nature of this tool protects the author's original code structure and optimisation techniques, particularly the real-time area fill projection logic for the remaining daily range and the dynamic table management system. This ensures the indicator remains performant and reliable while being freely accessible to the entire TradingView community.
6. Disclaimer & Terms of Use
This indicator, titled Average Daily Range , has been independently developed by the author. The code and its structural logic are original and were written entirely from scratch to reflect a unique and efficient approach to volatility analysis. The internal mechanics were written from scratch and are not based on any publicly available script or third-party code.
This tool is provided solely for educational and informational purposes. It is not intended as financial advice, investment guidance, or a specific recommendation to buy or sell any financial instrument. The indicator is designed to assist with technical analysis based on volatility but does not guarantee accuracy or profitability.
Trading financial markets involves significant risk, including the possibility of loss of capital. By using this indicator, you acknowledge and accept that you are solely responsible for any decisions you make and for all trading outcomes. No part of this script should be considered a signal or assurance of success in the market.

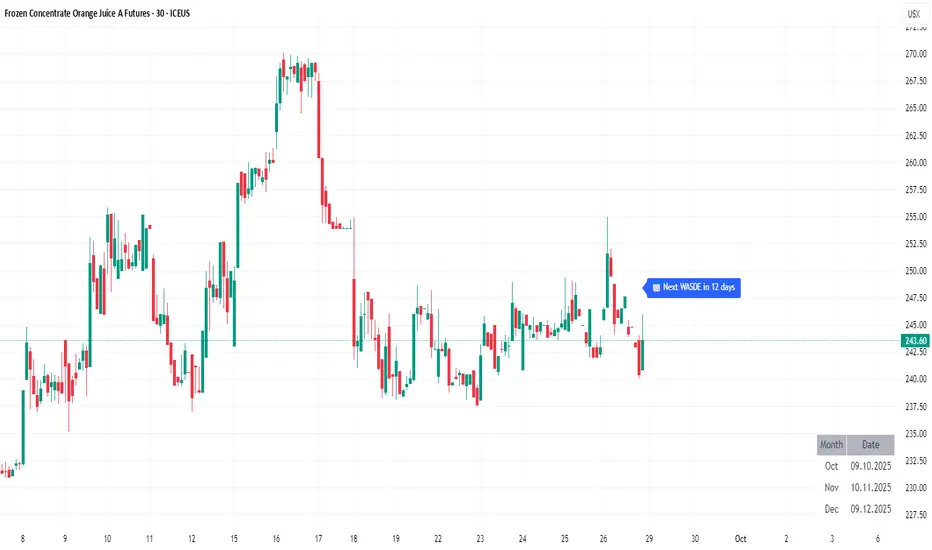
WASDE DatesOverview
WASDE Dates — a small, focused event indicator that displays confirmed USDA WASDE release dates for 2025 on the chart and marks each release day. The indicator is designed to be a lightweight timing tool for traders who want clean visual reminders and optional alerts around USDA WASDE publications.
Features
• Shows official WASDE release dates for 2025 in a compact chart table.
• Draws on-chart markers and a dotted vertical line on WASDE release days.
• Two alert conditions you can enable in TradingView: "WASDE Day Alert" and "WASDE 24h Reminder".
• Simple table position control (Top/Bottom, Left/Right) in the indicator settings.
• Minimal, self-contained code — no external data feeds or permissions required.
How to use
1. Apply the indicator to any chart and timeframe.
2. Use the indicator settings to choose table position.
3. Enable Alerts (if desired) via TradingView Alerts → choose “WASDE Day Alert” or “WASDE 24h Reminder”.
4. This version contains 2025 confirmed dates only — verify dates for live trading and enable alerts as needed.
Design & rationale
This indicator is intentionally not a technical trading signal. It is an event scheduler focused on clarity and low overhead: combine it with your existing setup to avoid being surprised by WASDE publications and to quickly inspect price action around these event dates.
Limitations & disclaimer
• This script shows **confirmed 2025** WASDE dates only. It does not provide trading advice or entry/exit signals. Use at your own risk.
• Double-check official USDA publishing times before executing trades.
• No external links or contact information are included in this description to comply with TradingView publishing rules.
Feature outlook (V2)
Planned V2 (future release): enhanced countdown (days → hours/minutes), optional inclusion of estimated 2026 dates marked as (TBC), and an invite-only/protected advanced version with reaction overlays (T+1/T+3) and extended alert options. V2 will be announced on this script page when ready.
Changelog
v1 — public release: 2025 confirmed dates, release markers, alerts, table position control.
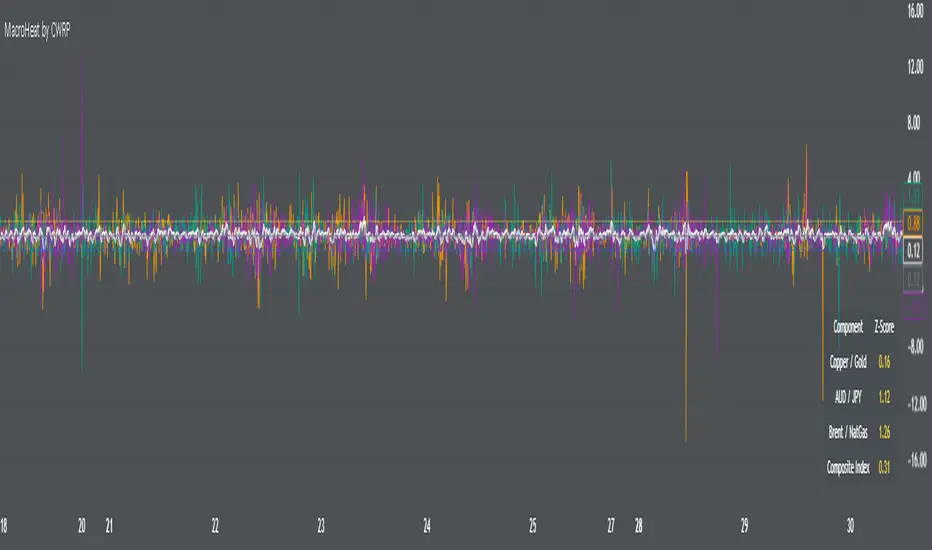
MacroHeat (Global Macro Growth Proxy)Overview:
MacroHeat by CWRP is a proprietary macroeconomic sentiment indicator that tracks the temperature of global industrial and risk-linked activity using market-based signals. It distills asset movements from metals, foreign exchange, and energy markets into a single, smoothed composite value. This tool is designed to help portfolio managers, traders, and strategists gauge the direction and momentum of real economy growth expectations.
MacroHeat does not predict policy or price action directly—it measures macro risk appetite and industrial growth expectations across three crucial asset pairs:
Copper/Gold Ratio – Industrial Metals vs. Defensive Metal
AUD/JPY Cross – Commodity-sensitive FX vs. Safe-haven FX
Brent/NatGas Ratio – Oil Demand vs. Gas Oversupply
These inputs are transformed into standardized z-scores to generate an intuitive composite signal of expansion, contraction, or neutrality in the global growth regime
Interpretation:
Copper / Gold Ratio
Copper is widely used in construction, manufacturing, and infrastructure. It responds to real-world industrial activity.
Gold is a traditional safe-haven asset, bid up in times of uncertainty or deflationary pressure. A rising Copper/Gold ratio implies higher industrial activity relative to defensive hedging, consistent with expansionary conditions.
AUD / JPY
AUD (Australian Dollar) is closely tied to the commodity cycle and heavily exposed to Chinese demand, especially for raw materials like iron ore and coal. JPY (Japanese Yen) is a low yielding, defensive currency that tends to strengthen during global stress due to Japan’s net external creditor position. A rising AUD/JPY indicates risk on sentiment and strength in Chinese or regional industrial demand. Falling values may signal risk aversion or cooling commodity linked activity.
📌 *Note: AUD is a proxy for China linked global demand. JPY reflects broader global risk sentiment, not the Japanese economy per se.
Brent / NatGas Ratio
Brent crude prices reflect global oil demand, typically linked to transportation, logistics, and industrial usage. Natural Gas, though also industrial, is often supply heavy and regionally priced. A high Brent/NatGas ratio can indicate tight oil supply or strong demand, relative to gas, suggesting higher economic activity.
------------------------------------------------------------------------------------------------------------
Each of the above components is converted into a Z-score using log returns over a 252-day rolling window. This standardizes movement and allows for cross-market comparison. The indicator then:
Averages the Z-scores of the three components (>1 is expansive, <-1 is contractive)
Smooths the result using a 5-day simple moving average
Classifies the result into macroeconomic regimes
And outputs to the table which has live component Z-scores with visual cues (yellow = expansionary; blue = contractionary).
Thank you for using the Global Macro Growth Proxy by CWRP!
I'm open to all critiques and discussion around macroeconomics and hope you find use in this model!
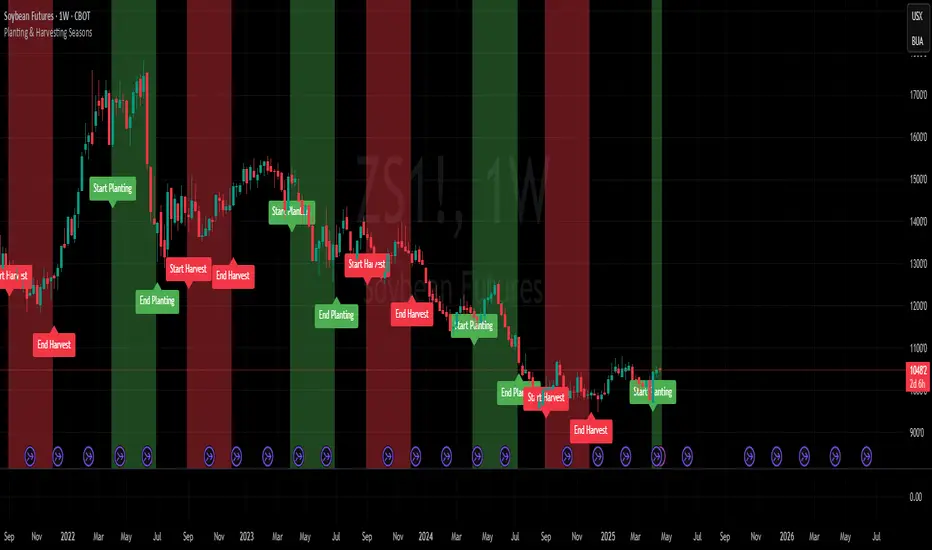
Planting & Harvesting SeasonsHello all,
as a commodity trader, I use a lot of seasonal patterns in my analysis. Some time ago, I came up with the idea to develop a simple script that visually overlays the typical planting and harvesting periods for key agricultural futures directly on the chart.
This script automatically detects the underlying commodity based on the symbol (e.g. ZC, ZW, ZS, CT) and displays color-coded zones for each seasonal window. These zones are based on historical crop calendars and help identify when planting or harvesting typically takes place. The goal is to better align technical setups with fundamental seasonal factors.
This is a basic version and meant as a visual aid — not a trading signal in itself.
Hope you enjoy it and any feedback is highly appreciated!
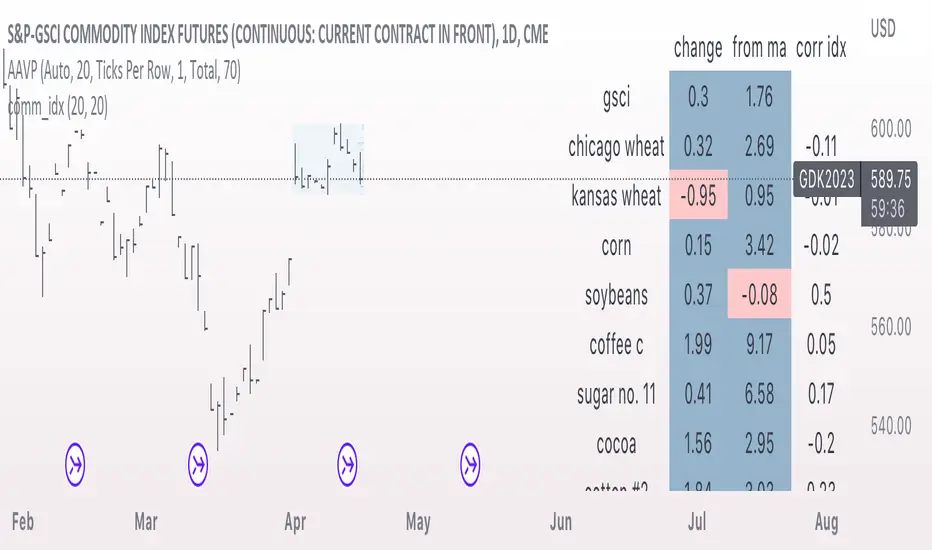
comm_idxThis script displays information about the components of the Goldman Sachs Commodity Index. The index is based on futures contracts in the categories of agricultural products, softs commodities, livestock, energies, industrial metals, and precious metals. The statistics displayed in the table are:
change: 1-day % change
from ma: the % change from a moving average
corr idx: correlation of the contract to the GSCI
The lengths for the moving average and correlation statistic can be set using the inputs.
See the script source for the symbols used for each commodity. Although most of the symbols correspond to the actual futures contract used to compute the index, LME contracts are not available on tradingview. Hence, corresponding HKEX contracts are used for the industrial metals.
Integrated Implied Volatility C/FThe integrated version of IV CAP/FLOOR Premium and Bitcoin IV C/F.
Illustrating Cap-Floor bands based on statistical calculations using the implied volatility of Bitcoin, foreign currency pairs, commodities, bonds, and indexes.

Alex's Dikfat Velocity 2hr CCI Color SignalerAlex's Dikfat Velocity 2hr CCI Color Signaler
As most traders have experienced at one time or another, over bought and oversold readings are relative in nature and do not always work as a standalone reading.
Momentum indicators such as the Commodity Channel Index ( CCI ) have to be understood and read correctly to determine the value in a momentum reading.
When an asset is "Overbought" or "Oversold" the reading can remain in this region Irrationally for extended periods as the market remains in irrational trend.
In order to better understand this and other readings on a momentum indicator clues such as divergence, exhaustion, continuation, time and frequency as well as the actual velocity of the movement must be measured. In addition, there are very specific measurement lines on the CCI that must be read and that can reject or break and result in the asset either loosing or gaining momentum in one direction or the other. These are the dashed lines in the background.
For the purposes of this Indicator, the actual function, characterization and use of CCI will not be explained here as the colored indications themselves will do all the work for you.
It is very important to know that the calculations used to signal the color filling ARE NOT based on simple breaks of the dashed background lines as traditionally read with a CCI indicator.
The calculations used in this Indicator are based on a very fine tuned mathematical algorithm that measure an unseen element within the CCI . When the VELOCITY of a move in momentum is met, the color fills will begin. When the VELOCITY of the move changes, so to will colorization. This has led to some of the best High Probability Long and Short Sale signaling in any CCI indicator. Pairing this with your favorite chart indicators and personal analysis will result in high tradability but can also be used stand alone.
Remember: No one single indicator should ever be used to determine market signaling.
A basic understanding of a CCI indicator is recommended before using this indicator.
This indicator and the proprietary calculations used were built and meant to be used on the 2 Hour Timeframe. The indicator is open to all time frames and accuracy increases as the time frame increases.
It is recommended that if you use this indicator on a lower timeframe, to pull CCI readings from a higher Timeframe as found in the settings.
This indicator signals long and short opportunities. High Probability long and short trades, bullish and bearish divergence building, market time traps and bullish / bearish continuation as well as exhaustion of these moves.
There is also a companion indicator which will signal the High Probability Long and Short trades on the candle chart called "Alex's Dikfat CCI Equity Signaler" Which will place white Triangles on the candle chart showing high probability long entries and Orange Triangles for High Probability short entries. These are also built into the CCI line and can be turned on in this indicator.
Color Code:
Bullish Continuation: (Background Color Black)
The function of the black background colorization is to alert the user that a bullish move has begun and is currently in a strong continuation period. the longer the black background color draws, the more sustained or trending up the current move is. When these background lines begin to break and start to appear as more frequent broken background lines, exhaustion in the move can be assumed. When the black stops drawing all together, the strength of the continuation move is gone.
Bearish Continuation: (Background Color Fuchsia)
The function of the fuchsia background colorization is to alert the user that a bearish move has begun and is currently in a strong continuation period. the longer the fuchsia background color draws, the more sustained or trending down the current move is. When these background lines begin to break and start to appear as more frequent broken background lines, exhaustion in the move can be assumed. When the fuchsia stops drawing all together, the strength of the continuation move is gone.
High Probability Long/Short:
These buy and sell opportunities were designed to give a trader the best signal/entry on a Long or a Short with the highest probability of making a large and typically sustained impulse move.
High Probability Long: (White Color Fill)
The High Probability Long is a signal to BUY with the best possible entry on an a pending large impulse move to the upside. When White begins to fill, The long is extremely likely. The signal is confirmed on the close of the following candle after white begins to draw unless an opposing color immediately follows, or white dips below the zero line. White will always usually start just below the zero line in the highest probability scenarios.
High Probability Short: (Orange Color Fill)
The High Probability Short is a signal to SELL SHORT with the best possible entry on a pending large impulse move to the downside. When Orange begins to fill, The Short is extremely likely. The signal is confirmed on the close of the following candle after orange begins to draw unless an opposing color immediately follows. Some of the best entries for Orange are when it starts at the END of a black stripe in the background and better so when Orange dips below zero for entry. The signal was designed to color early enough to get in a short during consolidation before the move.
Long and Short Opportunities: Long and Short opportunities are just as they sound. Coloring will signal green for a long opportunity and red for a short opportunity. These opportunities are not always guaranteed and usually result in an lesser impulse move in one direction with a shorter duration.
Long Opportunity: (Green)
The Long Opportunity is a signal that a Long is possible however with less likely odds of a larger more sustained move. When Green begins to fill, a long opportunity is available. The signal is confirmed on the close of the following candle after green begins to draw unless an opposing color immediately follows, or green dips below the zero line. Green will always usually start just above the zero line and have the best opportunities at the end of Bullish Divergence (Blue) at the end of Bearish Continuation (Fuchsia) or a non filled CCI .
Short Opportunity: (Red)
The Short Opportunity is a signal that a Short is possible however with less likely odds of a larger more sustained move. When Red begins to fill, a short opportunity is available. The signal is confirmed on the close of the following candle after red begins to draw unless an opposing color immediately follows. Some of the best entries for Red are when it starts at the END of a black stripe in the background (higher odds than other red signaling). The signal was designed to color early enough to get in a short during consolidation before the move and better so if orange develops after red.
Bullish Divergence: (Dark Blue)
Dark Blue colors when Bullish Divergence is detected. Bullish divergence is a signal that momentum is building higher within the asset for an up move while price action in the candle chart makes lower lows. Bullish Divergence is not a signal to buy or sell but rather a sign post to say WAIT. Bullish divergence is building and a Long is coming. Some traders will buy bullish divergence in anticipation of a move and is only equitable if you have the cash and resolve to follow it through for as long as it is developing. Buying or selling divergence right away is not always the best practice unless a hard dip below all momentum lines followed by an immediate buy signal from white or green resulting in a drop base rally.
Bearish Divergence: (Dark Maroon)
Dark Maroon colors when Bearish Divergence is detected. Bearish divergence is a signal that momentum is dropping out of the asset for a move lower while price action in the candle chart makes higher highs. Bearish Divergence is not a signal to buy or sell but rather a sign post to say WAIT. Bearish divergence is building and a Short is coming. Some traders will sell bearish divergence in anticipation of a move and is only equitable if you have the cash and resolve to follow it through for as long as it is developing. Buying or selling divergence right away is not always the best practice unless a hard rip above all momentum lines followed by an immediate sell signal from red or orange resulting in a rally base drop.
No Color Fill:
When CCI has no color fill whatsoever it is telling the trader there are no high velocity movements in momentum in any direction. Best practice is to do nothing and wait out the Time Trap currently on the chart until signaling develops.
Time and Frequency:
Time and frequency is notable throughout the indicator. First and foremost when CCI is not being filled it is best practice to do nothing as there is NO Velocity of Movement within the asset at that time. This is one of the most obvious of Time Traps.
Bullish and Bearish Divergence is also a type of Time Trap. The longer these develop, the more weak hands are shaken out of the market and derivatives traders have their premium burned. Best practice with divergences is also to wait until adequate signaling develops, or be willing to buy or sell the appropriate divergence by accumulating or distributing for as long as it develops; or simply to buy/sell and hold for the move.
Any Sustained color for extended periods of time is also a time trap signaling to the trader that the asset is being irrational in its present move.
Bullish and Bearish Continuation:
These also deal with time and frequency most importantly. When we are on a sustained Bull Run, black will color in the background continuously. When the black starts to barcode or break up, exhaustion of the bull run is assumed as the frequency of the run becomes erratic. Inversely, When we are on a sustained Bear Run, fuchsia will color in the background continuously. When the fuchsia starts to barcode or break up, exhaustion of the bear run is assumed as the frequency of the run becomes erratic.
The color scheme is designed to be read from darkest to lightest when a sequence of events is found. I.E Dark Maroon>Red>Orange or Inversely Dark Blue>Green>White
In keeping with the best practices and traditions of TradingView, we have published this as a public script with the best intentions of aiding the TradingView community in unique and valuable ways. While some of our best indicators are by invite only, we feel an addition to the community of this magnitude will add to the fabric and substance of community.

MTF Commodity Oddity Index (CCI+)MTF Commodity Oddity Index (CCI+)
This chart overlay indicator is based upon the Commodity Channel Index (CCI) and can signal multiple triple-timeframe CCI overbought and oversold confluences directly onto your chart, intended for use as a confluence either for reversal trade entries, or potential trade exits, indicating where price may be probable to reverse.
Features include:
- Primary set of fully configurable triple-timeframe overbought and oversold signals, indicating where 3 selected timeframes are all overbought or all oversold at the same time. Enabled by default.
- Secondary set of fully configurable triple-timeframe overbought and oversold signals, indicating where 3 selected timeframes are all overbought or all oversold at the same time. Enabled by default.
- Optional drawing of background colours and/or ribbon seen at bottom of the chart image.
- The default primary MTF #1 timeframes are set to 1 minute, 5 minute and 15 minute. These are highly suitable for low timeframe scalpers trading on < 5m charts, and can often pin point price reversals.
- The default Secondary MTF #2 timeframes are set to 15 minute, 30 minute and 120 minute. These are suitable for both low timeframe scalpers and considerably higher timeframe traders.
- Independent alerts for MTF #1 and MTF #2 triple-timeframe confluences, including options for alerting MTF overbought and MTF oversold individually, as well as an option for alerting either overbought or oversold in a single combined alert.
- Also includes standard configurable CCI options, including CC length and source type.
Note: The features listed above are accurate at the time of publishing but maybe updated or added to in future.
A similar MTF CCI indicator is also available as a panel indicator here .
This indicator is based upon the original MTF Fantastic Stochastic (FS+) available here .
What is the Commodity Channel Index (CCI)?
Investopedia has described the popular oscillator as follows:
“The Commodity Channel Index (CCI) is a momentum-based oscillator used to help determine when an investment vehicle is reaching a condition of being overbought or oversold.
Developed by Donald Lambert, this technical indicator assesses price trend direction and strength, allowing traders to determine if they want to enter or exit a trade, refrain from taking a trade, or add to an existing position. In this way, the indicator can be used to provide trade signals when it acts in a certain way.”
You can read more about the CCI , its use cases and calculations here .
How do traders use overbought and oversold levels in their trading?
The oversold level, that is traditionally when the CCI is above the 100 level is typically interpreted as being 'overbought', and below the -100 level is typically considered 'oversold'. Traders will often use the CCI at an overbought level as a confluence for entry into a short position, and the CCI at an oversold level as a confluence for an entry into a long position. These levels do not mean that price will necessarily reverse at those levels in a reliable way, however. This is why this version of the CCI employs the triple timeframe overbought and oversold confluence, in an attempt to add a more confluence and reliability to this usage of the CCI . While traditionally, the overbought and oversold levels are below -100 for oversold, and above 100 for overbought, the default threshold settings of this indicator have been increased to provide fewer, stronger signals, especially suited to the low timeframes and highly volatile assets.

MTF CCI + Realtime DivergencesMulti-timeframe Commodity Channel Index (CCI) + Realtime Divergences + Alerts
This version of the CCI includes the following features:
- Optional 2x sets of triple-timeframe overbought and oversold signals with fully configurable timeframes and overbought and oversold thresholds, can indicate where 3 selected timeframes are all overbought or all oversold at the same time, with alert option.
- Optional divergence lines drawn directly onto the oscillator in realtime, with alert options.
- Configurable pivot periods to fine tune the divergences drawn in order to suit different trading styles and timeframes, including the ability to enable automatic adjustment of pivot period per chart timeframe.
- Alternate timeframe feature allows you to configure the oscillator to use data from a different timeframe than the chart it is loaded on.
- 'Hide oscillator' feature allows traders to hide the oscillator itself, leaving only the background colours indicating the overbought and oversold periods and/or MTF overbought and oversold confluences, as seen in the chart image.
- Also includes standard configurable CCI options, including CCI length and source type. Defaults set to length 20, and hlc3 source type.
- Optional Flip oscillator feature, allows users to flip the oscillator upside down, for use with Tradingviews 'Flip chart' feature (Alt+i), for the purpose of manually spotting divergences, where the trader has a strong natural bias in one direction, so that they can flip both the chart and the oscillator.
- Optional 'Fade oscillator' feature, which will fade out all but the most recent period, reducing visual noise on the chart.
While this version of the CCI has the ability to draw divergences in realtime along with related alerts so you can be notified as divergences occur without spending all day watching the charts, the main purpose of this indicator was to provide the triple-timeframe overbought and oversold confluence signals, in an attempt to add more confluence, weight and reliability to the single timeframe overbought and oversold states, commonly used for trade entry confluence. It's primary purpose is intended for scalping reversal trades on lower timeframes, typically between 1-15 minutes, which can be used in conjunction with the regular divergences the indicator can highlight. The triple timeframe overbought can often indicate near term reversals to the downside, with the triple timeframe oversold often indicating neartime reversals to the upside. The default timeframes for this confluence are set to check the 1m, 5m and 15m timeframes together, ideal for scalping the < 15 minute charts. The default settings for the MTF #1 timeframes (1m, 5m and 15m) are best used on a <5 minute chart.
Its design and use case is based upon the original MTF Stoch RSI + Realtime Divergences found here .
Commodity Channel Index (CCI)
Investopedia has described the popular oscillator as follows:
“The Commodity Channel Index (CCI) is a momentum-based oscillator used to help determine when an investment vehicle is reaching a condition of being overbought or oversold.
Developed by Donald Lambert, this technical indicator assesses price trend direction and strength, allowing traders to determine if they want to enter or exit a trade, refrain from taking a trade, or add to an existing position. In this way, the indicator can be used to provide trade signals when it acts in a certain way.”
You can read more about the CCI, its use cases and calculations here .
How do traders use overbought and oversold levels in their trading?
The oversold level, that is traditionally when the CCI is above the 100 level is typically interpreted as being 'overbought', and below the -100 level is typically considered 'oversold'. Traders will often use the CCI at an overbought level as a confluence for entry into a short position, and the CCI at an oversold level as a confluence for an entry into a long position. These levels do not mean that price will necessarily reverse at those levels in a reliable way, however. This is why this version of the CCI employs the triple timeframe overbought and oversold confluence, in an attempt to add a more confluence and reliability to this usage of the CCI. While traditionally, the overbought and oversold levels are below -100 for oversold, and above 100 for overbought, he default threshold settings of this indicator have been increased to provide fewer, stronger signals, especially suited to the low timeframes and highly volatile assets.
What are divergences?
Divergence is when the price of an asset is moving in the opposite direction of a technical indicator, such as an oscillator, or is moving contrary to other data. Divergence warns that the current price trend may be weakening, and in some cases may lead to the price changing direction.
There are 4 main types of divergence, which are split into 2 categories;
regular divergences and hidden divergences. Regular divergences indicate possible trend reversals, and hidden divergences indicate possible trend continuation.
Regular bullish divergence: An indication of a potential trend reversal, from the current downtrend, to an uptrend.
Regular bearish divergence: An indication of a potential trend reversal, from the current uptrend, to a downtrend.
Hidden bullish divergence: An indication of a potential uptrend continuation.
Hidden bearish divergence: An indication of a potential downtrend continuation.
How do traders use divergences in their trading?
A divergence is considered a leading indicator in technical analysis , meaning it has the ability to indicate a potential price move in the short term future.
Hidden bullish and hidden bearish divergences, which indicate a potential continuation of the current trend are sometimes considered a good place for traders to begin, since trend continuation occurs more frequently than reversals, or trend changes.
When trading regular bullish divergences and regular bearish divergences, which are indications of a trend reversal, the probability of it doing so may increase when these occur at a strong support or resistance level . A common mistake new traders make is to get into a regular divergence trade too early, assuming it will immediately reverse, but these can continue to form for some time before the trend eventually changes, by using forms of support or resistance as an added confluence, such as when price reaches a moving average, the success rate when trading these patterns may increase.
Typically, traders will manually draw lines across the swing highs and swing lows of both the price chart and the oscillator to see whether they appear to present a divergence, this indicator will draw them for you, quickly and clearly, and can notify you when they occur.
Setting alerts.
With this indicator you can set alerts to notify you when any/all of the above types of divergences occur, on any chart timeframe you choose, and also when the triple timeframe overbought and oversold confluences occur.
Configurable pivot period.
You can adjust the default pivot period values to suit your prefered trading style and timeframe. If you like to trade a shorter time frame, lowering the default lookback values will make the divergences drawn more sensitive to short term price action. By default, this indicator has enabled the automatic adjustment of the pivot periods for 4 configurable timeframes, in a bid to optimise the divergences drawn when the indicator is loaded onto any of the 4 timeframes. These timeframes and the auto adjusted pivot periods on each of them can also be reconfigured within the settings menu.
Disclaimer: This script includes code adapted from the Divergence for Many Indicators v4 by LonesomeTheBlue . With special thanks.

Accurate BUY & SELL 5 mins TF by RRAlways trade using 5 mins Time frame of chart.
For Buy entry always buy 1 point above the candle closing price & SL would be previous candle low or 30 points.
For Sell Entry Always Sell 1 point below the candle opening price & SL would be previous candle high or 30 points.
Do not take trades using 3 mins Time frame, as there is lot of noise. It works best with 5 mins Time frame.
I have adjusted/set according my trading pattern, if needed use the settings options to set accordingly .
Removed range highlighter to keep the chart simple.
Original Version credits to ZacVaughn
Actual Version i just set alerts and change the parameters for Crude OIL 5min Chart.
NO REPAINT.
Wait For Barclose

Rate ConverterThis is a simple rate converter that can convert almost anything into almost anything else. It supports cryptocurrencies, currencies and most commodities.
On the chart we see the following:
USD (US Dollar) into EUR (Euro) as a candle stick chart
WTICO (West Texas Intermediate Crude Oil) into ISK (Icelandic Krona) as a bar chart
ADA (Cardano) into JMD (Jamaican Dollar) as a line chart
XPT (Platinum) into XAG (Silver) as a scatter plot
It supports plotting the rates as japanese candlesticks, bars, lines, or as a scatter plot.

Reflex - A new Ehlers indicatorSource: Stocks and Commodities V38
Hooray! A new John Ehlers indicator!
John claims this indicator is lag-less and uses the SPY on the Daily as an example.
He states that drawing a line from peak to peak (or trough to trough) will correspond perfectly with the Asset.
I have to say I agree! There is typically one bar of lag or no lag at all!
I believe this indicator can be used for either entries or exits, but not both.
Entry
1. Entering Long positions at the pivot low points (Stocks and ETFs)
2. Entering Long when the Reflex crosses above the zero lines (Stocks, ETFs, Commodities)
Exit
1. Exiting Long positions at a new pivot high point (Stocks and ETFs)
2. Exiting Long when the Reflex crosses below the zero lines (Stocks, ETFs, Commodities)
In this example, I place a Long order on the SPY every time the Reflex crosses above the zero level and exit when it crosses below or pops my stop loss, set at 1.5 * Daily ATR.
4/6 Wins
+10.76%
For me, that's good enough to create a strategy and backtest on several Indices and ETFs, which is what I have a hunch this will work on.
I think there is a lot of promise from a single Indicator!
Let me know in the comment section if you're able to use this in a strategy.

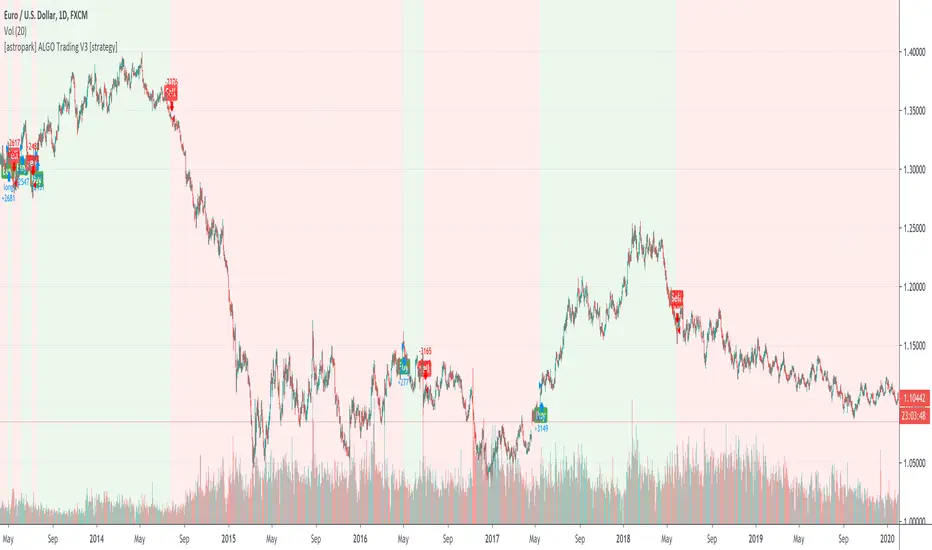
[astropark] ALGO Trading V3 [alarms]Dear Followers,
today another awesome Swing and Scalping Trading Strategy indicator, runnable on a bot , which works great on many timeframes (from 1h and above is suggested), just write me in order to help you find correct settings).
It must be said that this strategy works even better on 1m Renko chart!
If you are a scalper or you are a swing trader, you will love suggested entries for fast and long-lasting profit.
Keep in mind that a proper trailing stop strategy and risk management and money management strategies are very important (DM me if you need any clarification on these points).
This is not an evolution of "ALGO Trading V1" or "ALGO Trading V2" , but a twin sister of them.
For your reference, here it is the "ALGO Trading V1" indicator
and here the "ALGO Trading V2"
This strategy has the following options:
enable/disable signals on chart
enable/disable bars and background coloring based on trend
enable/disable a "filter noise" option , which try to reduce overtrading (you can easily check it on backtesting)
enable/disable a Take Profit / Stop Loss option (you can easily check it on backtesting too)
enable/disable a secret SmartOption which may improve profit on your chart (again, check it on you chart if it helps or not)
This strategy only trigger 1 buy or 1 sell. If you enable Take Profit / Stop Loss option, consider that many TP can be triggered before trend reversal, so take partial profit on every TP an eventually buy/sell back lower/higher to maximize your profit.
This script will let you set all notifications you may need in order to be alerted on each triggered signals.
The one for backtesting purpose can be found by searching for the astropark's "ALGO Trading V3" and then choosing the indicator with "strategy" suffix in the name, or you can find here below
Strategy results are calculated on the time window from 1995 to now, so on more than 15 years, using 1000$ as initial capital and working at 1x leverage (so no leverage at all! If you like to use leverage, be sure to use a safe option, like 3x or 5x at most in order to have liquidation price very far).
This is not the "Holy Grail", so use a proper risk management strategy.
This script will let you backtest how the indicator will perform on any chart and timeframe you may like to test and/or trade. Of course results will be very different depending on the chart and timeframe you will open. I tested a lot of charts and always you can find a combination that keep this strategy in profit on swing trading style (and this means that if you can have a daily look at the chart you can always manage to maximize your profit on each trade!)
This is a premium indicator , so send me a private message in order to get access to this script.

[astropark] ALGO Trading V3 [strategy]Dear Followers,
today another awesome Swing and Scalping Trading Strategy indicator, runnable on a bot , which works great on many timeframes (from 1h and above is suggested), just write me in order to help you find correct settings).
It must be said that this strategy works even better on 1m Renko chart!
If you are a scalper or you are a swing trader, you will love suggested entries for fast and long-lasting profit.
Keep in mind that a proper trailing stop strategy and risk management and money management strategies are very important (DM me if you need any clarification on these points).
This is not an evolution of "ALGO Trading V1" or "ALGO Trading V2" , but a twin sister of them.
For your reference, here it is the "ALGO Trading V1" indicator
and here the "ALGO Trading V2"
This strategy has the following options:
enable/disable signals on chart
enable/disable bars and background coloring based on trend
enable/disable a "filter noise" option , which try to reduce overtrading (you can easily check it on backtesting)
enable/disable a Take Profit / Stop Loss option (you can easily check it on backtesting too)
enable/disable a secret SmartOption which may improve profit on your chart (again, check it on you chart if it helps or not)
This strategy only trigger 1 buy or 1 sell. If you enable Take Profit / Stop Loss option, consider that many TP can be triggered before trend reversal, so take partial profit on every TP an eventually buy/sell back lower/higher to maximize your profit.
In order to get notified when a signal is triggered, you need to use the "alarms" version of this indicator (just search for astropark's "ALGO Trading V3" indicator and choose the one with "alarms" suffix).
Strategy results are calculated on the time window from 1995 to now, so on more than 15 years, using 1000$ as initial capital and working at 1x leverage (so no leverage at all! If you like to use leverage, be sure to use a safe option, like 3x or 5x at most in order to have liquidation price very far).
This is not the "Holy Grail", so use a proper risk management strategy.
This script will let you backtest how the indicator will perform on any chart and timeframe you may like to test and/or trade. Of course results will be very different depending on the chart and timeframe you will open. I tested a lot of charts and always you can find a combination that keep this strategy in profit on swing trading style (and this means that if you can have a daily look at the chart you can always manage to maximize your profit on each trade!)
This is a premium indicator , so send me a private message in order to get access to this script.
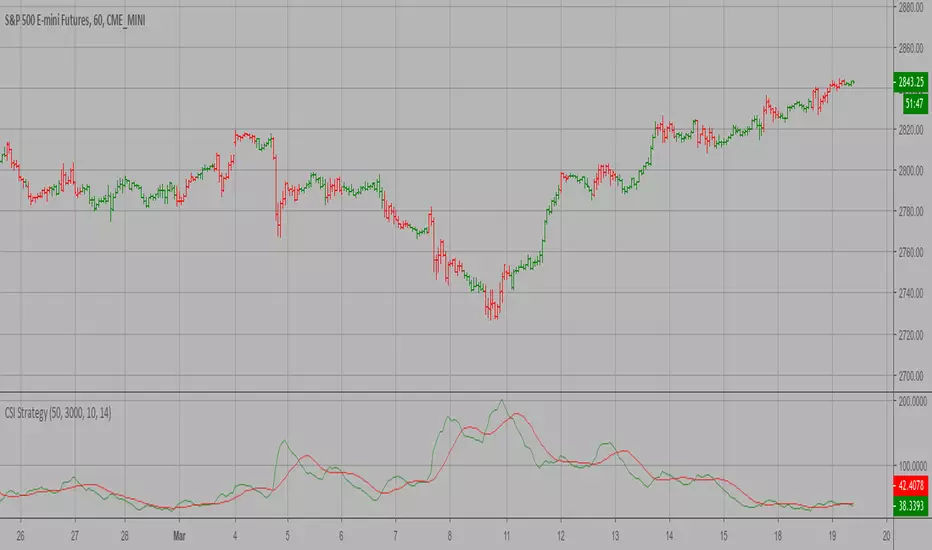
Combo Strategy 123 Reversal & Commodity Selection Index This is combo strategies for get a cumulative signal.
First strategy
This System was created from the Book "How I Tripled My Money In The
Futures Market" by Ulf Jensen, Page 183. This is reverse type of strategies.
The strategy buys at market, if close price is higher than the previous close
during 2 days and the meaning of 9-days Stochastic Slow Oscillator is lower than 50.
The strategy sells at market, if close price is lower than the previous close price
during 2 days and the meaning of 9-days Stochastic Fast Oscillator is higher than 50.
Second strategy
The Commodity Selection Index ("CSI") is a momentum indicator. It was
developed by Welles Wilder and is presented in his book New Concepts in
Technical Trading Systems. The name of the index reflects its primary purpose.
That is, to help select commodities suitable for short-term trading.
A high CSI rating indicates that the commodity has strong trending and volatility
characteristics. The trending characteristics are brought out by the Directional
Movement factor in the calculation--the volatility characteristic by the Average
True Range factor.
Wilder's approach is to trade commodities with high CSI values (relative to other
commodities). Because these commodities are highly volatile, they have the potential
to make the "most money in the shortest period of time." High CSI values imply
trending characteristics which make it easier to trade the security.
The Commodity Selection Index is designed for short-term traders who can handle
the risks associated with highly volatile markets.
WARNING:
- For purpose educate only
- This script to change bars colors.
COT Commercial Positions (Updated)
This script aims to look at the markets from a manufacturer's point of view.
Producers or large enterprises gradually sell their goods as the price increases.
Because both the amount of product and position in their hands is too high, otherwise they can not find buyers, and they have to make a safe profit.
Therefore, I have shown short positions in green and long positions in red.
Blue is the net position formed by subtracting long positions from short positions.
This script is created with the latest Quandl data number codes.
Please let me know if you see a missing or a code update.
I recommend using it in a weekly (1W) time frame.
CAUTION : Since Bitcoin producer positions are very sparse, speculative long positions have been preferred in Bitcoin.
If you're looking for Bitcoin,
select Bitcoin from the menu.
Regards.


AntiRekt Trend OscillatorWhen the indicator value is above the horizon line the trend is up, below the trend is down. Watch out for ranging markets.

Commodity Selection Index Backtest The Commodity Selection Index ("CSI") is a momentum indicator. It was
developed by Welles Wilder and is presented in his book New Concepts in
Technical Trading Systems. The name of the index reflects its primary purpose.
That is, to help select commodities suitable for short-term trading.
A high CSI rating indicates that the commodity has strong trending and volatility
characteristics. The trending characteristics are brought out by the Directional
Movement factor in the calculation--the volatility characteristic by the Average
True Range factor.
Wilder's approach is to trade commodities with high CSI values (relative to other
commodities). Because these commodities are highly volatile, they have the potential
to make the "most money in the shortest period of time." High CSI values imply
trending characteristics which make it easier to trade the security.
The Commodity Selection Index is designed for short-term traders who can handle
the risks associated with highly volatile markets.
WARNING:
- For purpose educate only
- This script to change bars colors.

Commodity Selection Index Strategy The Commodity Selection Index ("CSI") is a momentum indicator. It was
developed by Welles Wilder and is presented in his book New Concepts in
Technical Trading Systems. The name of the index reflects its primary purpose.
That is, to help select commodities suitable for short-term trading.
A high CSI rating indicates that the commodity has strong trending and volatility
characteristics. The trending characteristics are brought out by the Directional
Movement factor in the calculation--the volatility characteristic by the Average
True Range factor.
Wilder's approach is to trade commodities with high CSI values (relative to other
commodities). Because these commodities are highly volatile, they have the potential
to make the "most money in the shortest period of time." High CSI values imply
trending characteristics which make it easier to trade the security.
The Commodity Selection Index is designed for short-term traders who can handle
the risks associated with highly volatile markets.
Commodity Channel IndexI was checking the formula of built-in " cci " function and decided to publish a more customizable version of the Commodity Channel Index, so you can play with levels and a bunch of different sources.
If someone doesn't know what is this:
This indicator was originally developed by Donald R. Lambert ( "Commodities" magazine, 1980) to identify cyclical or seasonal price patterns in commodities. Now it is applied not only to commodities but to market indices, stocks and Forex.
Good luck!
