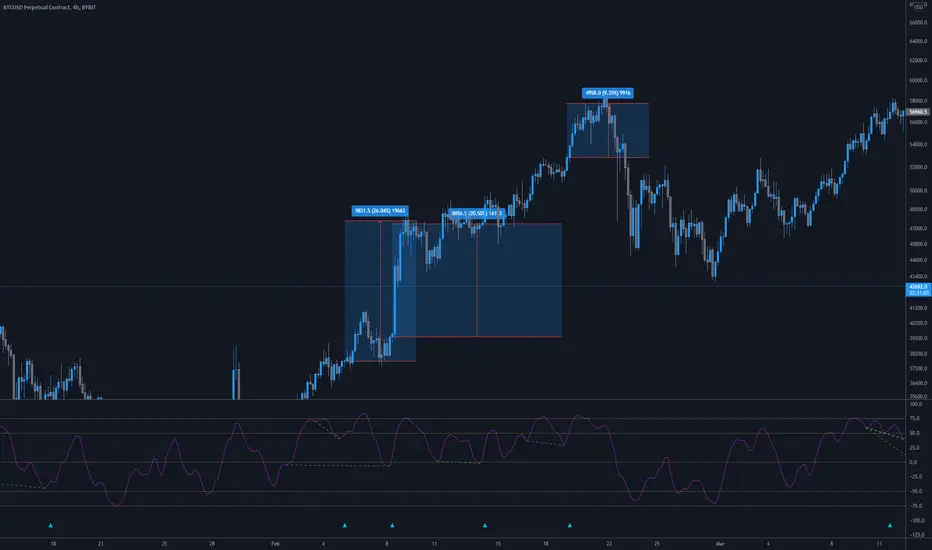
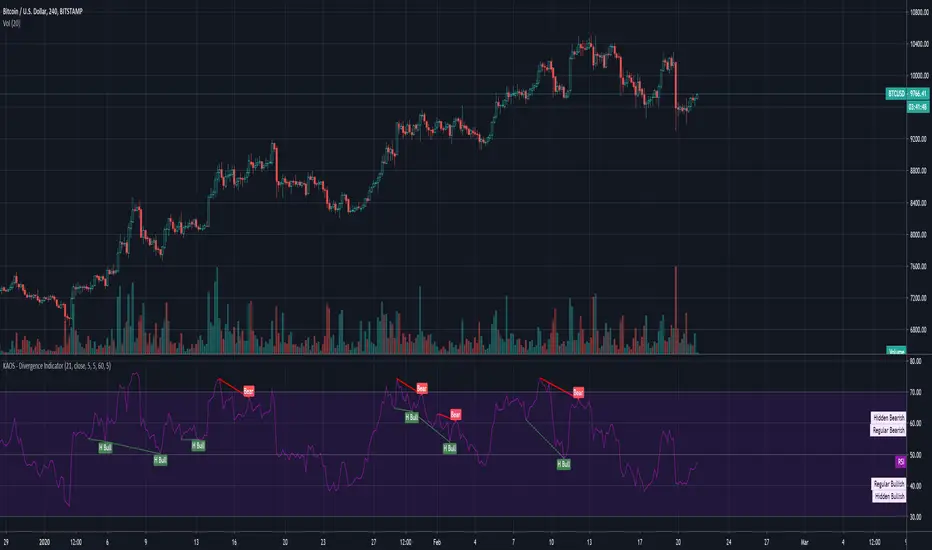
Divergence HunterThis script searches multiple divergences based on the wave trend indicator
You could combine support and resistance to identify with the bearish divergence a Potential Top.
Bullish divergence on the other hand could indicate that the market found its bottom and you should keep your eye open for an long entry.
If you are already short and took some profit the hidden bearish divergence could indicate a continuation of the downtrend. Could also be used together with Fib-Retracement to find a reentry or an add for your current entry.
Hidden bull divs could be used to find a reentry in the current up trending move or of course could be used as and add for your current position.
If you want to try it or have questions leave me a message.
DISCLAIMER: No sharing, copying, reselling, modifying, or any other forms of use are authorized for the documents, script / strategy, and the information published with them. This informational planning script / strategy is strictly for individual use and educational purposes only. This is not financial or investment advice. Investments are always made at your own risk and are based on your personal judgement. I am not responsible for any losses you may incur. Please invest wisely.
Continuation
BenTrading bullish trend continuation sweepThis script uses simple features to indicate where a trend may continue.
It uses market structures and monitors breaks of swing highs and swing lows.
If there is a break upwards, the alert will give signal when there is a sweep that forms in the biased direction (see chart - alert will trigger on candle close).
For it to send alerts you must right click the indicator and apply alert - "once per bar".
This indicator only shows bullish signals, while there is another indicator that can be used alongside it to indicate bearish trend continuation with the same features.

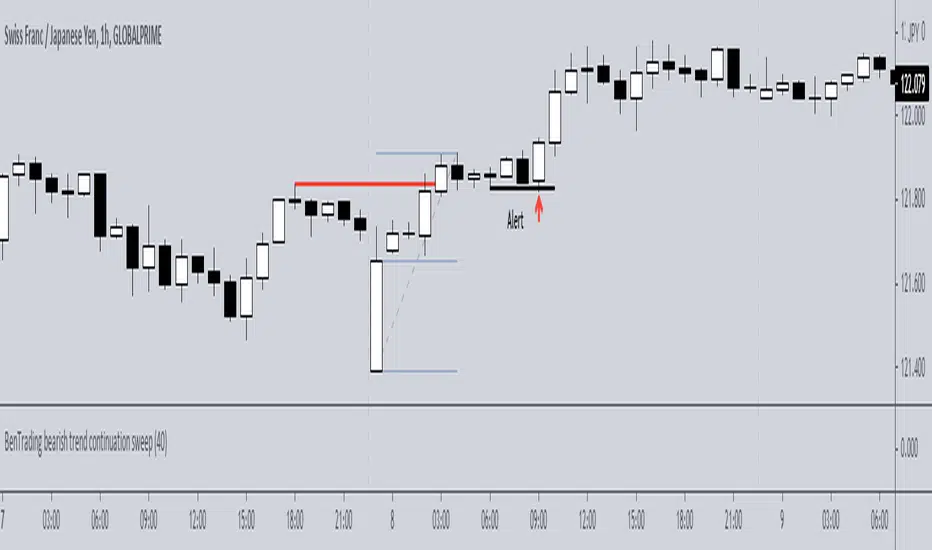
BenTrading bearish trend continuation sweepThis script uses simple features to indicate where a trend may continue.
It uses market structures and monitors breaks of swing highs and swing lows.
If there is a break downwards, the alert will give signal when there is a sweep that forms in the biased direction (see chart - alert will trigger on candle close).
For it to send alerts you must right click the indicator and apply alert - "once per bar".
This indicator only shows bearish signals, while there is another indicator that can be used alongside it to indicate bullish trend continuation with the same features.
BenTrading bullish trend continuation trackerThis script uses simple features to indicate where a trend may continue.
It uses market structures and monitors breaks of swing highs and swing lows.
If there is a break upwards, the alert will give signal when swing points forms (see chart - alert 1) or when sweeps form (see chart - alert 2).
For it to send alerts you must right click the indicator and apply alert - "once per bar".
This indicator only shows bullish signals, while there is another indicator that can be used alongside it to indicate berish trend continuation with the same features.

Entry master RSI pullbackSimply using a single RSI and placing a signal after it crosses the 50 level after being overbought or oversold in the same direction.

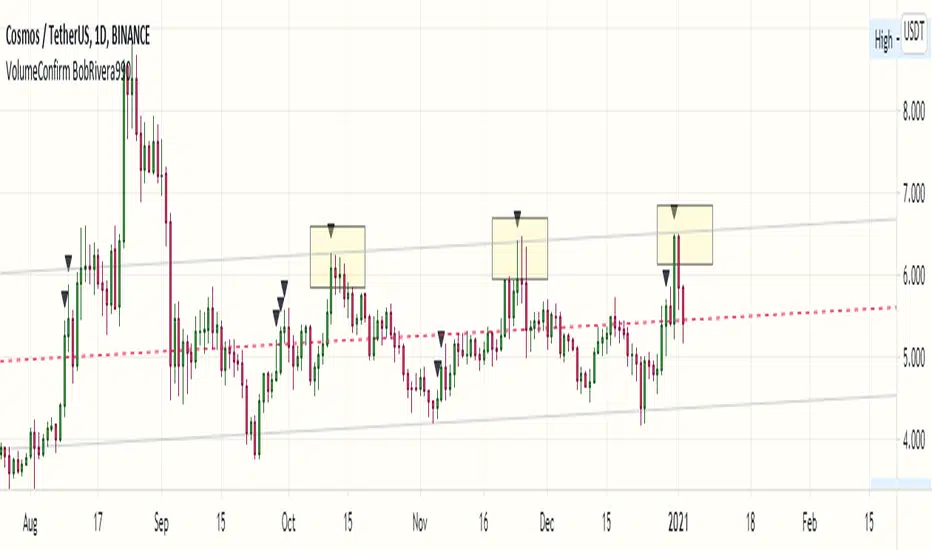
Volume Confirmation Signal by BobRivera990The purpose of this script is to determine the response of trading volume to price action
This is not an indicator but a set of four signals
1 - Bullish Strength Signal (Upward Green Triangle) :
If the resistance is broken at the same time is valid
this signal indicates the continuation of the bullish trend
the trading volume is relatively high.
If the bar is closed above the resistance level, It will probably turn into support.
2 - Bullish Reversal Signal (Upward Black Triangle) :
if the bar is closed above the support level is valid
this signal indicates trend reversal after a bearish candle
the trading volume is very high.
3 - Bearish Strength Signal (Downward Red Triangle) :
If the Support is broken at the same time is valid
this signal indicates the continuation of the bearish trend
the trading volume is relatively high.
If the bar is closed below the support level, It will probably turn into resistance.
4 - Bearish Reversal Signal (Downward Black Triangle) : if the bar is closed below the resistance level is valid
this signal indicates trend reversal after a bullish candle
the trading volume is very high.
VPR Grid█ OVERVIEW
Official release of VPR Grid, a mean reverting, trend discovering tool meant to protect capital and find high probability entries.
What this indicator is meant to be used for:
Mean reverting trades
Entries or exits for either swing trades or scalps
Traditional and cryptocurrency markets
Low and high timeframe setups
Sentiment checks
Options to configure:
Optionally use volume in analysis
Use intraday, daily, weekly, or month calculation + choose how many periods of each
Moving average length. This is best kept on the lower end for cryptocurrencies, with respect for volatility
Grid spacing: a purely comestic option that should help with viewing the indicator.
The most important thing to use VPR effectively is to use its settings. The flexibility of VPR Grid is given through its settings. The development that went towards mean reversion and trend discovering means it is a hybrid of fading and trend following tools.
This is a paid premium indicator; please DM me for access. See the images below for examples/explanations on the indicator. Take note of the indicator arguments and which settings were used for a certain timeframe or asset class.

RSI MTF thresholds with auto adjustmentThe RSI MTF thresholds panel allows for identification of strong trends across multiple timeframes with automatic adjustment for different timeframes by utilising multiples of the chosen resolution. A specific timeframe can be used by entering its multiple in the corresponding Resmult() box.
The panel shows the current timeframe as well as 4 additional timeframes, displaying whether the RSI level is above a high threshold or below a low threshold.
A green or red indication on all timeframes is a strong indication of a trend that has some staying power on the timeframe under examination.
Markets that are ranging with no identifiable trend will show blank spaces.
Failure of the trend to "climb up" the panel shows a weak trend, while repeated signals in the same direction is a strong indication of a trend forming as the RSI level is prevented from cycling to the opposing extreme.
High probability continuations can be identified by a brief loss of signal at the lowest level of the panel only (corresponding to the current timeframe).
Setting the thresholds higher towards the overbought/oversold regions will identify levels that are oversold on multiple timeframes.
Happy to take suggestions or attempt to modify if there is interest.

CCI - SWIFF KNIFECCI indicator swiff knife.
A lot of different usages of CCI ae possible with this script :
- 2 CCI lines crossovers.
- CCI - 0 Line crossovers
- CCI + Moving Average crossovers (many types of MA are available)
Filters can be added.
CCI can be used as a confirmation indicator, a continuation indicator, an exit indicator, a chopiness indicator .... It can even make coffee, who knows.

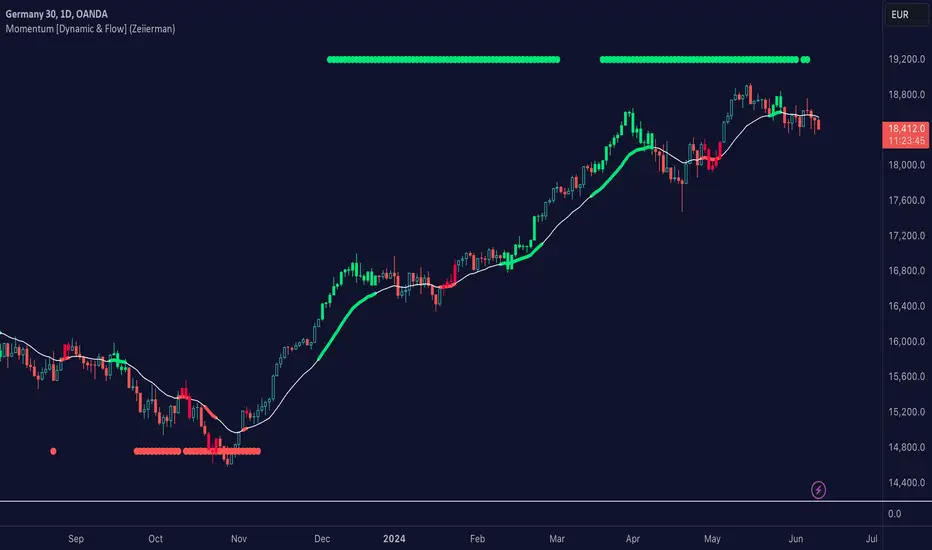
Momentum [Dynamic & Flow] (Expo)Momentum Dynamic & Flow (Expo) is a useful indicator that displays the momentum - as dynamic & flow, as well as where the momentum begins to stall.
♢ Momentum -Dynamic can be used to identify overbought and oversold areas.
♢ Momentum -Flow can be used to identify if the current trend has strong momentum.
♢ When momentum begins to stall it can be identifiable turning points, areas of congestion. However, it's not a sign that the trend is over, see it as "heads up" This is displayed with green and red colors on the moving average.
Momentum can be displayed at the top/bottom of the chart or above/below the bars. The user can also display momentum as BGcolor.
The indicator can be used standalone or as a part of your current trading strategy
HOW TO USE
1. Use the indicator to identify where the momentum stall.
2. Use the indicator to identify overbought/oversold areas with momentum -Dynamic.
3. Use the indicator to confirm the existence, or a continuation, of a trend with momentum -Flow.
INDICATOR IN ACTION
1-hour chart
4-hour chart
I hope you find this indicator useful , and please comment or contact me if you like the script or have any questions/suggestions for future improvements. Thanks!
I will continually work on this indicator, so please share your experience and feedback as it will enable me to make even better improvements. Thanks to everyone that has already contacted me regarding my scripts. Your feedback is valuable for future developments!
-----------------
Disclaimer
Copyright by Zeiierman.
The information contained in my scripts/indicators/ideas does not constitute financial advice or a solicitation to buy or sell any securities of any type. I will not accept liability for any loss or damage, including without limitation any loss of profit, which may arise directly or indirectly from the use of or reliance on such information.
All investments involve risk, and the past performance of a security, industry, sector, market, financial product, trading strategy, or individual’s trading does not guarantee future results or returns. Investors are fully responsible for any investment decisions they make. Such decisions should be based solely on an evaluation of their financial circumstances, investment objectives, risk tolerance, and liquidity needs.
My scripts/indicators/ideas are only for educational purposes!
NCTA Adaptive Entry SystemAdaptive Entry System (AES)
Price action of stocks, indexes, and futures consists of periods of trending action, retracements within the trend and then a resumption of the original trend. Trending patterns do not move straight up or straight down. They move in cycles which, when properly identified, can offer traders an opportunity to “follow the trend” while also recognizing the probability of a near term retracement before resuming movement in the direction of the trend. Experienced traders with advanced skills at interpreting wave patterns (Elliott Wave), Fibonacci retracements, Stochastics (overbought / oversold conditions), Momentum, and Moving Averages apply their advanced knowledge to trading and identifying these trend - retracement - continuation of trend cycles. These skills require an advanced knowledge of these complex indicators and can be difficult for traders without the same skill set to optimize their trading performance.
The Adaptive Entry System (AES) was created as a technical market metrics system to interpret a variety of advanced signals and present to the trader a “single actionable signal” displayed in an easy to recognize format for traders of most any skill level to benefit from.
AES is a “system” as opposed to a single indicator. It was designed with the goal of simplifying a traders ability to recognize an entry opportunity by summarizing the consensus of several key indicators and displaying a single entry / exit signal in a color highlighted, strategy labeled format. The work of comparing a variety of indicators and assessing the strength of alignment is performed for the trader by the Adaptive Entry System.
There are three possible entry signals displayed. A trader may trade all three or customize the settings to choose just a single signal to trade. It is important for any trader incorporating AES into their toolset that they trade in sim / virtual mode for a period of time to confirm they understand how price action responds to the signals and to personally track the performance of each. A good trading system still requires due diligence on the part of the trader to confirm understanding of how the system performs.
Entry Signal #1 Description:
Trend Bias Plus Signal is intended to provide traders with an early view of the probable directional bias of the stock, index, or futures being traded. Trend Bias was designed to recognize the probability of the early stages of the strongest segment of a wave pattern. Recognizing the probable bias of the trend at an early stage and also having an indication of when that trend may be ending offers traders an opportunity to enhance their ability to optimally benefit from the trend.
How to Read the Trend Bias Plus Signal:
The Trend Bias Plus Signal is displayed as a simple to recognize color coding of the price bars. Blue price bars indicate a probable rising price bias. Red price bars indicate a probable declining price bias. White bars indicate a neutral period with no clear directional bias.
How to Trade the Trend Bias Plus Signal:
The Trend Bias Plus Signal is simple to interpret. When a price bar closes blue and the next price bar opens blue, this signals to the trader to open an upward bias position. Buy-to-open a call option, buy the stock, or open a long futures position. When a price bar closes red and the next price bar opens red, this signals to the trader to open a downward bias position. Buy-to-open a put option, short the stock or close a long stock position, or open a short futures position.
When holding a short or long position based on the Trend Bias Plus, there are a variety of exit methods which a trader can use including stops, limit price orders with fixed profit targets, or trail stops. Regardless, the end of a Trend Bias Plus cycle is indicated when a new price bar opens white. This is evidence that the current rising or declining trend is shifting to a neutral state. A trend may also be viewed as having ended when an opposite color bar prints at the open of a new price bar.
Entry Signal #2 Description:
The Momentum Signal is a near term indication of a probable retracement of the current trend. It identifies a temporary reversal of an overarching trend in a stock's price. Retracements are short-term periods of movement against a trend, followed by a return to the previous trend. Momentum signals are usually counter-trend trades identifying that part of the wave sequence where price temporarily moves opposite the direction of the trend. The momentum signal can be an opportunity for traders to take advantage of the natural pattern of trend - retracements - continuation.
How to Read the Momentum Signal:
The Momentum signal is displayed as a vertical color highlight on the price bar with a “M” label inside a directional indicator box. A red vertical highlight with an arrow box and “M” label pointing lower is a signal that the near term price movement may be downward bias. For an upward bias price movement signal, the Momentum indicator will display a green highlight across the price bar with an arrow box and “M” label pointing higher.
How to Trade the Momentum Signal:
When the highlighted directional labeled box prints at the open of a new price bar, take the trade based on the directional bias displayed. Momentum signals are generally counter trend indicators so a downward bias red bar, prompting the trader to go short may print on a long bias blue Trend Bias Plus price bar. This should not be viewed as a conflict but instead as a probable indication of a short term retracement following the natural sequence of cycles in price movement.
Momentum signals may be traded using stocks, options, or futures.
Entry Signal #3 Description:
The Consensus Signal is an indication that price action may be resuming in the direction of the primary trend.
How to Read the Consensus Signal:
The Consensus Signal is displayed as a vertical color highlight on the price bar with a “C” label inside a directional indicator box. A red vertical highlight and an arrow box with a “C” label pointing lower is a signal that the price movement may be resuming a downward bias trend or strengthening a conviction to the current trend. For an upward bias price movement signal, the Consensus indicator will display a green highlight across the price bar and an arrow box with a “C” label pointing higher. This is a signal that the retracement off of the trend may be concluding and/or a strengthening of a conviction to the current trend.
How to Trade the Consensus Signal:
When the highlighted directional labeled box prints at the open of a new price bar, take the trade based on the directional bias displayed. Consensus signals are generally most productive when traded aligned with the trend, as displayed by the Trend Bias Plus price bar color or when a white bar indicates a neutral state of the price trend. Counter trend trades using the Consensus Signal are not advised and considered to be less productive / higher risk.
Consensus signals may be traded using stocks, options, or futures.
Some General Rules:
Trade signals are only considered valid when they display at the open of a new price bar.
The signals can be traded on different timeframe charts from short term 3 minute charts to longer timeframe daily charts.
The signals are designed to be a generic indication of probable price movement and as such, can be used effectively for trading futures, stocks, options on stocks, options on ETFs, and options on cash settled indexes.
AES offers traders an opportunity to optimize performance from the natural cycles of the market….trend - retracement - continuation.
AES offers an opportunity for traders to have a clear entry / exit criteria. However, it is still imperative that each trader understands the trading strategy they intend to use and the risks and opportunities associated with that strategy. It is highly advised, regardless of the system or strategies being used, that a trader validates their understanding of the system/strategy by trading in a simulated, paper account format to self test the system and personal ability to trade it successfully.
Next Bar Alert:
Included is an optional "Next Bar Alert" setting. Since many of these signals benefit from very prompt action at the beginning of a price bar, there is an additional option in Settings to set an arbitrary number of seconds to be alerted before the next price bar opens. Simply set this to a level you prefer, then set an alert in TradingView on the indicator using the "Next Bar Alert" alert parameter.
Summary:
The color highlight indicator allows the trader to be 100% certain that the rules/criteria for confirming a valid entry were met at the open of the price bar. This feature, along with the alert settings in Trading View, provide clear confirmation of the timing and print of the signal as either valid or not.
Adaptive Entry System has been designed to help traders of all skill levels to trade the natural sequence of patterns in price action using a simple to recognize, single signal entry/exit format. The natural cycle of trend (Trend Bias Plus), then retracement (Momentum), followed by a continuation of the original trend (Consensus) can be identified within this system and offers traders a simple signal to take advantage of each phase in the cycle. Stock investors, options traders, and futures traders can benefit from the simple design of the AES on a variety of time frames.
Trend Bias Plus signals on NASDAQ:TSLA Daily chart:
Trend Bias Plus signals on NASDAQ:AMZN Daily chart:

Price Continuation (The Strat)Shows the historic bar type, whether it is up, down, up and inside, down and inside, up and outside, or down and outside. Will only display historic bar type based on the selected time timeframe. (Ex. if you are looking at the weekly time frame, you will only see the bar type for Year, Quarter, Month, and Week. It will not display the Day or Hour bar type.)

KAOS - Divergence IndicatorDivergence Indicator... Works pretty well, Use with caution as it does amend itself depending on market whale activity.
1hr, 4hr and Daily good for macro movements.
Should be used a supplemental indicator to your over all strategy NOT as a entry exit.
Have fun :)
Made by someone else, but has been tweaked with better settings
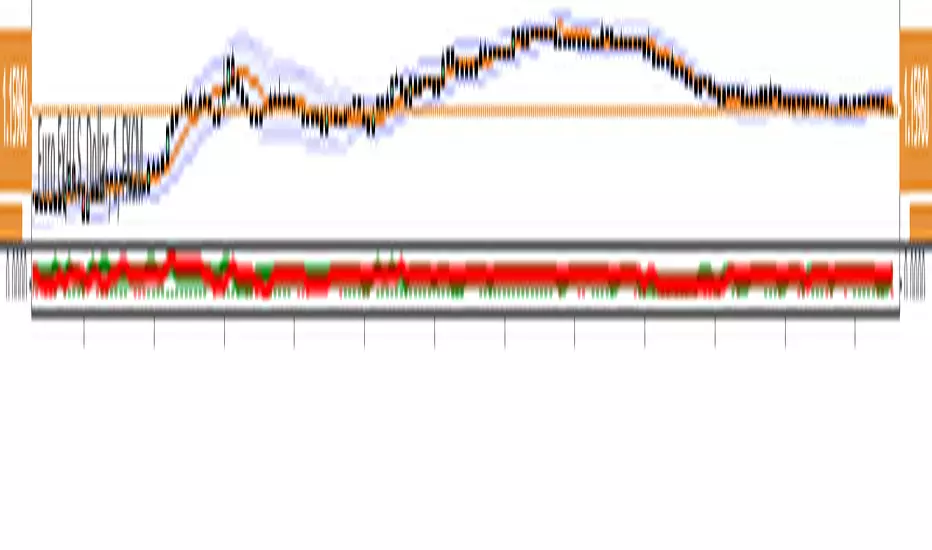
Adaptive Trend (Expo)Adaptive Trend (Expo)
DESCRIPTION
This Adaptive Trend (Expo) indicator is used to detect trends as well as to adapt to the trend characteristic in order to filter-out trend noise. Having an indicator like this enables professional traders to stay longer in trends. The indicator is also equipped with upper- and lower boundaries as well as a mid-line.
Positive trend
If the two trendlines (positive & negative trendline) emerges into one single line, it’s regarded as a positive trend. If a green cloud is painted in the indicator it’s a sign that the indicator is categorizing that price move as noise, and thus the professional trader should keep their long position, or enter Long.
Negative trend
If the two trendlines (positive & negative trendline) separates and become two lines as well as a red cloud is painted in the indicator, this is regarded as a negative trend.
As a general rule, if the ‘positive & negative trendline’ is above the midline there is a positive trend. If the ‘positive & negative trendline’ is below the midline there is a negative trend.
You have the possibility to change the ‘trendvalue’, a shorter length is more sensitive than a longer length.
HOW TO USE
1. Use the indicator to identify trends.
2. Use the indicator as a trend following strategy.
INDICATOR IN ACTION
EURUSD
EURUSD
EURUSD
BTCUSD
The indicator works with RENKO, HEIKIN ASHI and with KAGI charts as well.
I hope you find this indicator useful, and please comment or contact me if you like the script or have any questions/suggestions for future improvements. Thanks!
I will continue to work on this indicator, so please share your experience and feedback with me so that I can continuously improve it. Thanks to everyone that have contacted me regarding my scripts. Your feedback is valuable for future developments!
ACCESS THE INDICATOR
• Contact me on TradingView or use the links below
-----------------
Disclaimer
Copyright by Zeiierman.
The information contained in my scripts/indicators/ideas does not constitute financial advice or a solicitation to buy or sell any securities of any type. I will not accept liability for any loss or damage, including without limitation any loss of profit, which may arise directly or indirectly from use of or reliance on such information.
All investments involve risk, and the past performance of a security, industry, sector, market, financial product, trading strategy, or individual’s trading does not guarantee future results or returns. Investors are fully responsible for any investment decisions they make. Such decisions should be based solely on an evaluation of their financial circumstances, investment objectives, risk tolerance, and liquidity needs.
My scripts/indicators/ideas are only for educational purposes!

Trade Genius Sling Shot 2.0Our proprietary continuation signal. This is a compliment to the original slingshot, using a different algorithm to catch different types of continuation patterns.

RJT CONTINUATION TRADE STRATEGY - TRADE ENTRY INDICATORThis indicator is used to trade the RJT Continuation Trade Strategy . The fundamental idea behind this strategy is that a trend will continue. Initial entries are placed along with take profit targets and stop losses, then additional entries are placed when pull backs are identified.
This indicator highlights when to place Trade Entries - both long and short, as well as Take Profits and Stop Losses, below the price chart.
This is most powerful when combined with the RJT Continuation Trade Strategy - Trade Overview Indicator
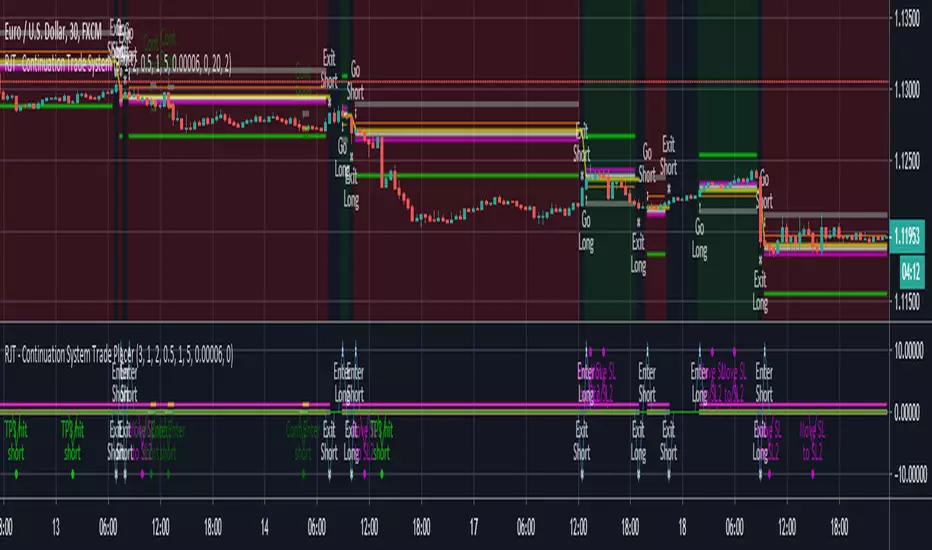
RJT CONTINUATION TRADE STRATEGY - TRADE OVERVIEW INDICATORThis indicator is used to trade the RJT Continuation Trade Strategy . The fundamental idea behind this strategy is that a trend will continue. Initial entries are placed along with take profit targets and stop losses, then additional entries are placed when pull backs are identified.
This indicator gives an overview of where Trade Entries - both long and short, as well as Take Profits and Stop Losses are on the price chart.
This is most powerful when combined with the RJT Continuation Trade Strategy - Trade Entries Indicator

Mean Reversion and Momentum - Indicator versionMean Reversion and Momentum
Interpretation:
- Divergence means trend reversal
- Parallel movement means trend continuation
Squares above serve as a confirming signal
Matt Bishop's Moving Average Compression Strategy (MAC)
This strategy works well on all time frames, however, I'm sure everyone will have their own personal preference.
**Ignore the main chart at the top, the strategy is posted in the image below.

Trend Continuation FactorTrend Continuation Factor indicator script.
This indicator was originally developed by M.H. Pee (Stocks & Commodities V. 20:3 (58-64): Trend Continuation Factor).

Trend continuation factor, by M.H. PeeTrend continuation factor, by M.H. Pee
The related article is copyrighted material from Stocks & Commodities.
