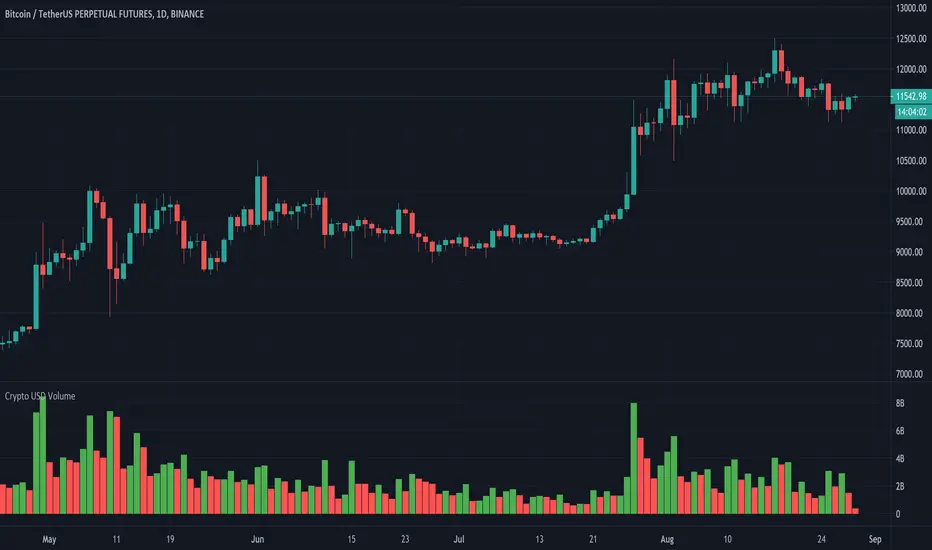
Crypto USD VolumeOften times I need to check the volume in cryptocurrency exchanges and I find myself checking which type of volume I am looking at, I need to manually make sense what the data is and converting it into USD volume which I end up going to CoinMarketCap website to verify whether my calculation is right.
Today I thought it was about time I created an automatic way to find the volume in USD Dollars. This is what this script does.
1 - It removes the base currency from the symbol (e.g., "BTCUSD", it would remove "BTC", leaving us with the "USD" part.). This is important because it helps us identify the currency the pair uses.
2 - It has different pair's variables, each is given a specific currency that the final volume is calculated from. (BTC, ETH, BNB and USD are the default currencies, for other ones, it must be added manually).
This works with all crypto symbols that include BTC, ETH, BNB and USD as currencies. If you modify it, please make sure to compare data with the exchange's one.
Криптовалюта
PpSignal Regression Weierstrass functiongHi, this is an indicator based on the slope calculation of the resultant of this moving average slope, the Weierstrass approximation theorem emerges that gives us information about where the price can go, this is only a probability of occurrence depends on the formation of the slope.
Buy when the color turns blue and aqua and sell when the moving average changes to red color ... it also has alarms

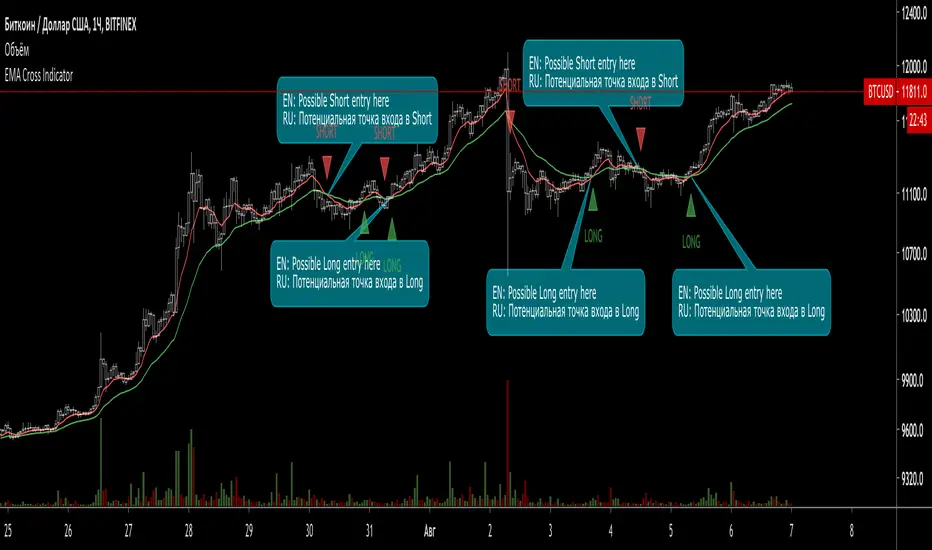
EMA Cross Indicator (with signals)This indicator shows 2 EMA (Long and Short) Cross and gives a possible entry point for a trade.
When Short EMA (red line) line crosses Long EMA (green) from bottom to top - this is a possible Long trade entry point.
When Long EMA (green line) line crosses Short EMA (red) from bottom to top - this is a possible Short trade entry point.
In both cases (basically, all the crossovers) are indicated with "Long" and "Short" labels.
Works with Crypto (from 30 min timeframe and higher)
Stocks (from 1 hour timeframe and higher)
Commodities (from 1 hour timeframe and higher)
Forex (from 1 hour timeframe and higher)
Consider using it with respect to Your trading style, money- and risk-management as well as other indicators.
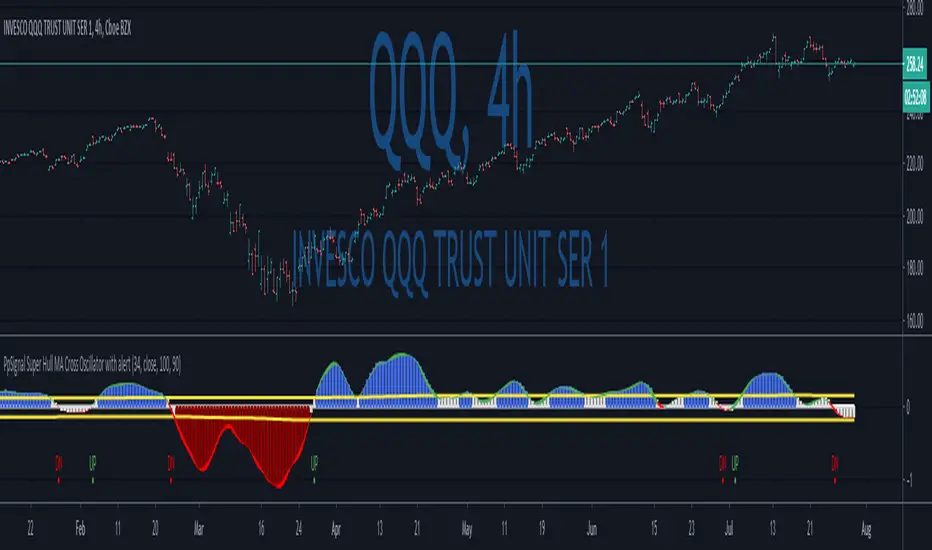
PpSignal Super Hull MA Cross Oscillator with alertWe have a Super Hull Move average oscillator style.
Super Hull, it is a hull move average open-close, smooth with elder method.
So, when you have a green color (hull cross up 0 Line), you have a buy signal.
When you have q red color (hull cross down 0 Line) sell signal.
Enjoy it...
Musashi MTF Trend HeatMapThis indicator compliments the Musashi TrendBars and allows convenient multi time frame analysis.
This HeatMap, shows 5 different time zones, each with color codes to indicate the trend expression of a corresponding timeframe.
- Dark Green = Good Uptrend (ok to enter short)
- Light Green = Uptrend but it can be exhausted (put in protective stops)
- Cyan = In Bull Trend but pulling back (be careful, maybe put in protective stops)
- Dark Red = Good Downtrend (ok to enter short)
- Orange = Downtrend but it can be exhausted (put in protective stops)
- Magenta = In Bear Trend but pulling back (be careful, maybe put in protective stops)
The dark grey markers on the Heat Map show when markets are not having strong trends.
*If you wish to license this indicator, please contact me via private message for details regarding access. Thank you.
LEGAL STUFF:
Risk Disclosure
Futures , forex, stock, crypto and derivative trading contains substantial risk and is not for every investor. An investor could potentially lose all or more than the initial investment. Risk capital is money that can be lost without jeopardizing ones’ financial security or life style. Only risk capital should be used for trading and only those with sufficient risk capital should consider trading. Past performance is not necessarily indicative of future results
Hypothetical Performance Disclosure
Hypothetical performance results have many inherent limitations, some of which are described below. no representation is being made that any account will or is likely to achieve profits or losses similar to those shown; in fact, there are frequently sharp differences between hypothetical performance results and the actual results subsequently achieved by any particular trading program. One of the limitations of hypothetical performance results is that they are generally prepared with the benefit of hindsight. In addition, hypothetical trading does not involve financial risk, and no hypothetical trading record can completely account for the impact of financial risk of actual trading. for example, the ability to withstand losses or to adhere to a particular trading program in spite of trading losses are material points which can also adversely affect actual trading results. There are numerous other factors related to the markets in general or to the implementation of any specific trading program which cannot be fully accounted for in the preparation of hypothetical performance results and all which can adversely affect trading results

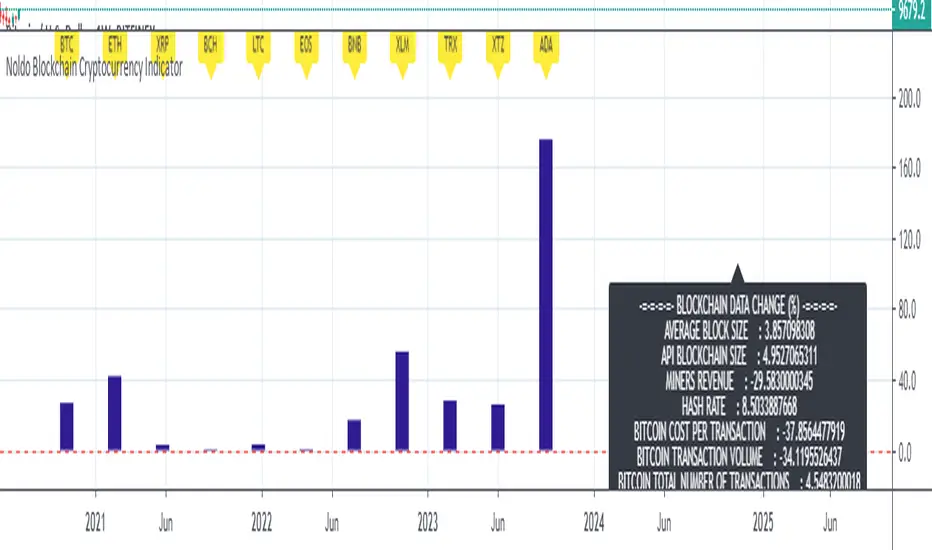
Noldo Blockchain Cryptocurrency Indicator
Hello, this script has the same logic as Noldo CFTC COT Forex Indicator :
And Noldo CFTC COT Commodities Indicator :
*
Script briefly calculates the period length between two signals of Pivot Reversal Strategy when new signal arrives and allows us to see relative Blockchain data and price changes of Major Cryptocurrencies over that automatic length.
This saves us from the hassle and time wasting of searching for a reference point.
Usage
This script works only on all Bitcoin / U.S Dollar pairs and futures.
It only works on 1W graphics.
ICOT data are pulled via Quandl
NOTE :
Since blockchain data is very votalile, 7-day ema values are adjusted to take into account.
Regards.
AMA 2Hi
Here is the 2ed edition of the AMA indicator.
what you would know to know?
AMA indicator based on support and resistance in a different way.
Basically, you have the X line (black color) and when you see candles is over it, then you can go long, and when it's below it you may go short or just close your deal and wait for a better chance to re-enter again.
You see the confirmation signs which helps you to get more signals for the deal.
You find a colored background that is based on the volume that could help you to know where if the traders are buying or selling.
AMA is configured to work with Alerts.
We've added EMA and our special moving average to help you in your decision.
Finally, the indicator is tested and works fine with Binance on 1H, 4H, D and you could change the length to have better results for the daily time frame.

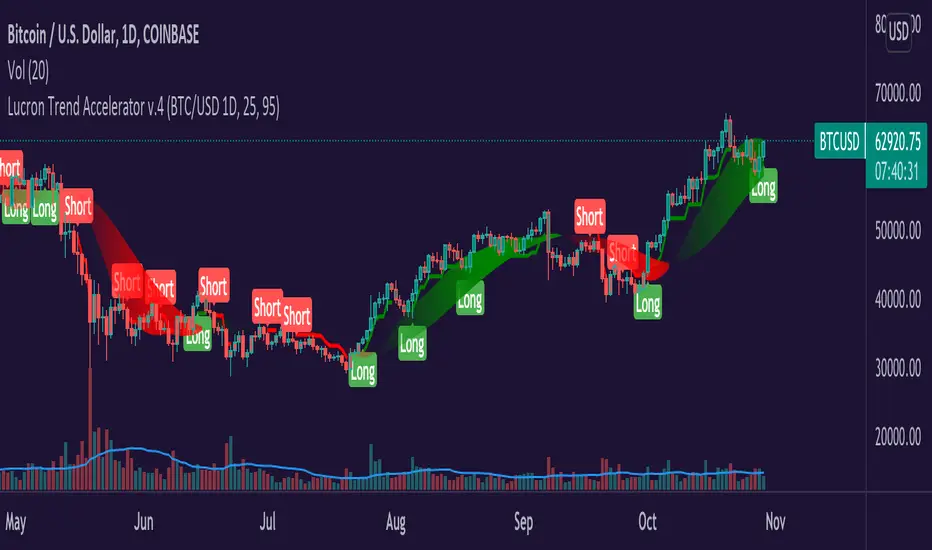
Lucron Trend Accelerator v.4Hey Everyone,
The Lucron Trend Accelerator v.4 is finally available. This indicator is market-specific, which means that it's proprietary code has been tested with best results in the following markets:
BTCUSD - DAILY TIMEFRAME
EURUSD - 1 HOUR TIMEFRAME
This can be applied to any market and any timeframe, but for best results, it's recommended to be used in the above markets. In the future, we are planning to add additional markets.
How it works:
Entry:
The indicator's code identifies emerging bullish and bearish trends. It then displays a "Long" OR "Short" signal on the chart - This marks an entry opportunity.
Position Management:
As the trend continues and your profit increases you will see a ribbon that affirms the direction of the trend. Green for long, and red for short.
Take Profit/ Exit:
Once you have completed the steps above just keep an eye out for a new signal. This signal will inform you of a shifting trend. It will display in the following ways:
A new "Long" Or "Short" signal displayed on your chart
A change in the color of the trend ribbon (from green to red)
If you have implemented a trailing stop, you'll be covered and should capture your profits or limit your risk before the next signal.
If you see any of these signals make sure to take action in order to protect your profits.
You can:
1. Exit the current trade & enter a new trade
2. Take profit on half the position & roll your stop to break even
Takeaways:
As you can now see, our proprietary Lucron Trend Accelerator Trading Tool allows for emotion free trading. It gently guides you by the hand, and shows you how to trade with a proven, calculated, and consistent strategy.
*Disclamer
Any information communicated by Lucron is solely for educational purposes. This is indicator is meant to be used with appropriate risk management and market analysis.
It is not intended to be and should not be interpreted as investment advice or a general recommendation on investment.
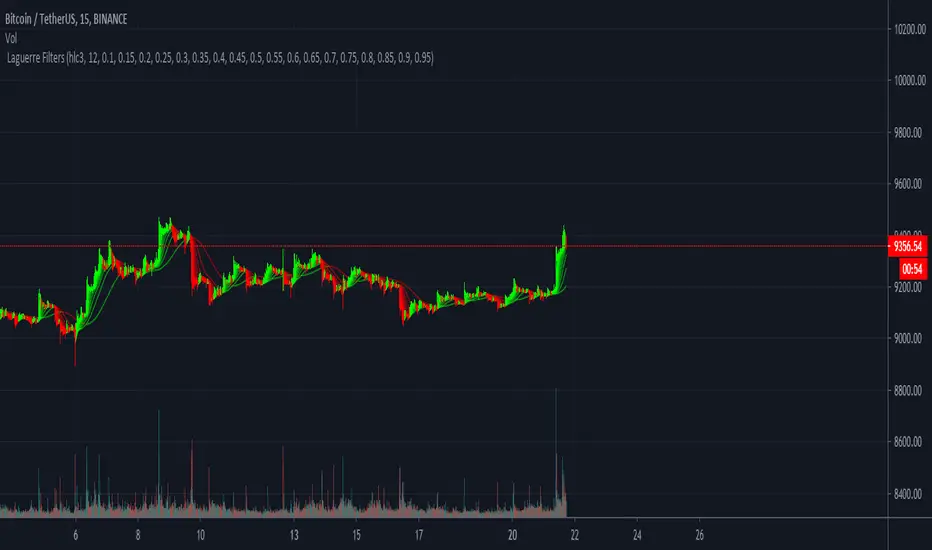
Laguerre Filters Crypto Scalping Tool This is an indicator designed to follow trends on the 15m/30m/1h Timeframe. It works best if you can recognise a larger trend into a direction and combining it then with for example longing the dip. Escpecially for crypto assets this can be used for scalping and if paired with S&R can be an especially powerful tool if paired correctly. Like it is shown here.
As soon as there is a flip to green for example with upwards momentum over the last period of time and no higher Timeframe Resistance ahead. On lower timeframes like the 15m and 30m this can be used for scalping and works especially well in Ranges, say for example a 100 Tick range. At the time of writing we heavily used this Indicator for scalping up and down the current bitcoin range and it worked suprisingly well.
One user was able to trade the EOSUSDT pump, chart shown here.
The cool thing is that the single filters can also be used as a Trailing Stop.
If interested please direct message us. Thank you !
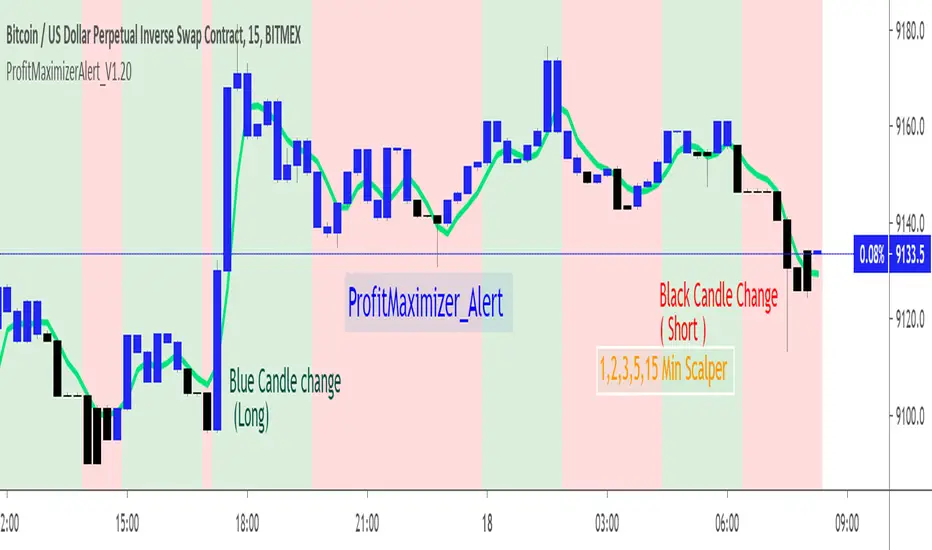
PM_Scalper_AlertsFriends,
Welcome to ProfitMaximizer(PM) Scalper Alert Indicator. This is same Indicator as that published by me on Dec 26, 2018 .
Since the old script was published using "heikin ashi" ,As per recent house rules it was moderated and hidden by Admin.
Based on the discussion with Admin and direction given by them republishing as it is with no change in the code but the chart is now with Real CANDLEs .
This indicator basically uses multiple time-frame and checks the price variation to determine the long and short candles.
On accumulation on good up moving candles the plot is done as Blue color that shows sign for LONG .
On accumulation on good down moving candles the plot is done as Black color that shows sign for SHORT .
Long : Change of Candle from Black to Blue Candle (U can customize color in Styles settings of this indicator)
Short : Change of Candle from Blue to Black Candle.
Alerts : Alerts are inbuilt in this indicator that can be used to get Alerts when the direction of the Candle(Blue to Black,Black to Blue) is getting changed . Financial Market is always risky.Any trade you make based on this indicator and its result is your responsibility.As an author i will be held no responsibility of your trade gain or loss.Be Cautious.
Note : This is scalper indicator and only works only in
1min ,2min, 5min, 15min .
In Higher timeframe the chart wont paint the colors.
Use the JETLINE to detect good entries ,Price above the JET line good for Long,Price Below the JET line good for short.
The Strategy version of this indicator published on 3-Sep-2018 is here for your study and reference.
Find the indicator useful,Share your feedback in comments and appreciate if this is useful.
Note : This chart can be applied for any TV supported charts.Examples Below.Thank you!
ETH Chart : 5min
EURUSD Chart :5min
SPX500 Chart :5min
iqlegendThe iqlegend indicator integrates stocastic information and places overbought and oversold entry points. Trade accordingly when Buy and Sell signals coincide with RED points to sell and Green points to buy.
The best points to enter Sell are above the dashed -30 line and to enter Buy are below the dashed -30 line.
Confirm with the intersection of the stocastics.
When you make your trade, don't forget the correct administration of your capital, use risk units, 6UDR is my recommendation.
I hope this indicator provides you with the business information you need.
PM us to obtein acces.
Kind regards and successes!
********************************************************************
El indicador iqlegend integra información estocastica y ubica puntos de entrada en sobrecompra y sobreventa, Opere en consecuencia cuando coincidan las señales de Buy y Sell con los puntos Rjo para vender y los puntos Verde para comprar.
Los mejores puntos para entrar en Sell están por encima de la linea punteada -30 y para entrar en Buy están por debajo de la linea punteada -30.
Confirme con la intersección de los estocásticos.
Cuando realice su comercio , no olvide la correcta administración de su capital, use unidades de riesgo , 6UDR es mi recomendación.
Espero que este indicador le proporcione la información comercial que usted necesita.
Envíeme un mensaje privado para obtener acceso.
Un cordial saludo y éxitos!

iqlegendThe iqlegend indicator integrates stocastic information and places overbought and oversold entry points. Trade accordingly when Buy and Sell signals coincide with RED points to sell and Green points to buy.
The best points to enter Sell are above the dashed -30 line and to enter Buy are below the dashed -30 line.
Confirm with the intersection of the stocastics.
When you make your trade, do not forget the correct administration of your capital, use risk units, 6UDR is my recommendation.
I hope this indicator provides you with the business information you need.
PM us to obtein acces.
Kind regards and successes!
**********************************************************************
El indicador iqlegend integra información stocastic y ubica puntos de entrada en sobrecompra y sobreventa, Opere en consecuencia cuando coincidan las señales de Buy y Sell con los puntos RED para vender y los puntos Green para comprar.
Los mejores puntos para entrar en Sell estan por encima de la linea punteada -30 y para entrar en Buy estan por debajo de la linea punteada -30.
Confirme con la intersecion de los stocastics.
Cuando realice su comercio , no olvide la correcta administración de su capital, use unidades de riesgo , 6UDR es mi recomendación.
Espero que este indicador le proporcione la información comercial que usted necesita.
Envíeme mensaje privado para obtener acceso.
Un cordial saludo y éxitos!

Crypto BULL signalThis BULL signal will pop up if the EMAs on the chart are looking bullish and the MACD crosses bullish. Of course it will never be a 100% hit rate, please practice good risk management.

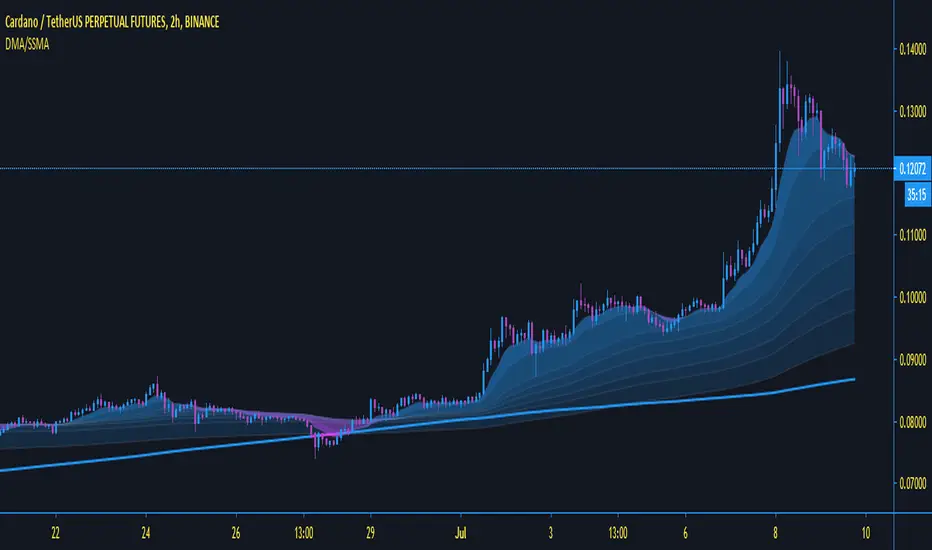
DMA AND SMMA This "on chart" indicator is used purely as a visual sentiment to directional momentum of the pair you are looking at.
it is split into two parts, both of which i will explain below.
1, The SMA (purple and blue fading visual mas) this is used to find the directional momentum
2, the DMA (a slightly delayed Moving Average), is used to decide if the market is in a bullish or bearish move, hence determining whether or not to go long or short.
-only go long when price above DMA, and short, below.
i have found it very good at calling out bad trades, when the direction changes quickly.
same as all my other indicators this is fully adjustable in the settings.
i find, with the standard settings, it works best on the 2 hour timeframe as shown, but again, can be used on any time frame.
For access, send me a DM on TradingView
HFT The Ultimate Trend IndicatorThis is a trend following based strategy developed by HFT Research.
It works on Stocks, Forex and Cryptocurrency markets
This indicator comes fine tuned out of the box. It works on best on 15min, 1 hour and 4 hour time frames. It provides 3 separate entries for each of the time frames, providing you 12 different entry options.
Each time frame has the following options to choose from
You can use 1 hour settings on 15min chart however, it may not work the best.
Moderate entry will give you the modest amount of trades with modest amount of risk
Aggressive entry will give you wild entries and lots of action, if you are willing to babysit the trades, it might be an option for you
Conservative entry are best for those who want to automate the strategy or for those that don't have the time to trade the alerts actively

Custom TF MoneyFlow Crypto -- TradingSargentcompletely adjustable Money flow indicator - adjust to look at other time frames to save time flicking through the charts.
Using as a standard oscilator, when the MFI plot reaches the bottom, giving a buy signal, and visa versa, at the top..
adjustable length, but i find "14" is best, on the 15minute and 2 hour time frames

Crypto Trend Following StudyThis is the study script indicator of Crypto Trend Following Strategy which can be used to automate your trading by alerts. With study script indicator, strategy can be easily automated.
To get access to the study script indicator please contact me directly by personal message.
To back test the strategy, see Crypto Trend Following Strategy indicator.
Script is using several moving averages to keep you on the right side of the trend. Signals are also filtered based on other indicators to prevent buying already overbought or selling already oversold coins and avoid ranging markets.
MAIN GOAL
Main goal of the strategy is long-term stable profit. No strategy has 100% accuracy therefore there always will be some false signals. But patience pays, with Trend Following Strategy, you will get couple of small loses while waiting to get big wins when coin is trending strongly. As you never know the right time you must sustain and be in all trades to make sure that you will not miss the big move.
BACKTEST
This script is for free to play with so you can back test and see for yourself how the strategy performs on any of your favourite coins.
Strategy is optimized and back tested for USDT and BTC pairs on 6h timeframe but it can be used on any pair and any timeframe.
RISK & REWARD
Strategy does not use safety orders as DCAs usually leads to bag holding sooner or later. It does not use take profit either as strategy will tell you when to buy and when to sell based on the actual market condition.
You should always use stop loss to protect your account from drawdown or even being liquidated.
You can change stop loss or take profit as you like or even back test the strategy with your preferred settings to find what suits you best.
STUDY SETTINGS
Important: Make sure that you use the same settings for both Strategy and Study indicators.
If you need any help with settings do not hesitate to ask. I would also appreciate any feedback and ideas how to improve the script.
==== Indicators settings ====
RSI Long < and StochRSI Long <
• used to filter out buy signals of already overbought coins - ( stoch ) RSI must be under set value to fire a BUY signal
RSI Short > and StochRSI Short >
• used to filter out sell signals of already oversold coins - ( stoch ) RSI must be over set value to fire a SELL signal
ADX >
• used to filter out buy or sell signals in ranging markets - ADX must be over set value to fire a BUY or SELL signal
MA Fast and Slow Length
• Two moving averages to indicate an actual short-term trend
Baseline Length & Type
• Baseline is a moving average which confirms the longer-term trend. You can set length and type of the moving average
Show every signal
• turn on to see signal on each candle whether strategy recommends opening long or short trade (green triangle – buy, red triangle – sell, no triangle – wait)

Tether Market Cap - {Cross-Exchange} Tether Market Cap Indicator
Keep track of tether movements cross exchange & total market cap in real-time.
Never miss a movement in the Tether market.
How it works
Starts by selecting the security "CRYPTOCAP:USDT" with, period, close,
The script will then call on each exchange listed to get the usdt_supply from each exchange.
It will then print the data to the indicator as such:
Yellow = Total Tether Market Cap
Orange = Kraken Supply USDT
Red = Poloniex Supply USDT
Green = Bitfinex Supply USDT

Crypto Margin Trading ConsensusThis is an indicator of the consensus of traders in the crypto market. It examines the number of short and long positions on several currencies (BTC, ETH, XRP, LTC, XMR, EOS and others) on each bar.
Sometimes traders are in consensus and they are right (enter long and the currencies rise, or enter the short and the currencies decrease) other times, although they are in consensus, it can happen that the market behaves exactly the opposite. Some signals are good, some are not (as with any other indicator, unfortunately).
Because it uses data about multiple currencies, it is a market breadth indicator - it does not refer to One currency, but to several important currencies in the crypto market, simultaneously (calculates based on information about several currencies). That's why it loads SLOWLY - it can take up to 60 seconds to appear.
If a multi-currency trader bar goes LONG (meaning they agree that it should be long), it displays a green upward-facing arrow, otherwise, if there is a consensus that it should be short, it displays a downward arrow.
I hope it will be of some use to you

PpSignal OSCILLATORThe Ppsignal oscillator is calculated based on LWMA and smoothed with the elder formula to avoid trending noise.
Each asset has its settings so you should go looking for the best set yourself.
Buy when the oscillator is yellow Sell when it is red.

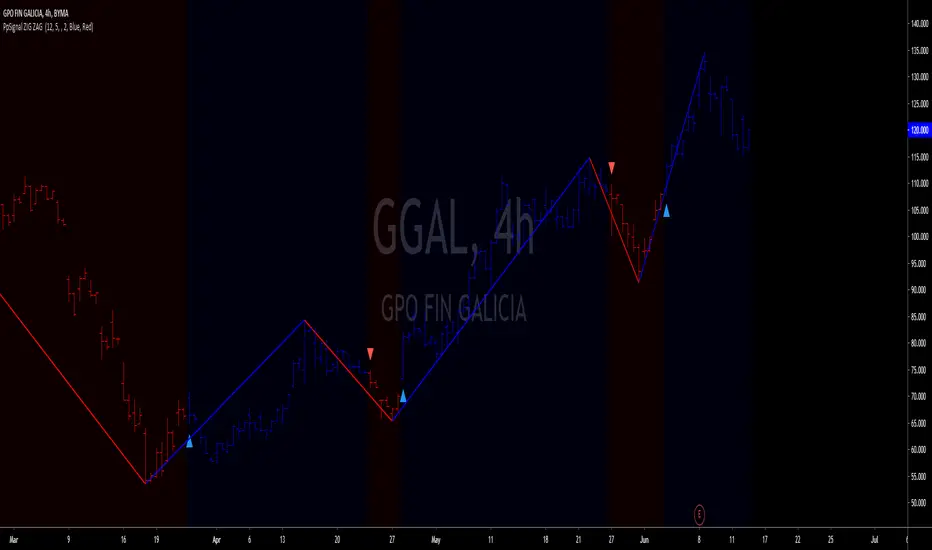
PpSigan ZigZag++The Zig Zag indicator plots points on the chart whenever prices reverse by a percentage greater than a pre-chosen variable. Straight lines are then drawn, connecting these points. The indicator is used to help identify price trends. It eliminates random price fluctuations and attempts to show trend changes. Zig Zag lines only appear when there is a price movement between a swing high and a swing low that is greater than a specified percentage; often 5%. By filtering minor price movements, the indicator makes trends easier to spot in all time frames.
Buy when the price is blue or green choose your favorite up color and arrow is up.
sell when the price is red or orange choose your favorite up color and arrow is up.
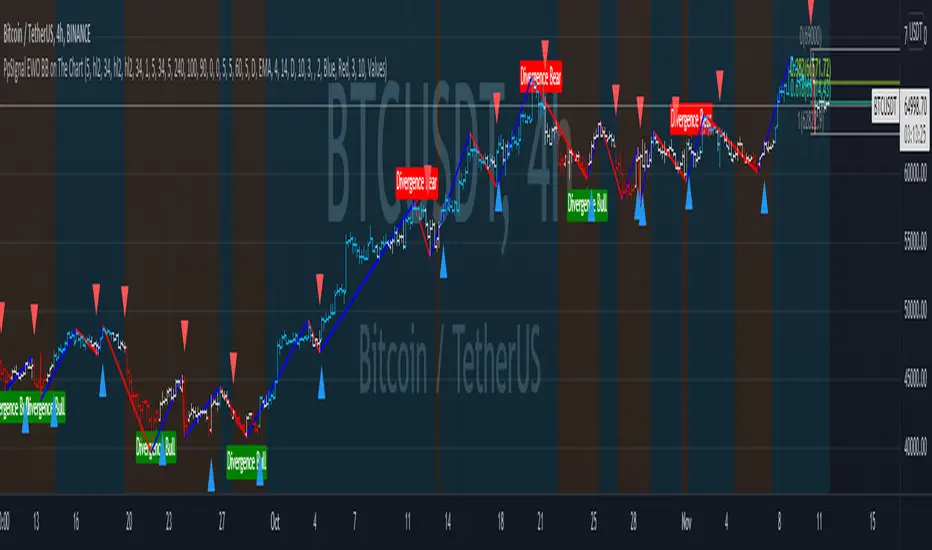
PpSIgnal EWO BB on The ChartThis gauge is the band break Ewo, or rather known as the advance get the mechanical trader ewo.
Buy when the back and the candles are painted blue, if you activate see ewo on the chart buy when the candles are above the upper band.
Sell when the back is selling and the candles are painted red or if the ewo is on the chart sell when the candle is below the band.
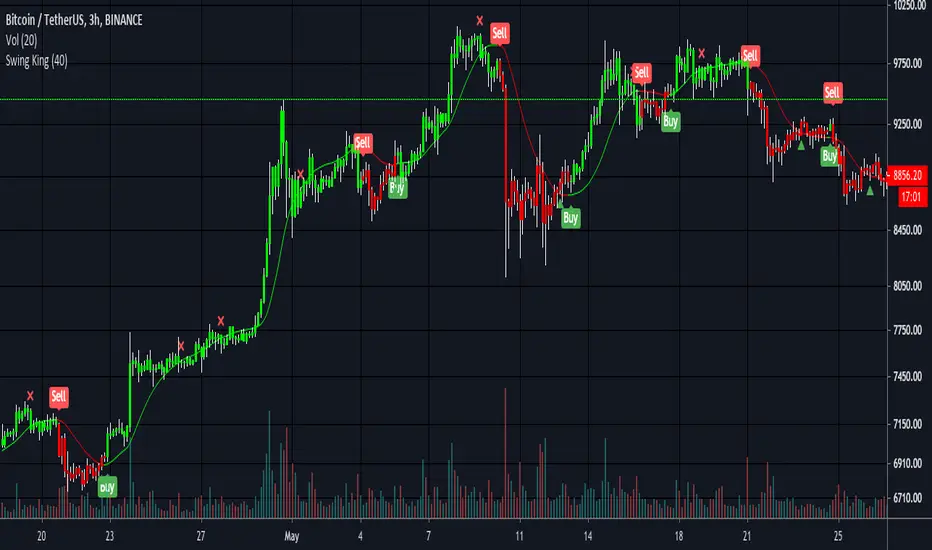
Swing King v1Utilising short and medium term trends, Swing King is perfect for riding the crypto waves. Built with the aim of smashing Bitcoin’s buy and hold return. After 5 months (Jan 2020 to May 2020) of testing and tweaking, Swing King is ready for release.
Setup with default Bitcoin settings, Swing King returned 289% in the 5 months of testing compared to buy and hold return of 29%. That’s by longing and shorting 100% of equity at 1x leverage.
Results of 5 months of testing:
1 bitcoin → 3.02 bitcoin
$7,340usd → $28,589usd
Backtesting on Ethereum had similar results. In 6 months it turned 10 eth into 14.5 eth and doubled the bitcoin value - compared to a buy and hold value of 31%.
These results were achieved with:
- Using 0.2% fees and slippage for worst case scenario
- Not using Heiken Ashi candles to fake backtest results
- No stop loss and 30% long take profit
Expect to be in trades for days and keep your losses small while letting the winners run.
Also includes trend weakening signals for manual take profit zones (cross is bullish trend weakening and triangle is bearish trend weakening) and colour coded barcolours to keep trading simple.
Green = all signals met to long
Red = all signals met to short
DM for access and pricing. Places will be limited.