OJLJ Elliott Waves DetectorThis script is made to identify Elliot Waves by setting a zigzag line as principal source, it identifies patterns with the most common rules, in the chart you will see a number in each wave detected, a wave could have the characteristics to be two different waves so it will be plotted the options that could be, To identify which one is most trustable I suggest to use the Fibonacci levels options.
Features:
+ All waves ? (Option to show just the 5 Wave patterns recognition)
+ Draw zigzag line (Option to show the zigzag line)
+ Supports Multiple instruments, from FOREX to Stocks
+ It works on all the timeframes
+ Show Fib levels (Option to show the Fibonacci levels)
+ Fibonacci levels fit test (Green crosses mark were should a Bull wave be to fit with a Fibonacci Level While the purple crosses show were should the wave fit to be a bear trend, the more closer with the point of the wave the most trustable Example, a 5 Wave Bull could also be a 2 Bear Wave, if the green cross is closer to the orange point of the wave then is a 5 Wave Bull, if the purple cross is closer to the orange point)
+ A background color also show when a 5 pattern is identified
+ The way to plot the zigzag can be changed with 3 Input options
Characteristics to add in future updates:
+ Detect more than 1 cycle at the same time
+ Use a volume indicator to identify how many volume was traded in each wave
+ Implement the use of the EWO (Elliot Wave Oscillator)
+ Improve the display
+ Identify ABC patterns
+ Add triangles and Zigzag formations
To have access to this script please send me a message ;D
Detector

Day Trade Pattern DetectorThis script will draw on your chart signs after detecting the following patterns:
1/2/3
Hammer
Shooting Star
Bullish Engulfing
Bearish Engulfing
And before that he will filter them by common technical rules

Double Top Chart Pattern detector with alert
Double top is a very common chart pattern, as its name indicates, it consists of two tops, and these two tops need to be in a relative flat price level. One of the top can't be much higher or lower than the other.
This indicator will detect and highlight double top pattern automatically on chart and alert you via SMS, email and sound.
Features:
Adjust the threshold between two tops.
Adjust the number of bars used to form each top.
Check if the first top is the highest in a given number of bars
Adjust the number of bars between two tops.
Switch of alert.
A detailed instruction will show you how to properly adjust each input.
It works on all timeframes and any symbol.
You can also load more than one with different inputs to get more results on chart.

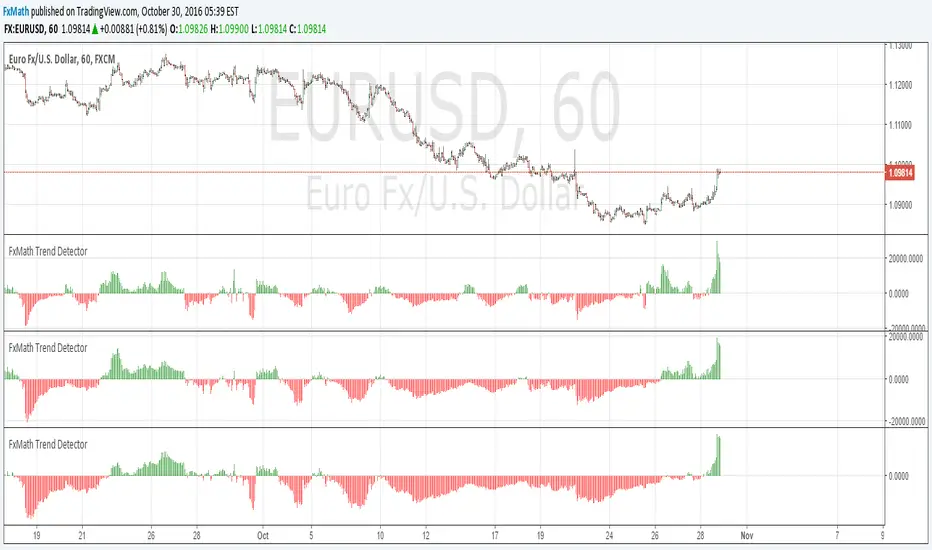
FxMath Trend DetectorFxMath Trend Detector is very simple indicator according RSI & CCI . For better observation is better to use indicator with 3 period 50,100,150 and if in all periods color is match you can go for buy or sell.
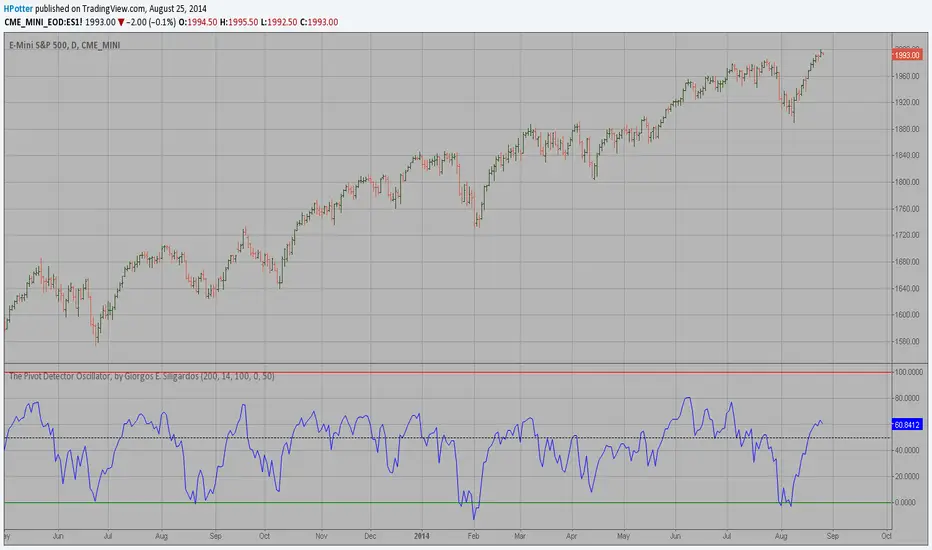
Pivot Detector Oscillator, by Giorgos E. Siligardos The Pivot Detector Oscillator, by Giorgos E. Siligardos
The related article is copyrighted material from Stocks & Commodities 2009 Sep