AJ Scalp Reversal Tops and Bottoms IndicatorReuploaded after TV took it down.
A free scalping reversal, top and bottom indicator. It prints signals in real time, and should be used for scalping.
Following candle will usually always follow the signal but from there closer management is required.
This script uses RSI, Volume, OBV, Pivots and a few more indicators to calculate the signals.
Use alongside other indicators and price action analysis for best results.
Only use on time frames above 1H, otherwise the signals fire too frequently.
*These signals are different compared to other scripts created by me
Расхождение

Better Trader Super PredictThis is a free trading assistant that combines 4 types of trading signals and useful tools.
Four types of trading signals:
1. Trending signals. KAMA and Awesome oscillator(5,34) and (3,25) are used to confirm trend.
2. Knifes. This is a SOT detector with volume and spread filtering. The algorythm takes into account the volatility.
3. Predict. The distance from VWAP and BB stdev 2 and 3 is used. Signals usually appear when RSI/MACD/AO divergence is detected.
4. High risk signals. These are SOT and high volume signals without hard filtering.
All signals use distance from SMMA and volatility.
Filters use LL and HH events.
Each signals has entry zone, recommended stop-loss and a number of take-profits.
Recommended entry points and usually located in the body of higher timeframe candles.
Recommended stop-loss zones are using ATR(10) with multiplier that depends on the timeframe.
Take-profit points and arranged within daily and week levels using pivots and VWAP.
The useful tools are:
- Autofibo
- Ichimoku clouds
- VWAP
Disclaimer:
Your trading is fully your responsibility.
Sell and Buy markers are not a financial advice.
Do not take too much risk.
Almost all signals are NOT repainted. There some rare trend signals that can be repainted.

Baekdoo compressed multi EMA box and its crossover indicatorHi forks,
I'm trader Baekdoosan who trading Equity from South Korea. This Baekdoo compressed multi EMA box and its crossover indicator tells us good trading time for swing trading.
Here is the idea. As you can see formula, I put ema of 5 days to 100 days.
and draw box when all disparity of the EMAs are less than 5%
I put those value in input variable as 105 (100 means same as max/min disparity ratio, 105 means max is 5% greater than min). This can be used 110 (10% of box) based on your needs.
Once box are drew, I put indicator when it crossover the box with 5 times larger than 60 days' highest volume. Then I put triangle indicator. This will be good trading point for short-mid term trading. you can check historical chart to evaluate this.
Hope this will help your trading on equity as well as crypto. I didn't try it on futures . Best of luck all of you. Gazua~!

Inverse Divergence [HeWhoMustNotBeNamed]Experimental.
In regular scenario divergence calculation follows these procedure
Pivots on price are considered as primary source
They are compared with pivots on oscillators
Trend bias of price is used
This is an experimental version where
Pivots on oscillators are considered as primary source
They are compared with pivots on price
Trend bias of oscillator is used. Using percentrank to define oscillator trend
Caution: Not meant for trading :)

CryptoGraph MA DivergenceCryptoGraph MA Divergence is a multifunctional trading tool that identifies aspects of trend trading.
The indicator is based on moving averages, transformed into an oscillator. This way it becomes possible to get a better visualisation of MA's relative to each other, and more importantly, it enables us to spot divergences based on MA's.
This simply yet effective enhancement wasn't seen before as an oscillator, so I decided to make and share it.
Features of the indicator:
- Blue/Purple wave (Based on Moving Averages)
- White line (Average of Blue/Purple Wave)
- Green/Red Dots (Trend reversals)
- Red/Green lines (Wider red and green lines are regular divergences, thinner red and green lines are hidden divergences)
What to look for?
- A red or green dot may be a very early indication of a trend reversal, in times of consolidation they cluster together. Use other CryptoGraph indicators to filter these dot clusters.
- Blue/Purple wave crossing 0 line.
- Divergences. Divergences are automatically spotted in the indicator. HOWEVER, always try to find them manually, since the indicator won't be able to spot them all automatically.
For access contact me through TradingView or Discord.

MACD Performance - TradingEDThis case study is based on a previous MACD study, but with three different counts to compare different trends. The use of this indicator is restricted to private use, and it can be used only by invitation. Different functionalities have been added to the original code, such as alerts and signals that seek to make trading much easier to interpret by any type of trading operator of any experience level , from beginner to intermediate and advanced .
Key components of the original indicator:
● The Moving Average Convergence Divergence ( MACD ) is calculated by subtracting a long period (26) Exponential Moving Average ( EMA ) from a short (12) period EMA .
● MACD triggers technical signals when it crosses above (to buy) or below (to sell) its signal line.
● The speed of crossovers is also taken as a signal of a market is overbought or oversold.
● MACD helps traders to understand whether the bullish or bearish movement in the price is strengthening or weakening.
It is a momentum indicator that follows the trend and shows the relationship between two moving averages of the price of a security. It can function as a trigger for buy and sell signals, when you cross above (to buy) or below (to sell) your signal line. It helps to understand if the movement is bullish or bearish , if it is getting stronger or weaker. The further the MACD is above or below its baseline, it indicates that the distance between the two EMAs will be growing, often shown with a histogram that graphically represents the distance between the MACD and its signal line, and It is used to identify when the bullish or bearish momentum.
Main functions of this modified indicator:
1) You can select the type of MOVING AVERAGE, among many available options ( SMA , EMA , DEMA , HMA , etc.)
2) The SOURCES for the counts can be determined by the trader (close, open, etc).
3) The MEASURE can be based on a CANDLES count if you are trading OHLC Charts from 1D onwards, or if your trading is intraday, you can also select counts by MINUTES, HOURS or DAYS, depending on your trading style.
4) LENGTH, by default it will be loaded as in the STRATEGY, but considering the previous point, you can modify it according to your convenience.
5) You have the option to hide or show the HISTOGRAM or even the MACD if you want to see one of them.
6) You have the option to hide or show a LABEL at the top of the chart, with respect to the signals: BULLISH green, BEARISH red.
Main performance functions of this modified indicator:
I) In the case of the PERFORMANCE that appears at the right of the chart, you have the option to adjust the WIDTH of each box.
II) The TEXT of the PERFORMANCE is not modifiable, but you can customize the default color. *
III) The BACKGROUND of the PERFORMANCE, you can customize the default color. *
IV) You have the option to hide or show a PERFORMANCE that appears at the right of the chart.
Main functions to customize the style of this indicator:
a) You can select the colors for the FAST LENGTH, SLOW LENGTH AND HISTOGRAM with the colors that best suit you. * **
b) For any type of SIGNAL, it is painted as a VERTICAL LINE in the graph, you can change the color that comes by default. *
c) In the case of the LABELS that appear at the top, the text is not modifiable, but you can customize both the type of label and change the default color. *
d) You can select the colors for the BACKGROUND of the indicator according to the trend, whether it is BEARISH or BULLISH, with the colors that best suit you. *
e) You can select the color for the ZERO LEVEL, with the colors that best suit you.
* By default, they are marked as red for downtrends and green for uptrends.
** By default, they are marked as orange for downtrends and blue for uptrends.

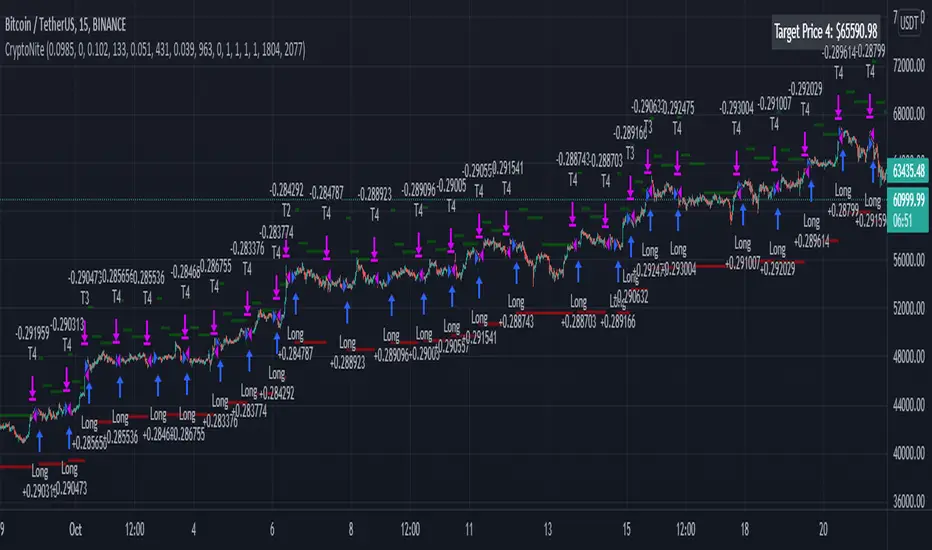
CryptoNite - Machine Learning Strategy (15Min Timeframe)Greeting Traders! I am back with another ML strategy. :D I kept my word with combining my machine learning algorithms from Python and integrating them into Tradingview. Thanks to Tradingview's new release of Pinescript v5 it is now possible. This strategy respects the Sortino Ratio and was created using 2 years of data for 50 different cryptocurrencies. That is a total of 100 years of data and 44,849 trades to create this strategy. Now let me tell you, my computer and I are exhausted. We both been at it non-stop for about two months everyday. I refine the strategy, and the computer runs 24/7 for a few days to spit out the best results into the terminal. It's been a good run so my computer will finally get some sleep tonight.
So let's talk a little about the features of the strategy. In the settings window, you'll see the Stoploss, Take Profit Parameters, and Date Range. You can change the Date Range, but I recommend to leave the SL/TP parameters how they are because the machine learning algo chose those input. If you wish to change them you are always welcome to do so but backtest results will change. For the Take Profit parameters you'll see on the left side you something labeled time duration(displayed in minutes) and on the right side you'll see take profit values. Let's talk a little bit how they work.
TP_values = {
"0": 0.102,
"133": 0.051,
"431": 0.039,
"963": 0
}
In python, the table looks like this but it is quite easy to understand in Tradingview.
From 0-133 minutes, the strategy is looking to the reach target point 1 at 10.2% profit.
From 133-431 minutes, the strategy is looking to the reach target point 2 at 5.1% profit.
From 431-963 minutes, the strategy is looking to the reach target point 3 at 3.9% profit.
From 963+ minutes, the strategy is looking to break even at 0% profit on target point 4.
Through each target point a sell trigger is active. It will look for the best time to sell even if TP has not been reached.
This helps the trade not stay open too long.
The last thing I need to mention is the textbox displayed on the right side of your chart. This textbox displays the current Take Profit value in dollar amount. So when you're in a trade you'll know what TP target has to be reached when the open trade is active. Throughout time, the target price changes depending how long the trade has been open. If you have any questions feel free to comment down below, and enjoy this strategy!
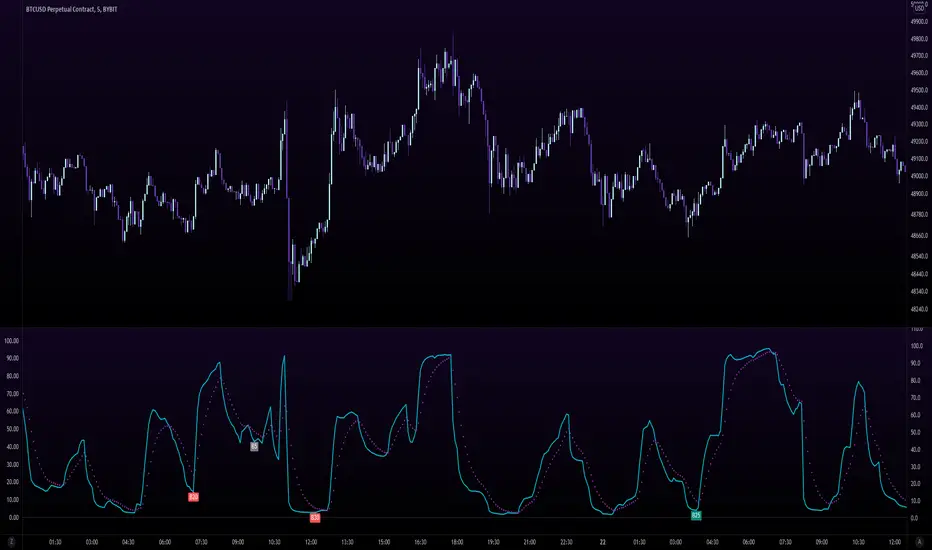
Binary ComboThis script combines Stochastic Divergence and WaveTrend Crosses.
Stochastic Divergence may be useful for seeing a shift in momentum before the price action reflects it.
WaveTrend gives us context to the short term trend.
You can combine these together to find good entries.

RSI Linear Regression with ZigZag by zdmreBoth the RSI (Relative Strength Index) and the Linear Regression ( LR ) rank among the most popular momentum indicators used in trading. When used in combination with other technical indicators (ZigZag), both RSI, LR and ZigZag can offer value in validating trade opportunities to optimize your risk management practices.
Here’s a look at how to use RSI, LR and ZigZag (Can be used for divergence patterns.) as part of your trade analysis.
If you have new ideas to improve this indicator then let me know please.
***Use it at your own risk

MTF DPO-RSI IndicatorThis indicator uses the principle of taking the RSI of DPO readings across multiple time frames in order to provide trade signals and an overarching view of market conditions to the trader. My hope with creating this indicator was to present more divergence based signals than your typical indicator, while still keeping those signals at a high quality.
In the settings menu, you may specify:
Indicator Timeframe - the chart resolution that is used to calculate values.
Source DPO Length - the number of bars used to calculate the Detrended Price Oscillator value. The DPO value is the source for the RSI calculations.
DPO Hull Smoothing - how much smoothing is applied to the DPO . Smoothing is accomplished by taking a Hull Moving Average of the closing price, and using this to calculate the DPO value.
RSI Length - the number of bars used to calculate the RSI of the DPO value.
Time Multipliers 1 through 6 - use this to define what resolution each plot will represent. A value of 1 will represent the current Indicator Timeframe. A value of 3 will represent 3 times the current Indicator Timeframe, etc.
Show Plot 1 through 6 - toggles the display of plots.
How I trade with this indicator:
A value of under 30 represents an over sold state for that particular plot. A value of over 70 represents an overbought state for that plot.
Identify divergences on a lower timeframe plot which are apparent in overbought or oversold conditions, and confirm the signal with an overbought or oversold condition, or a divergence on a higher timeframe plot. Divergences which begin in oversold or overbought territory and end inside the 30-70 range tend to be more reliable signals, in my experience. Like all indicators, this is best when used in conjunction with other indicators. Trend indicators, such as double EMA's and Supertrend are my favorite pairing, and a stochastic RSI is a good tool to have as well.
This is my first published indicator! If you find unique ways to use it, drop me a message. I'd love to know what you find. :)

Ultimate Bullish Divergence for RSI MFI RVSI OBV w/ Buy SignalsThis strategy is based on the Indicator below and includes all of its features.
This version Includes the Strategy tester and a dynamic SL
The only drawdown of this version is that Alerts are not as customizable
Ultimate Bullish Divergence for RSI OBV RVSI MFI w/ Buy Alerts

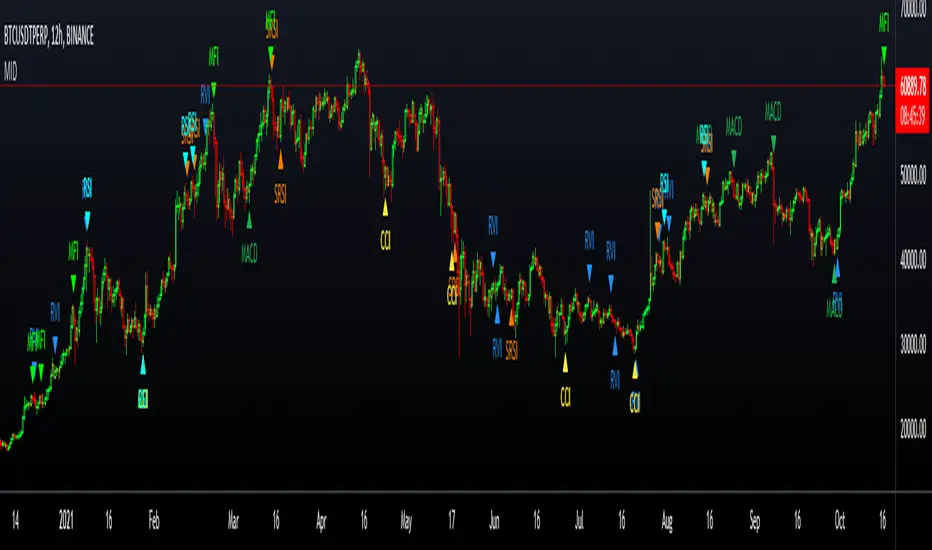
Ultimate Bullish Divergence for RSI OBV RVSI MFI w/ Buy AlertsThis Indicator detects Divergence based on multiple Pivot points instead of just one.
- You can detect divergence on these Oscillators:
- RSI, RVSI, MFI, TRIX RSI, OBV and more soon
You can detect bullish and hidden bullish divergence:
- bullish divergence: Oscillator makes a higher low while price is making a lower low
- hidden bullish divergence: Oscillator makes a lower low while price is making a higher low
ranges where it should look for Divergence:
- To reduce false positives you are able to define and combine the following ranges:
- Manual Ranges: you’re able to type in the ranges that you came up with your manual technical analysis
- Auto Fib Ranges: option to only look for divergence below/above/within multiple Fibonacci levels
- Oversold limit: option to only look for divergence below a certain Oscillator Level
- EMA Ranges: Only look for divergence if below/above/within certain EMA's
- VWAP Ranges: option to only look for divergence below/above/within VWAP levels
Multiple options of waiting for confirmation:
- Waiting for X candle closes
- Wait for a price bounce
- Wait for an Oscillator to Oscillator EMA cross
- Wait for EMA cross (coming soon)
Divergence-Support/ResistenceAnother script based on zigzag, divergence, and to yield support and resistence levels.
This idea started with below two concepts:
▶ Support and resistence are simply levels where price has rejected to go further down or up. Usually, we can derive this based on pivots. But, if we start looking at every pivot, there will be many of them and may be confusing to understand which one to consider.
▶ Lot of people asked about one of my previous script on divergence detector on how to use it. I believe divergence should be considered as area of support and resistence because, they only amount to temporary weakness in momentum and nothing more. As per my understanding
Trend > Hidden Divergence > Divergence > Oscillator Levels of Overbought and Oversold
⬜ Process
▶ Now combining the above two concepts - what we are trying to do here is draw support resistence lines only on pivots which has observed either divergence or hidden divergence. Continuation and indecision pivots are ignored.
▶ Input requires only few parameters.
Zigzag lengths and oscillator to be used. Oscillator periods are automatically calculated based on zigzag length. Hence no other information required. You can also chose custom oscillator via external source.
▶ Display include horizontal lines of support/resistence which are drawn from the candle from where divergence or hidden divergence is detected.
▶ Support resistence lines are colored based on divergence. Green shades for bullish divergence and bullish hidden divergence whereas red shades for bearish divervence and bearish hidden divergence. Please note, red and green lines does not mean they only provide resistence or support. Any lines which are below the price should be treated as support and any line which are above the price should be treated as resistence.
▶ Divergence symbols are also printed on the bar from where divergence/hidden divergence is detected.
↗ - Bullish Hidden Divergence
↘ - Bearish Hidden Divergence
⤴ - Bullish Divergence
⤵ - Bearish Divergence
▶ Script also demonstrates usage of libraries effectively. I have used following libraries in this code.
import HeWhoMustNotBeNamed/ zigzag /2 as zg
import HeWhoMustNotBeNamed/enhanced_ta/8 as eta
import HeWhoMustNotBeNamed/ supertrend /4 as st
Can be good combination to use it with harmonic patterns.

Volume Price Trend with Divergence and Pivot Points The volume price trend indicator is used to determine the balance between a security’s demand and supply. The percentage change in the share price trend shows the relative supply or demand of a particular security, while volume indicates the force behind the trend. The VPT indicator is similar to the on-balance volume (OBV) indicator in that it measures cumulative volume and provides traders with information about a security’s money flow.
This is Volume Price Trend or VPT recalculated to be an Oscillator, a Divergence hunter was added, also Pivot Points and Alerts.
VPT is considered a "leading indicator" - in contrast to a "lagging indicator" just as Moving Averages it does not show a confirmation what already happened, but it shows what can happen in the future. For example: The chart is climbing while the VPT oscillator is slowly declining, gets weaker and weaker, maybe even prints bearish divergences? That means that a reversal might be occurring soon. Leading indicators are best paired with Stop and Resistance Lines, general Trendlines , Fib Retracements etc...Your chart is approaching a very important Resistance Trendline but the VPT shows a very positive signal? That means there is a high probability that the Resistance is going to be pushed though and becomes Support in the future.
What are those circles?
-These are Divergences. Red for Regular-Bearish. Orange for Hidden-Bearish. Green for Regular-Bullish. Aqua for Hidden-Bullish.
What are those triangles?
- These are Pivots . They show when the VPT oscillator might reverse, this is important to know because many times the price action follows this move.
Please keep in mind that this indicator is a tool and not a strategy, do not blindly trade signals, do your own research first! Use this indicator in conjunction with other indicators to get multiple confirmations.

Multi Indicator DivergenceSpotting Divergences using multiple indicators.
This multi divergence indicator does not repaint until the bar closes.
It does not use offset as well.
I might create another private version of this indicator including the option to make an alert if there are interested.
Enjoy and trade at your own risk!
Happy Trading!!!
CDC DivergencesA handy little indicator to help identify different kinds of convergences/divergences
The indicator compares price movements with the momentum and volume movements, Hidden divergences are left out, at least in the first version, because I wanted this indicator to be as simple as possible.
The divergences are shown with labels, user can change the momentum/volume indicator used to identify divergences in the settings.

Vision Essentials - MACDVision Essentials - MACD is the second indicator in our Essentials pack. It's a fully customizable MACD indicator with some extra perks the Vision team feels provides helpful & simplified insight when studying a chart.
What makes this indicator different?
Under the Standard mode you'll feel right at home compared to a standard macd indicator. Our Advanced mode is where things change a bit more. Under Advanced mode outside of the visual customization we provide visual outputs identifying bullish/bearish crossovers of the macd & signal, and track the high and low points of the macd with a second set of colors which users can customize. We also plot text in these areas so there's a clear indication of what the changing colors mean.
How do I use this indicator?
To start, it's best you have an understanding of what MACD (moving average convergence divergence) is. There are lots of great educational ideas here on TradingView which we recommend absorbing. We highly recommend you start with this article directly from the TradingView Help Center
Settings
MACD Mode - Standard provides you with a closer to traditional style MACD whereas Advanced at a glance highlights areas such as crossover points, highs, lows, and current direction relative to histogram movement.
MACD Settings - Select the source & values used for the macd calculations. close is the most commonly used source, and 12/26/9 are the most common length values. Adjust these to see how the indicator behaves. Lowering the fast and slow values will result in more activity, but be aware that doesn't = more accuracy.
Standard Visual Settings - STANDARD MODE: These settings will adjust the color you want to use as an indication of bullish & bearish movement.
Advanced Visual Settings - ADVANCED MODE: Use these settings to adjust the color you want to use as an indication of bullish, bearish, recent macd highs, recent macd lows, and text color.
High/Low Distance - ADVANCED MODE: This setting defines how far back the indicator looks to find the most recent highs/lows of macd.
Enable Crossover Bars - ADVANCED MODE: This settings enables the vertical bars that connect the center of the histogram to the macd/signal "wave" to indicate where crossovers are happening.

RSI Overbought Oversold Divergence Strategy w/ Buy/Sell SignalsThis indicator is a copy of my RSI Overbought/Oversold Divergence Indicator with-Alerts
Only difference is that the alerts are disabled, instead it uses tradingviews strategy tester signals
If you want alerts just use the other indicator

RSI Overbought Divergence Indicator with AlertsThis indicator alerts you only if there are divergences after price was oversold or overbought

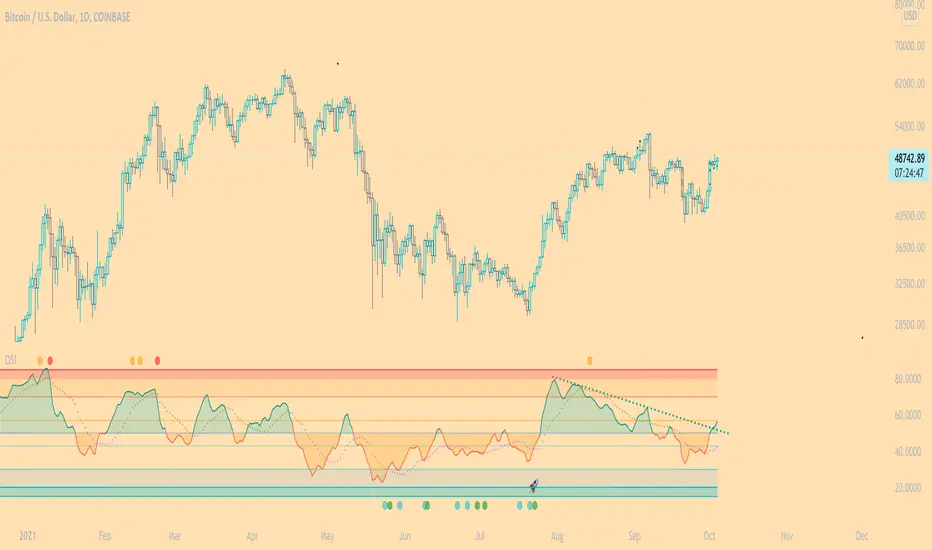
DSI - Dynamic Strength Index The DSI is a volume weighted momentum indicator similar but superior to the traditional RSI.
The DSI algorithm takes values for RSI, MFI, OBV and stochastics, then gives them each a different weighting depending on their historic reliability in different market conditions, and then averages out the values.
This results in a very reliable, noise-free momentum indicator, especially reliable on high timeframes.
Further features include:
Auto Trendlines - Up-downtrend lines to show support, resistance and breakouts
Supertrend- A momentum (ATR based) version of the Supertrend.
Divergences - Bullish and bearish momentum divergences, with confirmation signals.
General Rules:
Bullish above 50
Bearish below 50
Enjoy!
MM
True Strength Index Histogram [Futures Market]This is a modified version of True Strength Index to fit the scalping trading style in futures market

RSI OBLIVION This is a powerful tool if combined with other parameters. It's an advanced version of an RSI .
It shows OB and OS conditions and price direction or shift of the trend.
This indicator can be used in various ways with all markets.
The current settings are designed to work with futures market.
Combined with our TSI and Price action, RSI OBLIVION is the most reliable KPI out there.
Reached out to us for assistance.

On-chart Wavetrend Divergence with PivotsThis is an OnChart WaveTrend Divergence Indicator with Pivots and Alerts
LazyBears WaveTrend Indicator or also known as "Market Cipher" is an Indicator that is based on Moving Averages, therefore its an "lagging indicator". Lagging indicators are best used in combination with leading indicators. In this script the "leading indicator" component are Daily, Weekly or Monthly Pivots. These Pivots can be used as dynamic Support and Resistance, Stoploss, Take Profit etc.
This indicator combination is best used in larger timeframes. For lower timeframes you might need to change settings to your liking.
What are those circles?
-These are the WaveTrend Divergences. Red for Regular-Bearish. Orange for Hidden-Bearish. Green for Regular-Bullish. Aqua for Hidden-Bullish.
Please keep in mind that this indicator is a tool and not a strategy, do not blindly trade signals, do your own research first! Use this indicator in conjunction with other indicators to get multiple confirmations.
