MA CloudMA Cloud - a highly configurable cloud for Moving Averages
Creates a cloud from max. 5 Moving Averages.
Users can freely decide, for each average wether it should be SMA,EMA or WMA and also for the time period.
They shades and colors can be freely chose for each combination of MA's, giving you a maximum freedom to configure your cloud.
Экспоненциальное скользящее среднее (EMA)

Moving Average Ribbon [TheBearFighter]
This code was written using:
•Pine Script Coding Conventions.
This script provides a very useful tool for new community users and professionals. It puts at your disposal a Moving Average Ribbon by hand to graph and easily find the ones with the highest performance. The creation of this script was motivated because in free TradingView accounts there is a limit of 3 indicators by chart, and with this tool you can draw up to 32 MA's at the same time!
Choose one of 10 types of MA´s:
•KAMA Kaufman's moving average.
•HULL Hull moving average.
•TEMA Triple exponencial moving average.
•LSMA Least square moving average.
•DEMA Double exponencial moving average.
•ALMA Arnaud Legoux moving average.
•WMA Weighted moving average
•EMA Exponencial moving average.
•VWMA Volume Weighted moving average.
•SMA Simple moving average.
Use the tooltips to know the lengths of MA´s.
A main characteristic of the script is that the lengths are in days but when changing the lowest timeframes, the same daily resolution is maintained. This gives us extreme precision in intraday timeframes, e.g 30 minutes.
Once this is understood, we can turning the MA´s on/off, and changing the timeframe to our liking.
Available timeframes: M, W, D, 4H, 1H, 30m, 15m, 5m.
Also the MA´s are colored for easy visualization and know if they grow or decrease.
Thank´s to @midtownsk8rguy to let me know more about HEX colors.
Thank´s to @HPotter for his KAMA.

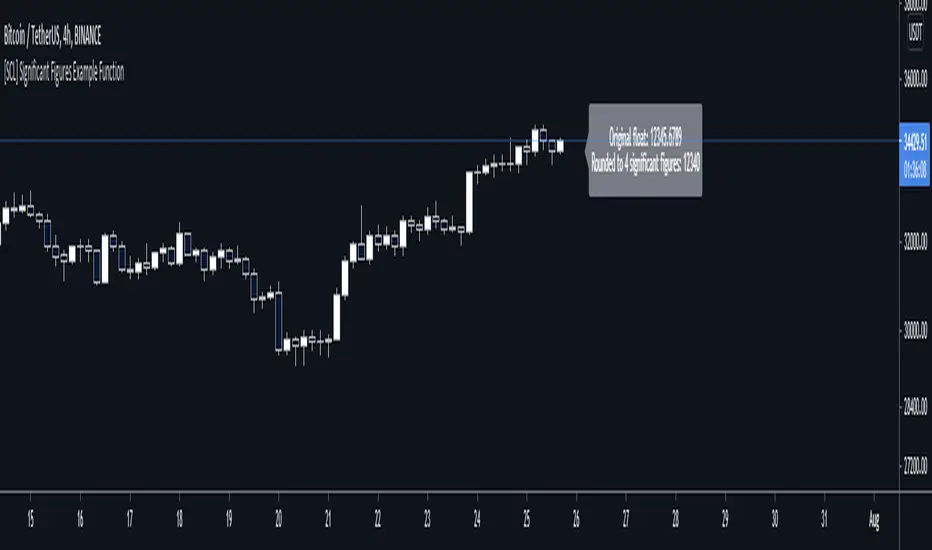
[SCL] Significant Figures Example FunctionThis script consist of a single example function that takes a floating-point number - one that can, but doesn't have to, include a decimal point - and converts it to a floating-point number with only a certain number of significant digits left.
I'm not aware of another script that does this. There might well be a simpler way, in which case please do let me know.
For example, say you want to display a variable from your script to the user and it comes out to something like 45.366666666666666666666667 or whatever. That looks awful when you, for example, print it in a label.
Now, you could round it up to the nearest integer easily using a built-in function, or even to a certain number of decimal places using a reasonably simple custom function.
But that's a bit arbitrary. Suppose you don't know what asset the script will be used on, and so you can't predict what the price is, and what the value will turn out to be.
It could be 0.00045366666666666666666666667 instead. Now if you round it up to 3 decimal places it comes out as 0.000, which is useless.
My function will round that number to 0.0004536 instead, if told to do it to 4 significant digits.
You're free to use this function in your own scripts, including closed-source scripts, without asking permission. Credit to @SimpleCryptoLife would be appreciated.
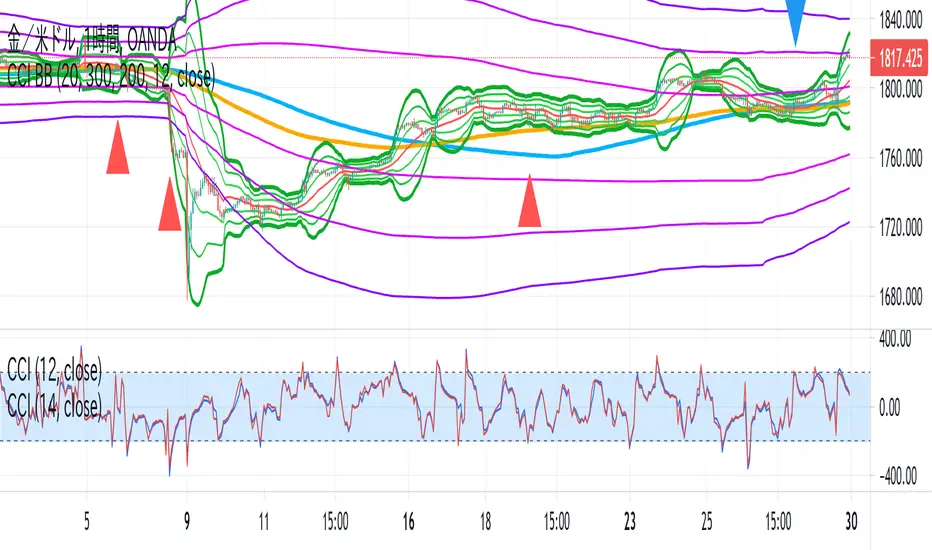
CCI BBThis indicator is the idea of giorno_4_16 .
It shows some indicator lines in your main chart as following:
SMA300, EMA200
BB 20 1,2,3sigma and middle
BB 300 1,2,3sigma and middle
You should put CCI (12, 14) into your separated chart to use the idea.
It shows arrows for registance trading when:
CCI(12) crossovers -200 or corssunders 200 in recent 6bars,
and the price crosses indicator line of SMA200, EMA200 and BB300 1,2,3sigma.
When CCI crossovers -200, you can condisider buying.
When CCI crossunders 200, you can condisider selling.
You should use this indicator in 1H or 4H.
When an arrow appears in 1H, change timeframe to 4H and check the slope of BB20.
If the slope is gentle, take-profit target is MA20 of 1H.
If the slope is steep(ex. CCI crossovers -200 and 4H BB20 go up steeply), take-profit target is BB20 2sigma of 1H.
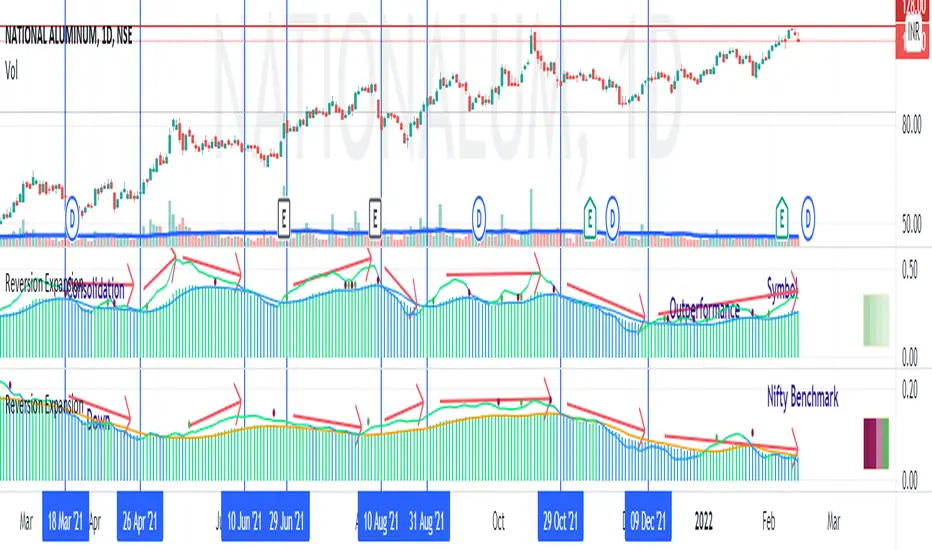
Price - Mean Reversion ExpansionA simple indicator, to plot the quantitatively the reversion and expansion of price from a set of means.
A green bar plots prices above the set of means. A bar plots prices below the set of means. A blue bar plots price entangled in the means. The height of the bars denotes the far-ness from the set of means.
A blue envelope over the bars is the average of this reversion/expansion. A "crossover" of any bar (red/green) over this envelope is indicated by a "green dot" a "crossunder" of any bar (red/green) under this envelope is indicated by a "red dot".
The small trend strength table (when enabled) on the right side below show in a easy manner the data presented in the " Mean Angles " indicator. Refer to description there for more details.
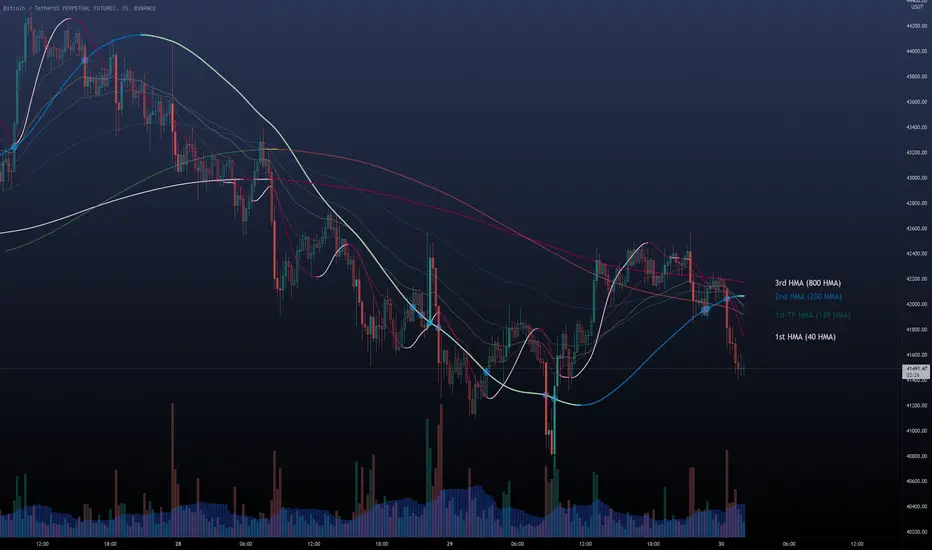
Multi HMA Lines by NB(ENG)
The Hull Moving Average (HMA) line responds quickly to volatile markets,
sometimes it provides more accurate information than the Exponancital Moving Average (EMA).
In particular, the 200 HMA line is easy to decide the overall trend of the market,
and it serves the basis entry position.
So I made indicator that provides these HMA lines into various periods so that they can be checked in one.
In addition, a custom TimeFrame HMA line function has been added so that you can check
not only the TimeFrame that meets your trading standards, but also the HMA of the other TimeFrame that you custome sets.
For example, if you want to see the 200 HMA of the 60-minute bar, you can select and set the different TimeFrame in the Multi TF section below.
For reference, 200 HMA at the 15-minute bar is the same value as 50 HMA at the 1-hour bar, so as shown in the following chart,
I use 4 HMA lines at the 15-minute bar : 20 HMA, 50 HMA, 200 HMA, and 200 HMA from 60-minute TimeFrame.
We hope it will help you in your trading. :)
(KOR)
HMA(Hull Moving Average) 라인은 변동성이 심한 시장에 빠르게 반응하며,
때때로 EMA(Exponancital Moving Average)보다 더 정확한 정보를 제공하곤 합니다.
특히 200HMA 라인은 시장의 전반적인 추세를 판단하기에 용이하며,
큰 틀에서의 포지션 진입 근거의 기반이 됩니다.
이러한 HMA 라인을 다양한 기간으로 나누어 하나의 지표에서 확인 할 수 있도록 만들어 보았습니다.
아울러, 자신의 매매 기준에 맞는 타임 프레임은 물론, 다른 타임 프레임의 HMA도 확인 할 수 있도록
커스텀 타임 프레임 HMA 라인 기능을 추가로 넣었습니다.
예를 들어, 15분 타임 프레임이 본인 매매 기준표이지만, 60분 봉의 200 HMA도 보고 싶다면
밑의 Multi TF 항목에서 해당 타임 프레임을 선택 후 설정하시면 됩니다.
참고로 15분 봉에서의 200 HMA은 1시간 봉에서의 50 HMA과 동일한 값이므로 저는 다음 차트 그림과 같이
15분 봉에서 20 HMA, 50 HMA, 200 HMA, 그리고 1시간 봉에서 200 HMA 이렇게 4개의 라인을 참고 하고 있습니다.
여러분 거래에 도움이 되기를 바랍니다. :)
Mean AnglesThis indicator plots the trend of the angles made by the chosen means. This trend when analysed over multiple timeframes as well as different lengths can give an indication of the trend in short medium and long term.
For example, in any particular timeframe, when the 20 EMA turns a negative arctan, it signifies that on a shorter timeframe (than the current timeframe) is turning downwards in price. When 50, 100 and 200 EMA turn negative, it confirms the trend reversal. Similarly the 20 EMA will be the first one to turn "Up" or positive to indicate a possible trend reversal on the upside.
The angle of the means will oscillate between +pi/2 and -pi/2.
0 means - EMA is flat
+pi/2 means - almost vertical price rise
-pi/2 means - almost vertical price fall
Between -pi/2 and 0 means EMA is sloped downwards. Moving from -pi/2 to 0 means EMA slope is turning up. Moving from 0 to -pi/2 means EMA slope is falling down even lower and faster.
Between 0 and +pi/2 means EMA is slopped upwards. Moving from +pi/2 to 0 means EMA slope is falling down. Moving from 0 to +pi/2 means EMA slope is turning up even higher and faster.

Tocorin_MTF_MA7 MAs (SMA or EMA) can be displayed in each period.
MTF display is performed only at 5m, 1h, and 4h.
The upper MAs to be displayed are as follows
5m: 1h, 4h, and 1D
1h: 4h and 1D
4h: 1D
The MA line style is stepline and circles to make it easier to see.
You can change it in the settings as you wish.
--
各時間足で 7本の MA(SMA or EMA) 表示が可能です。
5m, 1h, 4h の時だけ MTF 表示を行います。
表示する上位 MA は下記の通り
5m: 1h と 4h と 1D
1h: 4h と 1D
4h: 1D
見やすくするためにMA の線のスタイルを stepline と circles にしています。
設定で任意に変更してください。

Natural Moving Average [CC]The Natural Moving Average was created by Jim Sloman (Ocean Theory pgs 63-70) and this is the one of the best moving averages you will find! This is one of the most adaptive moving averages that I have ever seen that accounts for all types of volatility. I have included a default value of 40 for the length so you can see just how close this moving average sticks to the underlying price movements. Feel free to try out your own lengths to see what you like best. I have included strong buy and sell signals in addition to normal ones so darker colors mean strong signals and lighter colors mean normal ones. Buy when the line turns green and sell when it turns red.
Let me know if there are any other scripts you would like to see me publish!

HYE Mean Reversion VWAPIndicator version of the strategy "HYE Mean Reversion VWAP"
"Long", "Short", "Exit Long" and "Exit Short" alarms added.
Use with "Once Per Bar Close".
*** I used the "VWAP with period" indicator code of @neolao. Special thanks to @neolao.
Indicator Link:

HYE Mean Reversion SMAIndicator version of the strategy "HYE Mean Reversion SMA "
"Long", "Short", "Exit Long" and "Exit Short" alarms added.
Use with "Once Per Bar Close".

Market Swiss KnifeSimple script, helpful to analyse the current conditions of the market and make your own decisions. It's not a signal indicator
* Shows an EMA to help you identify the trend
* Uses the ATR to plot two lines below (current low + ATR) and above (current high - ATR) the current candle. Useful to see whether the market is overextended or find possible targets
* Plots a vertical line showing NY, Tokyo and London session opens
* Includes a position size calculator to calculate your desired lot size (works in forex and gold)
RSI band with Signal alert//th/en
//th
สวัสดีครับท่านสมาชิก
ก่อนอื่นต้องขอเกริ่นก่อนเลยว่า Indicator ตัวนี้ถูกสร้างขึ้นมาบนพื้นฐานของ RSI จริง เพียงแต่ใช้ค่า EMA27 ในการสร้าง เนื่องจากผมยังไม่สามารถเขียน RSI band ที่โยงกับราคาได้ในส่วนนี้เองได้
แต่ทั้งนี้ขอให้ท่านใจเย็น ๆ และฟังผมสักหน่อย เนื่องจากก่อนหน้านี้ผมได้สังเกตเห็นว่า EMA27 นั้นมีค่าเท่ากับ RSI14 ที่ค่า 50 พอดี ดังนั้นผมจึงเลือกที่จะสร้างมันขึ้นมาด้วย EMA27 เพราะง่ายต่อการเขียน
วิธีการใช้งานมีดังต่อไปนี้
Indicator ตัวนี้ใช้งานเหมือน RSI14 วิธีการอ่านคือให้นับเส้น EMA27 เป็นค่า 50 ของ RSI14 ดังนั้นให้เราพิจารณาการซื้อขายดังต่อไปนี้ (โดยหลังจากนี้ผมจะเรียก EMA27 ที่สร้างขึ้นว่า RSI band)
พิจารณาเข้าซื้อ : เมื่อราคาทะลุ RSI band ขึ้นไปและย่อตัวทำ Higher Low เหนือเส้น RSI band
พิจารณาขายออก : เมื่อราคาทะลุ RSI band ลงมาและรีบาวน์ทำ Lower High ใต้เส้น RSI band
# ทั้งนี้ผมได้ทำสีแท่งเทียนไว้เพื่อให้ง่ายต่อการสังเกต โดยการนำไปใช้อาจนำสีของเส้นขอบแท่งเทียนออก แล้วในส่วนของไส้แท่งเทียนให้ใช้สีที่ไม่เจาะจงราคาบวกลบอย่างสี #434651
โดยเราสามารถดู Divergence โดยการเทียบความต่างระหว่างราคาและ RSI band ได้ดังนี้
ในแนวโน้มขาลง : ให้เปรียบเทียบความต่างระหว่างราคากับ RSI band ของ Lower Low ปัจจุบันกับ Low ก่อนหน้า โดยถ้าความต่างของ Low ลดลงเรื่อย ๆ จนราคาเข้าใกล้เส้น RSI band ให้พิจารณาเข้าซื้อ
ในแนวโน้มขาขึ้น : ให้เปรียบเทียบความต่างระหว่างราคากับ RSI band ของ Higher High ปัจจุบันกับ High ก่อนหน้า โดยถ้าความต่างของ High ดลงเรื่อย ๆ จนราคาเข้าใกล้เส้น RSI band ให้พิจารณาขายออก
ทั้งนี้ผมได้สร้าง Signal alert ไว้เพื่อให้ง่ายต่อการสังเกต โดยสร้างมาจากเงื่อนไขดังนี้ (ห้ามทำการซื้อขายตาม Signal alert เด็ดขาด เพราะเค้าแค่บอกจุดตามเงื่อนไขที่ตั้งไว้ บางทีอาจมีสัญญาณซื้อแล้วให้ซื้อต่อโดยไม่มีสัญญาณขายเลยก็ได้)
Buy : เมื่อ RSI14 ตัดขึ้นที่ค่า 50 พร้อมกับ RSI14 ตัดขึ้น Signal ที่ผมตั้งไว้ (ผมใช้ EMA7 ของ RSI14)
Prepare to Sell : เมื่อ RSI14 ตัดลง Signal ในขณะที่ RSI14 นั้น มีค่ามากกว่า 70
Sell/Short Top : เมื่อ RSI14 ตัดลงที่ค่า 70 พร้อมกับ RSI14 ตัดลง Signal (จะมีขึ้นแสดงว่า Peak ในกราฟ)
Buy : เมื่อ RSI14 ตัดลงที่ค่า 50 พร้อมกับ RSI14 ตัดลง Signal
Prepare to Buy : เมื่อ RSI14 ตัดขึ้น Signal ในขณะที่ RSI14 นั้น มีค่าน้อยกว่า 30
TP Short/Buy Bottom : เมื่อ RSI14 ตัดขึ้นที่ค่า 30 พร้อมกับ RSI14 ตัดขึ้น Signal (จะมีขึ้นแสดงว่า Deep ในกราฟ)
# สาเหตุที่ใส่ข้อความใน Signal alert เพียงแค่ตอน Sell/Short Top และ TP Short/Buy Bottom เพื่อลดโอกาสเกิดการแพนิคที่เกิดจากการสังเกตได้ โดยในสัญญาณตัวอื่นจะมีแค่เครื่องหมาย * เพียงอย่างเดียว
ขอให้โชคดีครับ
Firstssk
////////////////////////////////////////////////////////////////////////////////////////////////////////////////////////////////////////////////////////////////////////////////////
//en (Google Translate)
Hello, Trader
First of all, I have to say that this indicator is built on the basis of a real RSI, just using the EMA27 value to create it, since I still can't write an RSI band that is tied to the price in this section.
But please be patient and listen to me a bit. Since I previously noticed that EMA27 is exactly equal to RSI14 at 50, so I chose to build it with EMA27 because it's easier to write.
Here's how to use it:
This indicator works like RSI14. The reading method is to count the EMA27 line as the 50 value of RSI14, so let's consider the following trading. (After this I will call the created EMA27 RSI band)
Consider buying : When the price breaks the RSI band up and makes a Higher low above the RSI band.
Consider selling : When the price breaks the RSI band down and rebounds to make a Lower high below the RSI band.
# However, I have colored the candlesticks to make them easier to spot. By applying it may remove the color of the candlestick border. Then for the wick part, use a color that does not specify the price plus and minus color #434651
We can see the divergence by comparing the difference between the price and the RSI band as follows.
In a downtrend : Compare the difference between the price and the RSI band of the current Lower Low and the previous Low. If the divergence of the Low continues to decrease until the price approaches the RSI band, consider buying.
In an uptrend : Compare the price difference between the RSI band of the current Higher High and the previous high. If the divergence of the High continues to decrease until the price approaches the RSI band, consider selling.
I have created a Signal alert for easy observation. It was created from the following conditions: (Do not trade according to Signal alert strictly because they just tell the point according to the conditions set There may be a buy signal and then buy again without a sell signal.)
Buy : When RSI14 crosses above 50 with RSI14 crosses up the signal I set (I use EMA7 of RSI14).
Prepare to Sell : When RSI14 crosses signal while RSI14 is greater than 70.
Sell/Short Top : When RSI14 crosses down at 70 with RSI14 crosses down Signal (it will show "Peak" on the chart)
Buy : When RSI14 crosses down to 50 with RSI14 crosses down signal.
Prepare to Buy : When RSI14 crosses signal while RSI14 is less than 30.
TP Short/Buy Bottom : When RSI14 crosses above 30 with RSI14 crosses up signal (it will show "Deep" in the chart).
# The reason why I put the message in Signal alert only at Sell/Short Top and TP Short/Buy Bottom to reduce the chance of panic occurring from observation. In other signals, there will only be a * sign.
Good luck.
Firstssk

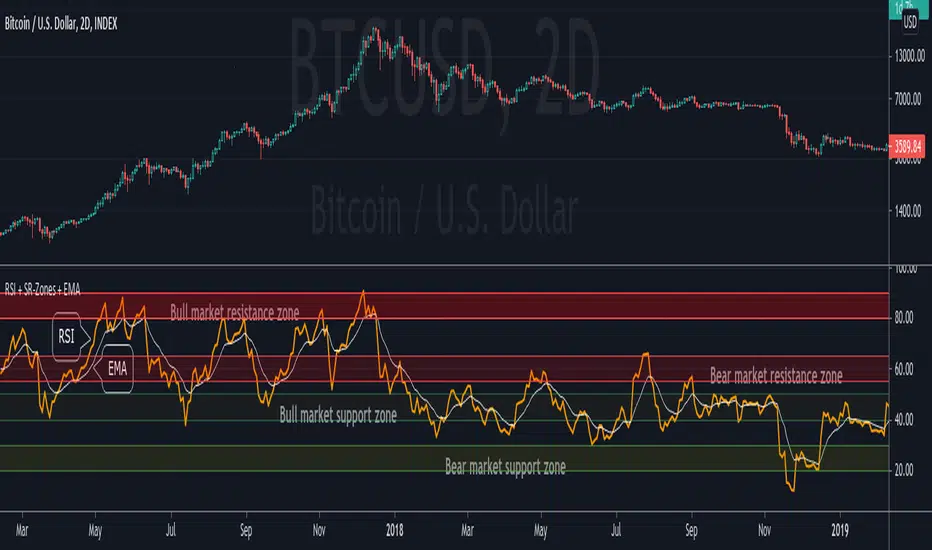
RSI + Support/Resistance Zones + EMAThis indicator enhances the RSI with support and resistance zones and an EMA.
RSI: a regular RSI (default: orange / 14 period)
EMA: an EMA on the RSI (default: light gray / 10 period)
RSI support/resistance zones
SR-Zones for bull markets: In a bull market the price tends to find resistance between 80 and 90 and support between 40 and 50 RSI.
SR-Zones for bear markets: In a bear market the price tends to find resistance between 55 and 65 and support between 20 and 30 RSI.
The concept of these support and resistance zones has been popularized by Constance Brown in her book Technical Analysis for the Trading Professional . The SR zones are described in the first chapter which is available in the preview section on Amazon.
RSI-EMA
The EMA on the RSI can also be used as support and resistance. For example, you can be use it for a simple strategy such as the following: In an uptrend after a significant correction during which the RSI has been below the EMA for some time, wait for the RSI to cross above the EMA to go long and exit (partially) after the RSI crossed down the EMA.
Hint: All visual elements (RSI, EMA, support zones) can be enabled/disabled and adjusted individually.
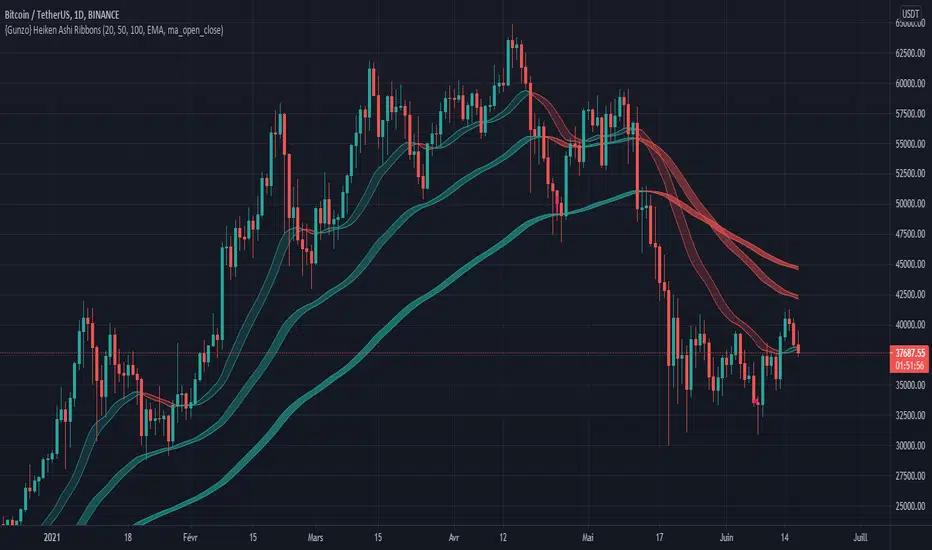
{Gunzo} Heiken Ashi RibbonsHeiken Ashi Ribbons is a trend-following indicator which gives entry and exit points for short-term, medium-term and long term trading (using Exponential Moving Averages and Heiken Ashi formulas).
OVERVIEW :
The Heiken Ashi Ribbons indicator is composed of 3 moving average ribbons (slow, normal and fast) that are computed using the Heiken Ashi formulas. The 3 ribbons give a clear vision of the current trend as they use moving averages that smooth out the price and filter noise from short term fluctuations. In a simplified way, you can consider each ribbon as a moving average with a larger body size.
If the price is above the slow ribbon, we consider the asset as trending up in the short term (trending down otherwise). If the price is above the fast ribbon, we consider the asset as trending up in the long term (trending down otherwise).
CALCULATION :
First of all, to compute a ribbon for this indicator we calculate a moving average (EMA by default) for common sources (OHLC) :
EMA (open), EMA (high), EMA (low), EMA (close)
We then apply the Heiken Ashi formulas to the moving averages calculated previously.
HA (open) = HA (open) previous + HA (close) previous
HA (close) = ( EMA (open) + EMA (high) + EMA (low) + EMA (close) ) / 4
HA (high) = max( EMA (open), EMA (close), EMA (high) )
HA (low) = min ( EMA (open), EMA (close), EMA (low) )
The ribbon displayed (by default) on the chart is the area between HA (open) and HA (close).
SETTINGS :
1st Moving average length : Length of the slow moving average
2nd Moving average length : Length of the normal moving average
3rd Moving average length : Length of the fast moving average
Moving average method : Moving average calculation method (EMA : Exponential Moving Average, SMA : Simple Moving Average, WMA : Weighted Moving Average)
Ribbon type : standard ribbon uses the area between HA (open) and HA (close). Large ribbon uses the area between HA (low) and HA (high)
Display ribbon as candles : change the type of visualization between area and candles
Display short term buy/sell signals : Display short term buy/sell signals (crosses) when the fast moving average and normal moving average are crossing
Display long term buy/sell signals : Display long buy/sell signals (circles) when the fast moving average and slow moving average are crossing
Display ribbon trending up signals : Display ribbon direction change (triangle up) when the trend of the ribbon changes to trending up
Display ribbon trending down signals : Display ribbon direction change (triangle down) when the trend of the ribbon changes to trending down
VISUALIZATIONS :
This indicator has 2 possible visualizations :
Ribbons : the ribbons can be considered as enhanced moving averages for trading purposes. They represent the area between the Heiken Ashi of the moving average of the open and closing price. The color of the moving average line is green when the ribbon is trending up and red when the ribbon is trending down.
Signals : Various signals can be displayed at the bottom of the chart (Buy/Sell signals, Ribbon direction changes signals).
USAGE :
This indicator can be used in many strategies, just like when you are using multiple moving averages. You should test these strategies and use the one that best fits your trading style.
Strategy based on crossovers :
When the fast ribbon crosses above the normal ribbon, it is a short term buy signal (it is recommended to wait for a confirmation)
When the fast ribbon crosses under the normal ribbon, it is a short term sell signal (it is recommended to wait for a confirmation)
When the fast ribbon crosses above the slow ribbon, it is a long term buy signal
When the fast ribbon crosses over the slow ribbon, it is a long term buy signal
Strategy based on price position :
When the prices closes above the ribbon, it is a buy signal (long term if above slow ribbon, short term if above fast ribbon)
When the prices closes below the ribbon, it is a sell signal (long term if below slow ribbon, short term if below fast ribbon)
Strategy based on price bouncing :
When the price decreases and reaches the green long term ribbon, the price candles may not be able to cross the ribbon. If the price increases, we consider that move as a bounce on the ribbon, which is a buy signal
When the price increases and reaches a red long term ribbon, the price candles may not be able to cross the ribbon. If the price decreases, we consider that move as a bounce on the ribbon, which is a sell signal
Strategy based on ribbon direction :
When the direction of the ribbon changes, the trend of the asset is changing which may lead to a crossover to the next candles if the trend is continuing in that direction (it is recommended to validate the entry points with a second indicator as this strategy may have some false signals).
Tipsy EMA Tipsy EMA
v0.2a
Coded by vaidab.
A simple strategy to buy dips in an uptrend.
How to use:
- buy on trend when price retraces to the orange "buy" line and compound orders
- sell when price reaches red line (stop loss) or at 💰 (take profit)
Note that you can reverse trade on the 💰 sign for a short scalp / day trade.
Uptrend: green/red background. Danger zone: orange bg. No go zone: no bg.
Potential buys (in a clear trend): 55, 100, 200 EMA touches and
fibo retracements to .382 and .618.
Potential stop loss: when price breaks the 200 EMA (marked by a red line).
Exit signs: opposite trend divergences (RSI).
Take profit: EMA 55 crossing down EMA 100.
Use it in confluence with market structure. E.g. If 200 EMA ligns up with
past market structure, if there are whole numbers or if there's a monthly level.
Tested BTCUSDT D, 4H

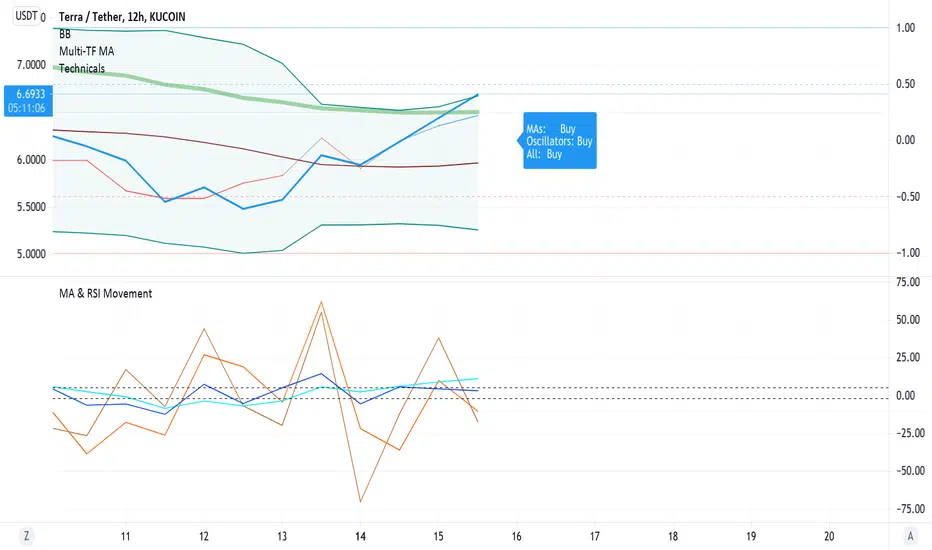
Barholle eMA and RSI Movement TestThis is a test that offers insight into whether and asset is heading into bullish or bearish territory.
This indicator/test offers insight into the Exponential Moving Average's velocity and acceleration as well as the Stochastic RSI's velocity, acceleration and jerk. Included is a 'Stochastic Difference' and 'Stochastic Growth' indicators (commented out) that measure the difference between K and D in the Stoch RSI as well as the rate of it's change. This test is all about crossovers - the best leading indicator is a downward cross of the eMA velocity over the eMA acceleration, indicating a drop in price in the current or next bar.
The lines or importance have been set to -2 and 5, but these should be adjusted to suit your preferences. These numbers were chosen in order to try and create some kind of threshold after which action might be suggested. Backtesting is highly recommended so you can see how the test does and does not work. It is super powerful, but it is not omniscient - its an RSI and eMA derivative, past success does not necessarily dictate future success.
Please look at the code for several more plots you can use of derivatives and other ideas explore but commented out for greater legibility of the graph. Commenting and commenting (or uncommenting all and just disabling some in the settings) and comparing the graphs and crossovers is a useful exercise. To that end, one last concept - the MARSI - a combined moving averages and RSI measurement - was abandoned because it didn't appear to indicate anything of use, however you may find crossovers or patterns with it comparing it to other graphs, so it was left in but commented.
Please take a look at the comments and all the math and indicators 'left on the cutting room floor' in the script. Maybe you'll find a gem in the redux version of this script.
Outreach regarding the script, patterns noticed and full-on stealing of the script are all permitted. Many elements of this script were nabbed from other scripts - thank you to a community of coders who put it all out there.
[francrypto® strategy] 4 EMAs, P.SAR & Vol.Prof. (by kv4coins)(ENG)
This script consists of my own strategy for cryptocurrency (but can be adapted very well for stocks, forex, etc.)
Is a combination of:
- Four Exponentials Moving Average (EMA), configurables: by defect are 10, 21, 55 and 200 periods in yellow, aqua, orange and blue each of them
- Parabolic SAR System (PSAR), configurable
- Volume Profile (that has been developed by kv4coins - he has already authorized me to use it under the same OSS Licence Terms: MPL 2.0), configurable: with another default values and bilingual support for Spanish (SPA)
How it works
1) It is always better to detect specifics candlesticks or patrons: doji , pinbar or inverted pinbar , engulfing bars , morning star or evening star , harami , twizzer bottom or top , etc.
2) The 10 and 21 periods EMA help to identify the short-term behavior
3) The 55 periods EMA can be used like a support or resistance in medium-term, as 200 periods EMA in very long-term
4) It will convenient search for a double cross (10 & 21) or a triple cross (10, 21 & 55) to determine the medium-term change Downtrend to UpTrend (or viceversa)
5) Confirm the change patron with the Parabolic SAR and then identify potencials purchases or sales
6) Use Volume profile to detect potential supports or resistances areas, in order to set stop limit/loss and take profit orders.
Hope this helps!
Cheers,
FRANCRYPTO®
–––––– 0 ––––––
(ESP)
Este script consiste en mi propia estrategia para criptomonedas (pero puede adaptarse muy bien para acciones, forex, etc.)
Es la combinación de:
1) Cuatro Medias Móviles Exponenciales (EMA), configurables: por defecto son de 10, 21, 55 y 200 períodos en amarillo, turquesa, naranja y azul cada una de ellas
2) Sistema Parabolic SAR (PSAR), configurable
3) Perfil de Volumen (que fuera desarrollado por kv4coins - que ya me ha autorizado a su uso bajo las mismas condiciones de la Licencia OSS: MPL 2.0), configurable: con otros valores por defecto y soporte bilingüe para Español (SPA)
Cómo funciona
1) Siempre va a resultar mejor detectar velas japonesas específicas o patrones: doji , martillos o martillos invertidos , velas envolventes , patrón amanecer o atardecer , harami , velas gemelas , etcétera
2) La EMA de 10 y 21 períodos ayudan a identificar el comportamiento de corto plazo
3) La EMA de 55 períodos puede ser usada como un soporte o resistencia de mediano plazo, como así también, la EMA de 200 períodos en el muy largo plazo
4) Será conveniente buscar un doble cruce (10 & 21) o un triple cruce (10, 21 & 55) para determinar un cambio de la tendencia de mediano plazo de bajista hacia alcista (o viceversa)
5) Confirmá el patrón de cambio con la Parabólica de SAR y entonces identificá potenciales compras o ventas
6) Usá el perfil de volumen para detectar las potenciales zonas de soporte o resistencia, principalmente para establecer ordenes stop limit/loss o take profit.
¡Espero que pueda serles de utilidad!
Saludos,
FRANCRYPTO®

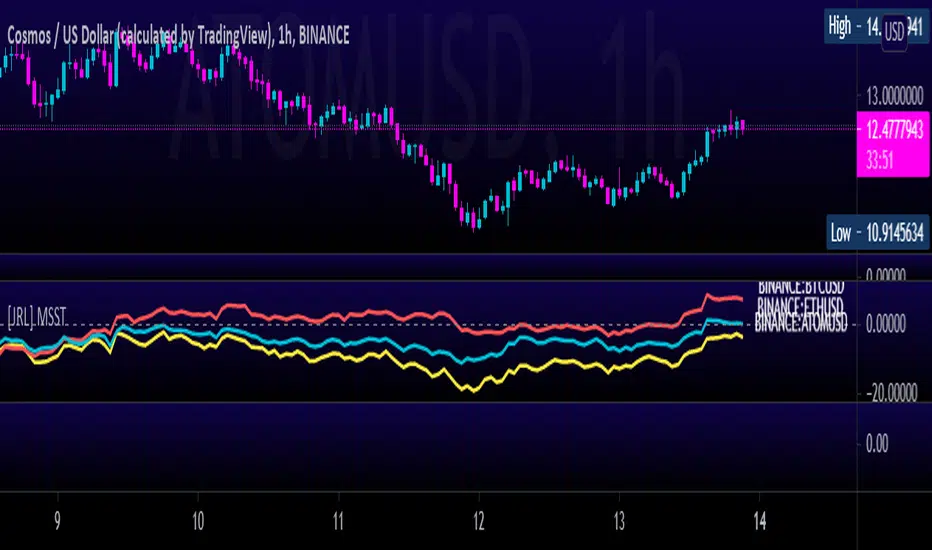
[JRL] Multi-Symbol Strength TrackerI created this script to compare cryptocurrencies that tend to be correlated, but it could also be used for forex or any other market. It is a fairly simple concept and compares price of each symbol to the specified period ema. This is helpful for tracking highly correlated symbols and visualizing moments when they are out of sync, perhaps signaling good times for buying or selling.
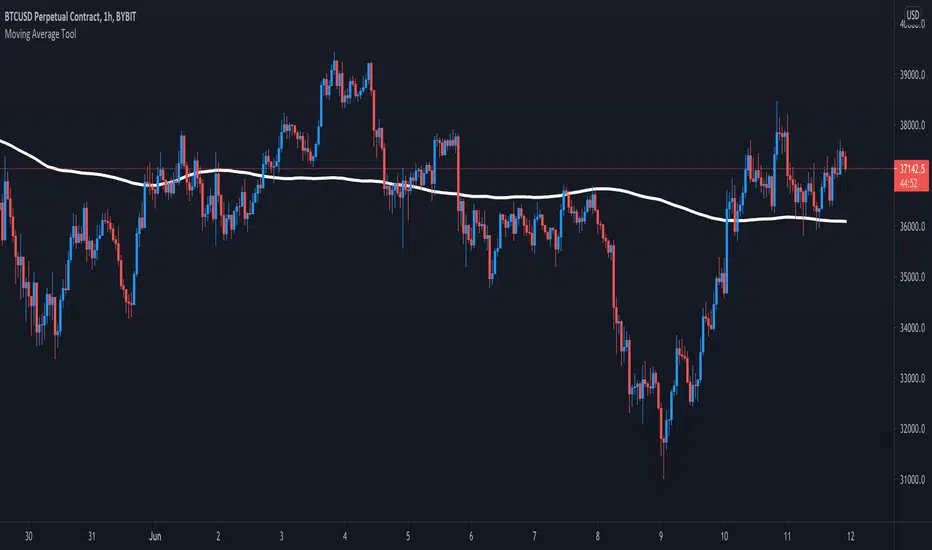
Moving Average ToolThe Moving Average Tool is the only indicator you will ever need to plot MA lines. It comes loaded with 9 different types of moving averages so traders can lay down any line at any length. There is also an option to plot a trigger line. Features: SMA , SMMA, EMA, LSMA, ZLSMA, HULL, LWMA, VWMA and ALMA. Simply pick an average type and enter the desired length.
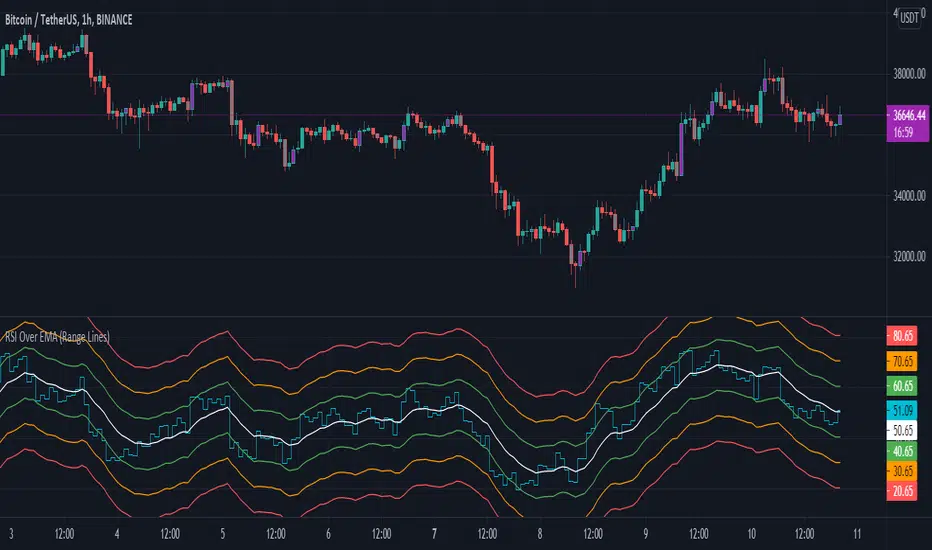
RSI Over EMA (Range Lines)This is another version of the RSI over EMA Trend Sniper script that I released here:
This one gives you better control across pairs wither higher volatility with the extra lines and more alert possibilities.
Here are the useful Alert functions within this indicator:
LONGS:
-Aqua line (RSI Line) - Crossing UP (Long Alert) on the Lower Green line
-Aqua line (RSI Line) - Crossing UP (Long Alert) on the Upper Green line
-Aqua line (RSI Line) - Crossing UP (Long Alert) on the Lower Amber line
-Aqua line (RSI Line) - Crossing UP (Long Alert) on the Upper Amber line
-Aqua line (RSI Line) - Crossing UP (Long Alert) on the Lower Red line
-Aqua line (RSI Line) - Crossing UP (Long Alert) on the Upper Red line
SHORTS:
-Aqua line (RSI Line) - Crossing DOWN (Short Alert) on the Lower Green line
-Aqua line (RSI Line) - Crossing DOWN (Short Alert) on the Upper Green line
-Aqua line (RSI Line) - Crossing DOWN (Short Alert) on the Lower Amber line
-Aqua line (RSI Line) - Crossing DOWN (Short Alert) on the Upper Amber line
-Aqua line (RSI Line) - Crossing DOWN (Short Alert) on the Lower Red line
-Aqua line (RSI Line) - Crossing DOWN (Short Alert) on the Upper Red line
You can setup alerts for the Aqua line (RSI Line) 'crossing up' (Long Alert) or 'crossing down' (Short Alert) on any of the colored EMA lines.
By default the lines are spread out at 10/20/30 and that should cover high volatility charts. But, this is customizable and you can reduce the size of Green/Amber/Red lines to try and get a better more focused setup for whichever coin you are trading on. I have found this version of the RSI over EMA to work better with alt coins that are generally more volatile, but using it on Bitcoin works too.
I am using this for Cryptocurrency alerts, but not for automation to enter or exit a trade. It's important to only use this on normal candles, and only use it as a confirmation of a possible good entry or exit.
PSAR + EMA + TEMACombined PSAR with EMA and/or TEMA lines, including fast/slow plots, for entry/exit signals. Includes signals for all plots.
Credit to TEMA With Alert by BerkSay and Parabolic SAR by Alex Orekhov (everget).

EMA based ATR Stops-If the FAST EMA is ABOVE the SLOW EMA then the ATR Stops will be placed x amount BELOW the lows
-If the FAST EMA is BELOW the SLOW EMA , then the ATR Stops will be placed x amount ABOVE the highs
-If the fast ema is above the slow ema but they are sloping down, their colours will turn to a shade of blue
-If the fast ema is below the slow ema but they are sloping up, their colours will turn to a lighter shade of blue
-I added an extra ema but it is off by default
TAYOR!
