Vital Wave 20-50Simplicity is almost always the most effective approach, and here I’m giving you a trend-following system that exploits the bullish bias of traditional markets and their trending nature, with very basic rules.
Rules (long entries only)
• Market entry: When the EMA 20 crosses above the EMA 50 (from below)
• Main market exit: When the EMA 20 crosses below the EMA 50 (from above)
• Fixed Stop Loss: Placed at the price level of the Lower Bollinger Band at the moment the trade is entered.
In my strategy, the primary exit is when the EMA 20 crosses below the EMA 50. However, this crossover can sometimes take a while to occur, and in the meantime the price may have already dropped significantly. The Stop Loss based on the Lower Bollinger Band is designed to limit losses in case the market moves sharply against the position without giving the bearish crossover signal in time. Having two exit conditions makes the strategy much more robust in terms of risk management.
Risk Management:
• Initial capital: $10,000
• Position size: 10% of available capital per trade
• Commissions: 0.1% on traded volume
• Stop Loss: Based on the Lower Bollinger Band
• Take Profit / Exit: When EMA 20 crosses below EMA 50
Recommended Markets:
XAUUSD (OANDA) (Daily)
Period: January 3, 1833 – November 23, 2025
Total Profit & Loss: +$6,030.62 USD (+57.57%)
Maximum Drawdown: $541.53 USD (3.83%)
Total Trades: 136
Winning Trades (Win Rate): 36.03% (49/136)
Profit Factor: 2.483
XAUUSD (OANDA) (12-hour)
Period: March 19, 2006 – November 23, 2025
Total Profit & Loss: +$1,209.56 USD (+11.89%)
Maximum Drawdown: $384.58 USD (3.61%)
Total Trades: 97
Winning Trades (Win Rate): 35.05% (34/97)
Profit Factor: 1.676
XAUUSD (OANDA) (8-hour)
Period: March 19, 2006 – November 23, 2025
Total Profit & Loss: +$1,179.36 USD (+11.81%)
Maximum Drawdown: $246.88 USD (2.32%)
Total Trades: 147
Winning Trades (Win Rate): 31.97% (47/147)
Profit Factor: 1.626
Tesla (NASDAQ) (4-hour)
Period: June 29, 2010 – November 23, 2025
Total Profit & Loss (Absolute): +$11,687.90 USD (+116.88%)
Maximum Drawdown: $922.05 USD (6.50%)
Total Trades: 68
Winning Trades (Win Rate): 39.71% (27/68)
Profit Factor: 4.156
Tesla (NASDAQ) (3-hour)
Total Profit & Loss: +$11,522.33 USD (+115.22%)
Maximum Drawdown: $1,247.60 USD (8.80%)
Total Trades: 114
Winning Trades: 33.33% (38/114)
Profit Factor: 2.811
Additional Recommendations
(These assets have shown good trending behavior with the same strategy across multiple timeframes):
• NVDA (15 min, 30 min, 1h, 2h, 3h, 4h, 6h, 8h, 12h, Daily)
• NFLX (1h, 2h, 3h, 4h, 6h, 8h, 12h, Daily)
• MA (1h, 2h, 3h, 4h, 6h, 8h, 12h, Daily)
• META (1h, 2h, 3h, 4h, 6h, 8h, 12h, Daily)
• AAPL (1h, 2h, 3h, 4h, 6h, 8h, 12h, Daily)
• SPY (12h, Daily)
About the Code
The user can modify:
• EMA periods (20 and 50 by default)
• Bollinger Bands length (20 periods)
• Standard deviation (2.0)
Visualization
• EMA 20: Blue line
• EMA 50: Red line
• Green background when EMA20 > EMA50 (bullish trend)
• Red background when EMA20 < EMA50 (bearish trend)
Important Note:
We can significantly increase the profit factor and overall profitability by risking a fixed percentage per trade instead of a fixed amount. This would prevent losses from fluctuating with changes in volatility.
This could be implemented by reducing position size or adjusting leverage based on the volatility percentage required for each trade, but I’m not sure if this is fully possible in Pine Script. In my other script, “ Golden Cross 50/200 EMA ,” I go deeper into this topic and provide examples.
I hope you enjoy this contribution. Best regards!
Экспоненциальное скользящее среднее (EMA)

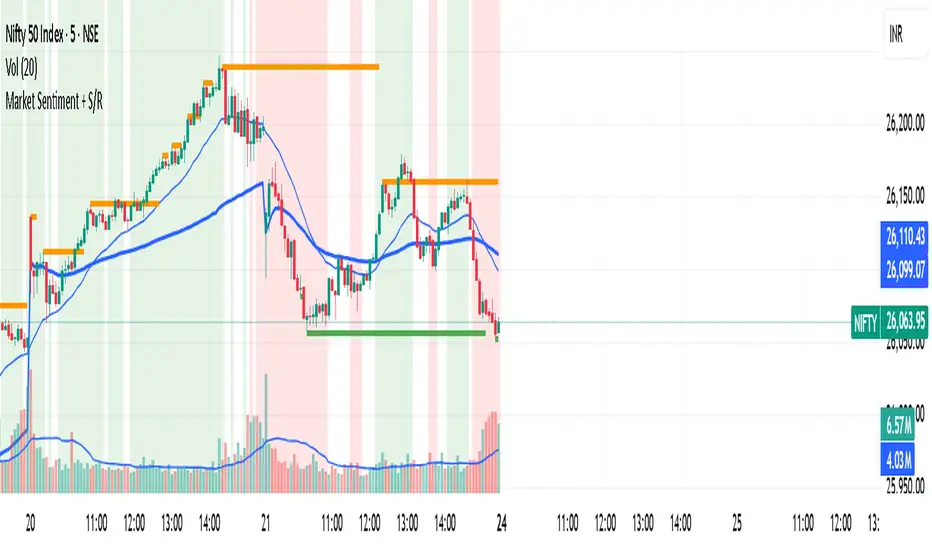
Market Sentiment + S/R KPRThis script is having VWAP and moving average cross overs. and also support and resistence.
HTF EMA Ribbon Bias by HammerGeekThis indicator displays a higher-timeframe EMA-ribbon bias directly on any lower-timeframe chart. It uses four EMAs (5, 9, 13, 21) computed on the selected higher timeframe and detects the directional “stacking” of those EMAs to determine trend bias:
Bullish: EMAs are strictly stacked 5 > 9 > 13 > 21 (fully separated, no overlap)
Bearish: EMAs are strictly stacked 5 < 9 < 13 < 21
Neutral: Any overlap, crossing, or mixed order between the four EMAs
The indicator shades the background to show the bias: green for bullish, red for bearish, yellow for neutral. A built-in toggle lets you choose whether the bias should update live from the current higher-timeframe candle (faster, but may repaint) or only after the higher-timeframe candle closes (slower, but non-repainting).
Designed for traders who want clean, instantly readable higher-timeframe context—especially when working on lower-timeframe charts such as 30m, 15m, or 5m.
All settings can be modified to suit users' desires.
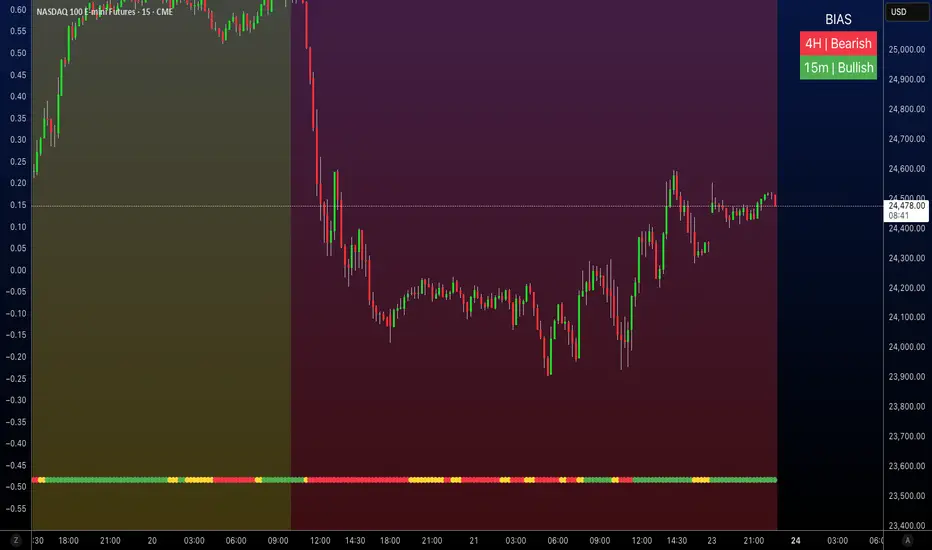
MTF EMA Directional Bias -1hr and 4hr A compact, fixed-position table (bottom-right corner) that shows the current slope direction of two higher-timeframe EMAs:
4H EMA 50 → direction over the last 2 bars (UP ↑, DOWN ↓, or FLAT ⏸)
1H EMA 21 → direction over the last 2 bars (UP ↑, DOWN ↓, or FLAT ⏸)
Background color logic:
Green → both 4H and 1H EMAs are sloping upward
Red → both 4H and 1H EMAs are sloping downward
Gray → mixed or flat directions (no confluence)
Additionally draws the actual 1H EMA-21 (purple) and 4H EMA-50 (red) as step-lines on the chart.

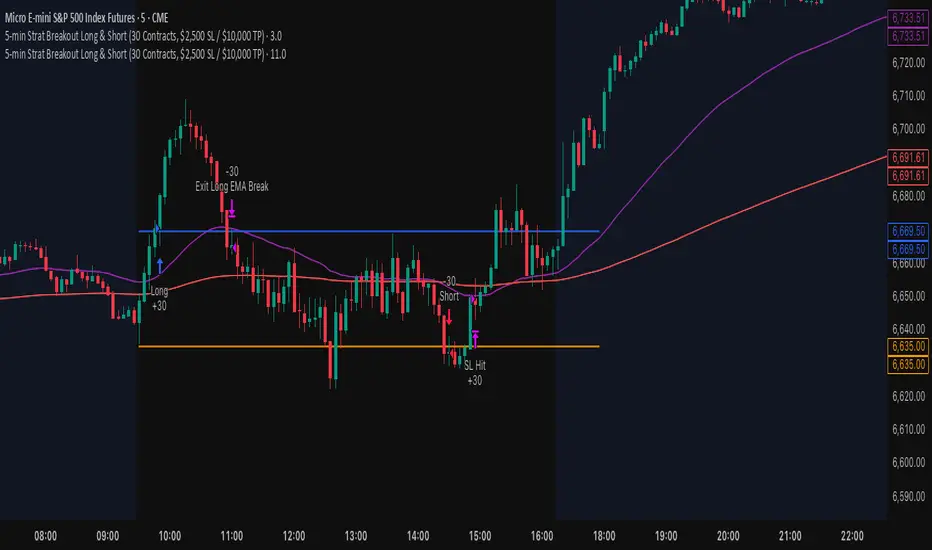
Tripwire Pro+Tripwire – Trail-Based Trend Direction Indicator
OVERVIEW
Tripwire is a powerful, volatility-adaptive trailing indicator designed to keep traders on the right side of momentum while offering signals and alerts based on the users settings and filters.
CONCEPT & INSPIRATION
This indicator is directly inspired from the Zombie9Trail by Frosty (creator of the Zombie Pack and TickHunter for NinjaTrader).
When all filters are turned off, Tripwire replicates the core behavior of Zombie9Trail — delivering the same razor-sharp trailing logic.
Most of Frosty's testing has been done from the 1 minute time frame, while I have personally found for my style of trading the 5 minute time frame works better for me.
WHAT THIS VERSION ADDS — TradingView Enhancements
• Optional multi-layer trend filters (21, 34, 170 EMA) to separate high-probability pullbacks from actual trend changes
• Clean Buy/Sell/Pullback signal labels with alert conditions
• Real-time dashboard showing current trail value, trend state, and filter status
• Fully customizable ATR length, multiplier, source, and visual styling
• All values exported as plots — perfect for CSV download and strategy development
HOW TO USE
Filters ON (recommended for trend-following) → Take signals in the direction of the higher-timeframe trend. Great for staying in strong moves and avoiding fake outs.
Filters OFF (pure Zombie9Trail mode) → Possibly catch early reversals and ride new trends
CREDIT & RESPECT
Core trailing methodology and original genius: Frosty — creator of Zombie9Trail / Zombie Pack / TickHunter (NinjaTrader).
This TradingView adaptation was built in direct homage to his NinjaTrader work and with his encouragement. Everything beyond the base trailing logic (filters, dashboard, alerts, exportable plots, visual polish) is original.
DISCLAIMER
For educational and informational purposes only. Not financial advice. Past performance is no guarantee of future results. Test thoroughly.

9/21 EMA Trend TOP rIGHT CORNER INDICATORCrossover indicator for the 9 & 21 EMA. Buy Sell for cross up or down respectively. Daily, weekly and Monthly trend.

GBPUSD Weekly Cross LinesThis indicator tracks 20/50 EMA crossovers on GBPUSD (Weekly timeframe) and displays the crossover points across all symbols and timeframes, allowing traders to visually align current price action with key historical turning points in GBPUSD.
The script works by detecting bullish (20 EMA crossing above 50 EMA) and bearish (20 EMA crossing below 50 EMA) signals since 2010, using request.security() to source data from GBPUSD weekly candles, even if the indicator is applied to AAPL, EURJPY, BTCUSD, or any other asset.
Each crossover is marked with a vertical line that persists across all charts, offering a powerful way to:
Compare current market context with GBPUSD’s historical trend shifts
Observe intermarket correlations
Align trading timing across multiple assets
Spot macro trend transitions that ripple across global markets


Piku Pips📌 Piku Pips — Multi-Confluence Smart Signal System (EMA + Supertrend + Volume Profile + ATR Trailing + SR + RSI Climax Engine)
Piku Pips is a complete multi-confluence trading system designed for scalpers, intraday traders, and swing traders who rely on precision entries and institutional-grade confirmation layers.
This indicator combines trend, momentum, volatility, volume imbalance, structure breaks, smart money pivots, and exhaustion events—into a single unified charting system.
It does NOT repaint, supports alerts, and works across all assets (crypto, forex, indices, stocks).
🔥 What Makes This Indicator Special?
Piku Pips is built on stacked confluences instead of single-indicator signals.
Each signal is only printed when multiple conditions align, significantly increasing accuracy and reducing noise.
It includes:
✔ Trend Identification
Fast & Slow EMA cross
SuperTrend with custom ATR & factor
Parabolic SAR for micro-trend confirmation
ATR-based trailing stop engine (dual version for Buy & Sell)
✔ Momentum Confirmation
RSI Midline model
HH/LL structure detection
Bull/Bear volume imbalance model
✔ Smart Volume Analysis
Bullish vs Bearish VWMA volume
Flat-volume filters
RSI + Volume Spike + MFI exhaustion detection (Climax Module)
✔ Institutional Structure Mapping
Dynamic Support & Resistance
Automatic Zone Strength Ranking
Breakout detection with zone coloring
Pivot-based structure scanning
✔ Exhaustion + Divergence Engine (Climax Module)
RSI / Stochastic RSI hybrid
Macro trend smoothing (EMA/RMA/SMA/WMA selectable)
High-precision RSI divergence detection (HH/LH and LL/HL)
Volume spike detection
Buy Climax (potential top)
Sell Climax (potential bottom)
This module acts like a “smart momentum brain” that identifies major reversals.
🎯 Signal Logic (Simplified)
🔹 Buy Signal (Green Triangle)
Triggered when:
Fast EMA crosses above Slow EMA
Higher High structure forms
RSI > midline or crosses above it
Volume profile is bullish
SuperTrend is bullish (direction < 0)
🔹 Sell Signal (Red Triangle)
Triggered when:
Fast EMA crosses below Slow EMA
Lower Low structure forms
RSI < midline or crosses below it
Volume profile is bearish
SuperTrend is bearish (direction > 0)
🔸 Secondary ATR Signals (Orange & Maroon)
Uses Heikin-Ashi ATR trailing stop
Detects micro-shifts in trend momentum
Works excellent in scalping timeframes
🧠 Support & Resistance Engine
The script builds dynamic SR zones based on:
Pivot clustering
Channel width filtering
Strength scoring
Automated sorting and plotting
Zones:
Red tint = Resistance
Green tint = Support
Gray tint = Neutral / In-Play
Alerts trigger on clean SR breaks.
⚡ Climax Module (Exhaustion System)
This system overlays major exhaustion points:
🔻 Buy Climax
High-volume upward exhaustion → potential top.
🔺 Sell Climax
High-volume downward exhaustion → potential bottom.
🔼 RSI Divergences
Bullish divergence labeled "RSI⬆"
Bearish divergence labeled "RSI⬇"
Combined, these give early insight into possible reversals.
🛠 Inputs Overview
📌 Trend Inputs
Fast EMA Length
Slow EMA Length
SuperTrend ATR + Factor
SAR multipliers
Buy/Sell ATR trailing stop parameters
📌 Momentum Inputs
RSI length / midline
Bull/Bear volume variance filter
HH/LL confirmation
📌 Structure Inputs
Pivot sensitivity
Max SR Zones
Loopback length
Zone strength minimum
📌 Climax Module Inputs
RSI / Stochastic lengths
Smoothing method (EMA, SMA, RMA, WMA)
Macro trend slope settings
Pivot sensitivity for divergence
Volume spike multiplier
MFI thresholds
Bull/Bear RSI levels
📈 How to Use Piku Pips
Best Use-Cases:
Scalping (1m–15m)
Intraday (15m–1H)
Swing trading (4H–1D)
Crypto / Forex / Indices / Stocks
Recommended Approach
Trade in direction of EMA + Supertrend + Macro RSI regime.
Enter when Piku Buy/Sell signal aligns with the trend.
Use SR zones as targets or invalidation levels.
Watch Climax signals for tops & bottoms.
Use divergence signals for early reversals.
🔔 Alerts Included
Buy Signal
Sell Signal
ATR Buy / Sell
Buy Climax
Sell Climax
RSI Divergence (bullish & bearish)
All-Signals alert
⚠️ Disclaimer
This indicator is created for educational purposes only and does not constitute financial advice.
Trading involves risk. Do your own research and backtesting before using any tool in live markets.
Timeframe Fast EMA Slow EMA ATR Period Factor RSI Length Overbought/Oversold
5 Min 9 21 10 2 8 80 / 20
15 Min 10 25 10 2.5 10 75/25
1 Hour 20 50 14 3 12 70/30
4 Hour 21 50 14 3 14 70/30
1 Day 20 100 14 3.5 14 70/30
Please use this settings for accurate results

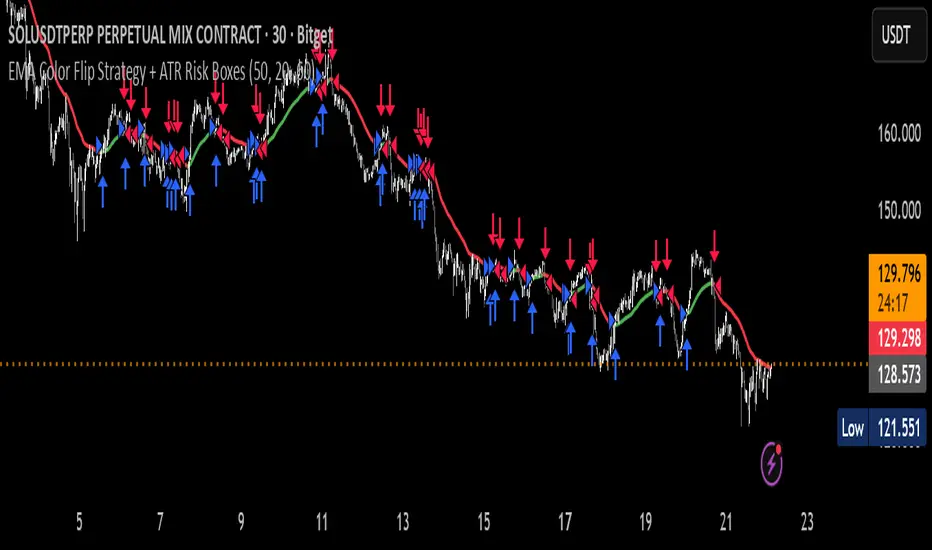
EMA Color Flip Strategy Experimenting on SOL 30 min chart, it seems good!
Let me know what you think!
SMI Color Red/Green📌 TradingView Description – SMI Red/Green Momentum Line
🔥 Stochastics Momentum Index (SMI) – Dynamic Red/Green Version
This indicator is an enhanced and modernized version of the Stochastic Momentum Index (SMI), designed to deliver a more visual, intuitive, and responsive view of trend momentum.
It includes:
✔️ Smoothed SMI
✔️ Dynamic Red/Green momentum coloring
✔️ Signal EMA line
✔️ Overbought/Oversold zones with shading
🎨 Dynamic Red/Green SMI Line
The main SMI line automatically changes color based on momentum direction:
Green → Bullish momentum (SMI rising)
Red → Bearish momentum (SMI falling)
This provides instant visual feedback and highlights early momentum changes even before traditional signal-line crossovers.
📉 Indicator Structure
1️⃣ Smoothed SMI
The SMI is calculated using the price’s position inside its range and then smoothed with an SMA to reduce noise.
2️⃣ EMA Signal Line
A customizable EMA acts as a signal line, providing:
Clear bullish/bearish crossovers
Trend confirmation
Cleaner entry/exit signals
3️⃣ Overbought / Oversold Zones
Extreme levels are highlighted using color-filled zones:
Red Zone (Overbought) → potential bearish reversal
Green Zone (Oversold) → potential bullish reversal
Levels are fully adjustable.
💡 How to Use It
The indicator works exceptionally well across all timeframes.
The most powerful signals are:
✔️ SMI crossing above/below the EMA
SMI crosses above EMA → bullish signal
SMI crosses below EMA → bearish signal
✔️ Leaving Overbought/Oversold zones
SMI exits the oversold zone → potential long setup
SMI exits the overbought zone → potential short setup
✔️ Color shifts (momentum direction)
Red → Green : early bullish momentum
Green → Red : early bearish momentum
Perfect for scalping, day trading, and swing trading.
🚀 Why This Version Is Better
Extremely visual momentum reading
Noise reduction through smoothing
Instantly readable color-coded trend
Strong OB/OS zone visualization
Works on any market and timeframe
Great in combination with RSI, MACD, HMA, ALMA, and trend filters
If you'd like, I can also write:
🔹 a SEO-optimized title,
🔹 recommended TradingView tags,
🔹 or a shorter promotional description.

Hash Momentum IndicatorHash Momentum Indicator
Overview
The Hash Momentum Indicator provides real-time momentum-based trading signals with visual entry/exit markers and automatic risk management levels. This is the indicator version of the popular Hash Momentum Strategy, designed for traders who want signal alerts without backtesting functionality.
Perfect for: Live trading, automation via alerts, multi-indicator setups, and clean chart visualization.
What Makes This Indicator Special
1. Pure Momentum-Based Signals
Captures price acceleration in real-time - not lagging moving average crossovers. Enters when momentum exceeds a dynamic ATR-based threshold, catching moves as they begin accelerating.
2. Automatic Risk Management Visualization
Every signal automatically displays:
Entry level (white dashed line)
Stop loss level (red line)
Take profit target (green line)
Partial TP levels (dotted green lines)
3. Smart Trade Management
Trade Cooldown: Prevents overtrading by enforcing waiting period between signals
EMA Trend Filter: Only trades with the trend (optional)
Session Filters: Trade only during Tokyo/London/New York sessions (optional)
Weekend Toggle: Avoid low-liquidity weekend periods (optional)
4. Clean Visual Design
🟢 Tiny green dot = Long entry signal
🔴 Tiny red dot = Short entry signal
🔵 Blue X = Long exit
🟠 Orange X = Short exit
No cluttered labels or dashboard - just clean signals
5. Professional Alerts Ready
Set up TradingView alerts for:
Long signals
Short signals
Long exits
Short exits
How It Works
Step 1: Calculate Momentum
Momentum = Current Price - Price
Normalized by standard deviation for consistency
Must exceed ATR × Threshold to trigger
Step 2: Confirm Acceleration
Momentum must be increasing (positive momentum change)
Price must be moving in signal direction
Step 3: Apply Filters
EMA Filter: Long only above EMA, short only below EMA (if enabled)
Session Filter: Check if in allowed trading session (if enabled)
Weekend Filter: Block signals on Sat/Sun (if enabled)
Cooldown: Ensure minimum bars passed since last signal
Step 4: Generate Signal
All conditions met = Entry signal fires
Lines automatically drawn for entry, stop, and targets
Step 5: Exit Detection
Opposite momentum detected = Exit signal
Stop loss or take profit hit = Exit signal
Lines removed from chart
⚙️ Settings Guide
Core Strategy
Momentum Length (Default: 13)
Number of bars for momentum calculation. Higher values = stronger signals but fewer trades.
Aggressive: 10
Balanced: 13
Conservative: 18-24
Momentum Threshold (Default: 2.25)
ATR multiplier for signal generation. Higher values = only trade the biggest momentum moves.
Aggressive: 2.0
Balanced: 2.25
Conservative: 2.5-3.0
Risk:Reward Ratio (Default: 2.5)
Your target profit as a multiple of your risk. With 2.2% stop and 2.5 R:R, your target is 5.5% profit.
Conservative: 3.0+ (need 25% win rate to profit)
Balanced: 2.5 (need 29% win rate to profit)
Aggressive: 2.0 (need 33% win rate to profit)

9/15 EMA Scalper 9/15 EMA Scalper — by uzairbaloch
This script is a price-action based scalping system built around the 9 EMA and 15 EMA trend structure.
It identifies short-term reversal points where the market pulls back into the EMAs and confirms direction with a strong candle signal.
The strategy looks for:
• A clear EMA trend (9 above 15 for buys, 9 below 15 for sells)
• Pullback into EMA9/EMA15 with candle bodies touching the fast EMA
• Strong confirmation candle (engulfing / strong momentum / controlled wick)
• Optional slope filter to avoid flat, choppy sessions
• Automatic trade labels showing Entry, SL and TP (based on R:R)
The script is designed for scalping on gold, indices, and high-volatility FX pairs.
It resets trade logic immediately after SL or TP is hit, so it can catch the next valid signal without delay.
This tool is meant as an indicator — not a full strategy — and can be used to visually mark high-probability EMA pullback setups with precise levels.
Author: uzairbaloch

Eagle V 2.0 - AIEagle V 2.0 – AI Edition is a next-generation signal engine designed for traders who want clean entries, consistent performance, and reduced stop-loss hits.
The indicator analyzes trend strength, liquidity behavior, volatility conditions, market structure, and price momentum to generate high-quality buy and sell signals only when the market is aligned.
Instead of flooding the chart with noise, Eagle V 2.0 focuses on precision.
Every signal comes with a calculated stop-loss, three Fibonacci-based take-profit levels, and a confidence score that helps you quickly judge the strength of the setup.
What the Indicator Delivers
Clear Long/Short signals filtered to avoid weak setups
Smart Stop-Loss placement to reduce fake-outs
TP1 / TP2 / TP3 levels automatically calculated based on market movement
AI Confidence Score (0–100) to measure the quality of each opportunity
Real-time Support & Resistance zones that update with market structure
Trend direction and momentum bias across multiple timeframes
Trade history panel showing win rate, total P&L, biggest wins/losses, and your last trades
Dashboard with market conditions, liquidity state, and timeframe bias
Who This Indicator Is For
Scalpers, day traders, and swing traders who want fewer but higher-quality signals, strong risk management, and a tool that adapts to any market—Forex, Crypto, Indices, or Stocks.
Summary
Eagle V 2.0 focuses on the only thing that matters:
Cleaner signals, controlled risk, and stronger results.

Multi-EMA IndicatorIndicator Purpose
The "Multi EMA Indicator" is a clean, customizable script that plots up to four Exponential Moving Averages (EMAs) on the price chart simultaneously. It is designed for traders who want full control over which EMAs are displayed, their periods, colors, and visibility — without cluttering the chart or needing multiple separate EMA indicators.
User-Configurable Options (all adjustable from the indicator’s settings panel):Option
All EMAs are calculated using the close price and are plotted with a linewidth of 2 for clear visibility. Users can instantly show/hide any combination of the four EMAs and change their colors to match any charting style or strategy (e.g., 9/21 crossover, 50/200 golden cross, etc.).

4-Line RibbonRibbon for 20, 50, 100, 200 EMA/ SMA.
2 colour areas for bullish or bearish.
3 shade gradient between the different MA's.

RSI VWAP EMA ON CHART1. Understand the components
VWAP (Volume Weighted Average Price)
Green: price is above VWAP → bullish trend
Red: price is below VWAP → bearish trend
Blue: price exactly at VWAP → neutral
Acts as a dynamic trend line and support/resistance.
4 Moving Averages (MA1–MA4)
Customizable lengths and type (SMA or EMA).
Useful for trend confirmation and dynamic support/resistance.
Typically:
MA1 = fastest (short-term)
MA4 = slowest (long-term)
When price is above multiple MAs → strong bullish trend; below → bearish trend.
RSI Overlay with VWAP Alignment
RSI line normalized to price scale.
Background shading indicates momentum aligned with VWAP trend:
Green shading: RSI > 50 and price above VWAP → bullish momentum
Red shading: RSI < 50 and price below VWAP → bearish momentum
Gray areas: neutral or momentum does not align with VWAP.
2. Basic usage workflow
Trend Confirmation
Look at VWAP color: price above → bullish, below → bearish.
Check RSI + VWAP shading: green confirms bullish momentum, red confirms bearish momentum.
Check MA alignment: shorter MAs above longer MAs = stronger bullish trend; vice versa for bearish.
Entry Signals (Scalping)
Long (Buy) Setup
Price above VWAP (green)
RSI green shading (RSI > 50)
Shorter MAs above longer MAs (trend support)
Short (Sell) Setup
Price below VWAP (red)
RSI red shading (RSI < 50)
Shorter MAs below longer MAs
Exits / Stops
Exit if price closes against VWAP trend (e.g., price drops below VWAP during a bullish trade).
Use nearest MA support/resistance as stop-loss or take-profit zones.
3. Optional adjustments for scalping
RSI length / thresholds
Shorter RSI (7–10) → faster response for scalping.
Standard RSI (14) → smoother, fewer false signals.
MA lengths
Short-term: 20–50
Medium-term: 50–100
Long-term: 100–200
Can tweak for the timeframe you trade (1m, 5m, 15m).
Timeframe
VWAP works best on intraday charts (1m, 5m, 15m).
Use higher timeframe (e.g., 15m or 1h) for trend direction and lower timeframe (1m–5m) for entries.
4. Example Scalping Setup
Bullish setup (buy):
Price above VWAP → VWAP green
RSI > 50 and green shading
Shorter MAs above longer MAs
Enter on small pullback or breakout
Stop: below nearest MA or VWAP
Bearish setup (sell):
Price below VWAP → VWAP red
RSI < 50 and red shading
Shorter MAs below longer MAs
Enter on minor bounce or breakdown
Stop: above nearest MA or VWAP
5. Visual cues summary
Element Interpretation
VWAP Green Price above VWAP → bullish trend
VWAP Red Price below VWAP → bearish trend
RSI Green Shading Bullish momentum aligns with VWAP
RSI Red Shading Bearish momentum aligns with VWAP
MA Alignment Trend strength (short above long = bullish, short below long = bearish)

VWAP + 4 MAs with RSI Overlay & VWAP Alignment1. Understand the components
VWAP (Volume Weighted Average Price)
Green: price is above VWAP → bullish trend
Red: price is below VWAP → bearish trend
Blue: price exactly at VWAP → neutral
Acts as a dynamic trend line and support/resistance.
4 Moving Averages (MA1–MA4)
Customizable lengths and type (SMA or EMA).
Useful for trend confirmation and dynamic support/resistance.
Typically:
MA1 = fastest (short-term)
MA4 = slowest (long-term)
When price is above multiple MAs → strong bullish trend; below → bearish trend.
RSI Overlay with VWAP Alignment
RSI line normalized to price scale.
Background shading indicates momentum aligned with VWAP trend:
Green shading: RSI > 50 and price above VWAP → bullish momentum
Red shading: RSI < 50 and price below VWAP → bearish momentum
Gray areas: neutral or momentum does not align with VWAP.
2. Basic usage workflow
Trend Confirmation
Look at VWAP color: price above → bullish, below → bearish.
Check RSI + VWAP shading: green confirms bullish momentum, red confirms bearish momentum.
Check MA alignment: shorter MAs above longer MAs = stronger bullish trend; vice versa for bearish.
Entry Signals (Scalping)
Long (Buy) Setup
Price above VWAP (green)
RSI green shading (RSI > 50)
Shorter MAs above longer MAs (trend support)
Short (Sell) Setup
Price below VWAP (red)
RSI red shading (RSI < 50)
Shorter MAs below longer MAs
Exits / Stops
Exit if price closes against VWAP trend (e.g., price drops below VWAP during a bullish trade).
Use nearest MA support/resistance as stop-loss or take-profit zones.
3. Optional adjustments for scalping
RSI length / thresholds
Shorter RSI (7–10) → faster response for scalping.
Standard RSI (14) → smoother, fewer false signals.
MA lengths
Short-term: 20–50
Medium-term: 50–100
Long-term: 100–200
Can tweak for the timeframe you trade (1m, 5m, 15m).
Timeframe
VWAP works best on intraday charts (1m, 5m, 15m).
Use higher timeframe (e.g., 15m or 1h) for trend direction and lower timeframe (1m–5m) for entries.
4. Example Scalping Setup
Bullish setup (buy):
Price above VWAP → VWAP green
RSI > 50 and green shading
Shorter MAs above longer MAs
Enter on small pullback or breakout
Stop: below nearest MA or VWAP
Bearish setup (sell):
Price below VWAP → VWAP red
RSI < 50 and red shading
Shorter MAs below longer MAs
Enter on minor bounce or breakdown
Stop: above nearest MA or VWAP
5. Visual cues summary
Element Interpretation
VWAP Green Price above VWAP → bullish trend
VWAP Red Price below VWAP → bearish trend
RSI Green Shading Bullish momentum aligns with VWAP
RSI Red Shading Bearish momentum aligns with VWAP
MA Alignment Trend strength (short above long = bullish, short below long = bearish)

BB Breakout + EMA Touch (50/100)Shows points only when BOTH happen on the same candle:
1️⃣ Price breaks through Bollinger Bands
2️⃣ Price touches (or crosses) EMA 50 or EMA 100


VWAP-EMA Ribbon by BucksTRDR📊 VWAP-EMA Ribbon by BucksTRDR
A comprehensive trend and momentum indicator combining 5 Exponential Moving Averages with dual VWAP levels (Session & Weekly) for multi-timeframe analysis.
🎯 KEY FEATURES
Five Exponential Moving Averages: • EMA 5 (Aqua) - Fast-moving, immediate price action • EMA 9 (Lime) - Short-term trend • EMA 21 (Yellow) - Medium-term trend • EMA 50 (Orange) - Key support/resistance • EMA 200 (Red) - Long-term trend baseline
Dual VWAP Analysis: • Session VWAP (Blue) - Resets daily, tracks institutional intraday levels • Weekly VWAP (Fuchsia) - Resets weekly, identifies longer-term value areas
Visual Design: • Bold VWAP lines (4px width) for clear reference levels • Color-coded EMAs (2px width) for easy identification • Clean, professional chart layout
📈 HOW TO USE
Trend Identification: ✓ Price above all EMAs + above VWAP = Strong uptrend ✓ Price below all EMAs + below VWAP = Strong downtrend ✓ EMAs fanning out = Momentum increasing ✓ EMAs converging = Potential trend reversal
Support & Resistance: ✓ Watch for bounces off individual EMAs ✓ VWAP acts as magnetic institutional level ✓ 200 EMA frequently serves as major support/resistance
Entry Signals: ✓ Pullbacks to 21 EMA in trending markets ✓ Price reclaiming VWAP after being below ✓ Faster EMA crossing above slower EMA ✓ Confluence of multiple EMAs at same level
Exit Signals: ✓ Price breaking below key EMAs ✓ Loss of VWAP support/resistance ✓ Death cross (50 EMA crossing below 200 EMA)
⚙️ CUSTOMIZATION
Fully Adjustable Settings: • All EMA lengths can be changed • All colors are customizable (EMAs + VWAPs) • Line widths adjustable • Individual on/off toggles for each indicator • Organized input groups for easy navigation
💡 BEST PRACTICES
Recommended Timeframes: • 5-minute charts for day trading • 15-minute for scalping and day trading • 1-hour for swing trading • Daily for position trading
Market Conditions: • Excellent for trending markets • Use caution in choppy/sideways conditions • Works on stocks, forex, crypto, indices, futures
Complementary Tools: • Combine with volume analysis • Add RSI for overbought/oversold confirmation • Use with candlestick patterns • Check multiple timeframes for confluence
🔍 WHAT MAKES THIS DIFFERENT
Unlike standard single EMA or VWAP indicators, this ribbon approach provides:
Multi-layered analysis - See short, medium, and long-term trends simultaneously
Volume-weighted context - VWAP shows institutional positioning
Clean visualization - All key moving averages in one organized display
Maximum flexibility - Adapt to any trading style or timeframe
📊 TRADING EXAMPLES
Bullish Setup: Price crosses above 21 EMA → bounces off 50 EMA → all EMAs slope upward → VWAP acting as support = Strong buy signal
Bearish Setup: Price crosses below 21 EMA → rejects at 50 EMA → all EMAs slope downward → VWAP acting as resistance = Strong sell signal
Reversal Signal: Price below all EMAs → reclaims 21 EMA → then 50 EMA → crosses above VWAP = Potential trend reversal
⚠️ DISCLAIMER
This indicator is provided "as is" for educational purposes only. BucksTRDR is not responsible for trading decisions made using this tool. Always conduct your own research and consult a financial professional before making investment decisions. Past performance does not guarantee future results.

Crypto Schlingel - PVSRA POC EMA Suite v5.903The Chart Indicator Suite combines a wide range of powerful tools that help traders accurately analyze market structures, volatility, and key price zones. With indicators such as POC, pivot points, EMAs, VWAP, Bollinger Bands, and important market levels such as yesterday/weekly high & low, daily open, psy high/low, and ADR, the suite offers a comprehensive overview of trends and market behavior. Supplemented by pvsra candles, long candle detection, and the display of relevant stock market opening hours, it reliably supports traders in making informed trading decisions.
Indicators are configurable
All of the indicators mentioned are fully configurable and can be flexibly adapted to individual trading strategies. Users can freely adjust parameters, display types, and sensitivities to highlight exactly the market information that is relevant to their personal trading style.
The individual fields in the configuration are self-explanatory or are explained in a toolbar, so that the possible settings become clear.
POC
The Point of Control (POC) is a central concept in market profile and volume profile analysis and plays an important role in technical chart analysis. Here is a detailed description of its usefulness and significance:
Definition
The point of control (POC) is the price level at which the most trading volume has taken place within a certain period of time.
It therefore shows the price at which buyers and sellers were most active – the center of market interest.
📊 Use and significance in chart analysis
1. Central support and resistance zone
Since the largest volume was traded at the POC, this price is considered a “fair zone” or equilibrium price.
The market often reacts strongly to the POC:
Above the POC → potential resistance if the price is coming from below.
Below the POC → potential support if the price is falling from above.
Example: If the price returns to the POC, this can be an entry opportunity for traders betting on a market reaction.
2. Interpretation of market acceptance
A price range with high volume (including POC) shows where the market has accepted a fair value.
Low volume, on the other hand, indicates rejection or disinterest.
→ The POC therefore helps to distinguish between accepted price zones and transition areas.
PIVOT POINTS
Pivot points are predefined price levels calculated from the previous day's price data (or a previous time unit).
They help traders identify potential support and resistance zones for the current trading day (or period).
Benefits of pivot points in chart analysis
1. Determining support and resistance areas
The calculated pivot levels (P, S1, S2, R1, R2, etc.) show where the market is likely to react:
Supports (S1, S2, S3) → possible downward turning points.
Resistance (R1, R2, R3) → possible upward turning points.
These zones are often observed by many traders at the same time, making them self-fulfilling marks.
2. Trend determination and market sentiment
If the market opens above the pivot (P) and remains there → signals buying pressure.
If the market trades below the pivot (P) → signals selling pressure.
A break above R1 or below S1 may indicate a strong trend day.
EMA Exponential Moving Average
The EMA is the exponentially weighted moving average of a price.
It shows the average price of a security over a certain period of time, weighted according to recency – that is:
👉 more recent price data has more influence than older data.
This distinguishes it from the simple moving average (SMA), in which all values are weighted equally.
Benefits of the EMA in chart analysis -> Identifying trends
The EMA reacts more quickly to price changes than the SMA and is therefore ideal for:
Identifying trend reversals at an early stage
Confirming trend directions
👉 Rising EMA → Upward trend
👉 Falling EMA → Downward trend
Traders often use combinations such as:
EMA 50 / EMA 200 → Long-term trends
SIGNIFICANCE OF HIGHS AND LOWS
The daily high, daily low, weekly high, and weekly low are objective price zones that show:
Where the market bought (high) or sold (low) the most, and where supply and demand reached their extremes in the past period.
These levels often act as magnetic price zones in ongoing trading, where traders react (entry, profit-taking, or stop setting).
🎯 Use of yesterday's high and low (previous day high/low)
🔹Support and resistance levels
Yesterday's high often acts as resistance when the price comes from below.
Yesterday's low becomes support when the price falls from above.
➡️ Traders watch these levels closely to trade breakouts or reversals.
EMA 9 / EMA 20 → Short-term movements
🎯 Benefits of weekly highs and lows (Weekly High/Low)
Important structural markers in the higher time frame
Weekly highs and lows show medium to long-term market structure.
They are often considered stronger supports/resistances than daily levels.
➡️ For example, if the price breaks above the weekly high, this usually signals institutional interest and may indicate a continuation of the trend.
➡️ Conversely, failure to break above a weekly high may indicate market weakness or a reversal.
DAILY OPEN
The Daily Open is the price at which trading begins on a new day.
It marks the first price after the close of the previous trading session.
👉 In many markets (e.g., Forex, index futures, crypto), this is the starting point of daily price movement, where market direction and sentiment realign.
🎯 Benefits of the Daily Open in chart analysis
Direction indicator (daily bias)
The Daily Open serves as a neutral center line for the current trading day.
Traders use it to assess the market direction (bias):
Price above the Daily Open → bullish day (buyers dominate)
Price below the daily open → bearish day (sellers dominate)
📈 → If the daily open is broken and held above, this indicates upward momentum.
📉 → If it is broken below, this signals weakness.
This simple observation helps traders trade with the daily trend rather than against it.
STOCK MARKET OPENING HOURS
Every major stock exchange has defined trading hours during which institutional capital is active.
Examples (CET):
Asia (Tokyo/ Hong Kong) 1:00 a.m. – 9:00 a.m.
Europe (London/Frankfurt) 08:00 – 17:30
USA (New York) 15:30 – 22:00
Market dynamics change significantly during these time windows, as volume, liquidity, and volatility fluctuate depending on the session.
📈 Benefits in chart analysis
🔹Recognizing volatility and liquidity phases
At the start of a session (e.g., 9:00 a.m. in Frankfurt or 3:30 p.m. in New York), trading volume rises sharply.
This results in strong movements, often with changes in direction or breakouts.
👉 These phases are particularly suitable for:
Breakout strategies
Volume or momentum trades
Example:
If an index (e.g., DAX or S&P 500) reacts strongly at the US opening, this indicates institutional activity that may shape the rest of the day.
PSY HIGH AND PSY LOW
Psy High and Psy Low stand for:
Psychological High → the psychologically significant upper price level of a particular range
Psychological Low → the psychologically significant lower price level
These are often round numbers or striking price zones that market participants unconsciously use as a guide.
Examples:
For EUR/USD: 1.0500, 1.1000, 1.1500
For DAX: 17,000, 17,500, 18,000
For BTC/USD: 60,000, 65,000, 70,000
Traders also refer to such levels as “big figures” or “round numbers.”
📊 Why are psy levels so important?
Because they are based on human perception and market psychology:
👉 People think in round numbers, not in decimals such as 1.1037 or 17.264.
That's why:
Private investors often place their stop losses or take profits just above or below these levels, Institutional traders place large limit orders in these zones, and Algorithms react to the liquidity created there.
→ This results in increased volume, reaction patterns, and price movements at these levels.
ADR (Average Daily Range)
The ADR measures the average daily trading range of a market over a specific period of time – i.e., how many points, pips, or dollars the price typically moves per day.
Example:
If the DAX has moved an average of 180 points per day over the last 14 days, the ADR(14) = 180.
🎯 The benefits of ADR in chart analysis
🔹 Assessment of daily volatility
The ADR shows how much a market typically moves per day.
→ This allows you to see whether the current day is more volatile or calmer than normal.
Interpretation – Meaning
Current range < ADR
→ Market is still moving within normal limits → Potential for further movement
Current range ≈ ADR
→ Daily target largely achieved → lower probability of significant expansion
Current range > ADR
→ Market overextended → increased probability of correction or consolidation
👉 This helps you to plan entries, price targets, and stops realistically.
VWAP (Volume Weighted Average Price)
The VWAP is the volume-weighted average price of a security for a specific period of time – usually per day.
👉 Unlike a simple moving average (e.g., EMA), the VWAP takes into account how much was actually traded – not just where the price was.
It therefore reflects the fair market value, taking into account the trading volume.
🎯 Benefits of VWAP in chart analysis
🔹 Determining the fair average price
The VWAP shows where the majority of the trading volume took place – i.e., the price that the majority of market participants actually paid.
➡️ This is the “fair price of the day.”
Price above VWAP → buyers dominate (bullish)
Price below VWAP → sellers dominate (bearish)
This information is particularly valuable for determining the intraday bias (direction of the day).
BOLLINGER BANDS
Bollinger Bands consist of three lines based on a moving average (usually SMA 20):
Middle band:
→ usually the 20-period SMA (simple moving average)
Upper band:
→ SMA + (2 × standard deviation)
Lower band:
→ SMA − (2 × standard deviation)
👉 This means that the bands “breathe” with volatility – they widen when the market is volatile and contract when the market is calm.
🎯 The benefits of Bollinger Bands in chart analysis
🔹 Measuring market volatility
The main function of Bollinger Bands is to visualize the volatility of a market:
Wide bands → high volatility → strong movement/trend phase
Narrow bands → low volatility → calm market/consolidation
📈 When the bands contract sharply (“Bollinger squeeze”) → often a harbinger of an impending breakout.
KAMA
The KAMA was developed by Perry J. Kaufman.
Unlike normal moving averages such as SMA or EMA, it dynamically adjusts its smoothing to market conditions:
Low volatility / strong trend → reacts faster to price movements
High volatility / sideways movement → reacts slower, reduces false signals
The core idea: adaptability instead of rigid smoothing.
🎯 Benefits of KAMA in chart analysis
🔹 Filtering out market noise
KAMA smooths out unnecessary price fluctuations (noise) that many normal indicators mistakenly interpret as signals.
➡️ This minimizes false signals in sideways phases, while real trends remain visible.
EXTRA LARGE WICKS
A wick (or wick) is the thin line above or below the candle body:
Top → Highest price during the period
Bottom → Lowest price during the period
Long wick → Significant rejection of the price at this extreme zone
Example: A long upper wick means that the price rose high but was then pushed back sharply.
🎯 Benefits of long wicks in chart analysis
🔹 Recognizing rejections and resistance
Long upper wick: Sellers did not allow the higher price → possible downward reversal
Long lower wick: Buyers defended the lower price → possible upward reversal
💡 The market “speaks” through these wicks: It shows where buyers or sellers are not giving in any further.

Jet Stream V1Jet Stream catches the trends. Forgets the noise and allows you to lock into those big moves.
Wed, Nov 19 2025 V3 - Everything but alerts work.