TradeChartist Fib Master™TradeChartist Fib Master is a versatile Fibonacci Support and Resistance indicator that can be used to plot Automatic Levels and Fibonacci Levels based on a variety of ways from the settings, including Auto Fibs plot by connecting to an external indicator.
===================================================================================================================
What does ™TradeChartist Fib Master do?
Plots Automatic Levels without the need for user input
Plots 3 types of Fibonacci Levels
════ 1. Auto-Fibs (by connecting to an external indicator - Oscillatory or non-Oscillatory)
════ 2. Fibs based on Lookback (Lookback type - Candles or Days)
════ 3. Fibs based on Price Input
===================================================================================================================
Detailed description of ™TradeChartist Fib Master features
╔══ Automatic Levels Generator ══╗
Enabling Plot Automatic Levels plots support and resistance levels automatically without any input from the user other than preferred levels plot from the indicator settings namely,
Plot Local Levels for Lower TF - Plots all important Support/Resistance levels for mostly smaller time frames (can be used for up to 1hr in most cases). Recommended for Scalping/Swing Trading mostly dependent on volatility.
Plot Local Levels for Higher TF - Plots all important Support/Resistance levels inferred from mostly time frames - Short to Mid term outlook.
Plot Extended Levels for Higher TF - Plots all important Support/Resistance levels inferred from very higher time frames - Mid to Long term outlook.
Use Trading View Data Window to make effective use of the levels.
Tip: Add a duplicate Fib Master indicator to chart, use Automatic Levels Generator and increase transparency of Fib colours to 100. This helps view the levels on Data Window while having the Fib plots on chart.
Note: Uncheck Plot Automatic Levels to enable Fibonacci plots from Fibonacci Levels Generator
╔══ Fibonacci Levels Generator ══╗
════ 1. Auto-Fibs ════
Almost any indicator plot or Signal (Oscillatory or non-Oscillatory) can be connected to Fib Master to generate automatic fib levels. This is done by automatically detecting the price trend based on the connected indicator, its corresponding highest high and lowest low prices of each trend.
Also, Fib Master plots Bull (default - green) and Bear (default - red) Zones background including the signal candle (default - orange), where the trend changes based on the connected indicator Signal. This helps detect the effectiveness of the connected indicator Signal too, as too many unproductive signals from the connected indicator will create numerous Bull and Bear Zones (which also will render the Auto-Fibs ineffective).
To connect an external indicator Signal, just choose the corresponding Signal plot from the Plug Indicator Here dropdown from settings and choose whether the connected signal is Oscillatory (for Oscillators like RSI, CCI, MACD, Trend Identifier signals from more complex indicators like ™TradeChartist Bollinger Bands and Donchian Channels Pro etc.) or non-Oscillatory (for plots like Moving Averages, Super Trend, Ichimoku plots like Kijun Sen etc.)
If the connected Signal is Oscillatory, enter the filter levels. Default is 0 for both fields as most Oscillators have 0 as their mean reversal zone. For Oscillators like RSI, 60/40, 50/50, 55/45 etc. can be used.
Note: Please test the performance and effectiveness of Auto-Fibs of connected Signal first before using it for trades.
════ 2. Fibs based on Lookback ════
Lookback type - Candles
Determines the High and Low price of the user input number of Candles back (100 default) and plots Fibonacci Levels based on the calculated High and Low for the number of candles in the past from the current candle. The levels stay intact on any time frame as long as no new Highs or Lows are formed.
Lookback type - Days
Determines the High and Low price of the user input number of Days back (100 default) and plots Fibonacci Levels based on the calculated High and Low for the number of days in the past from the day of the current bar. The levels stay intact on any time frame as long as no new Highs or Lows are formed.
════ 3. Fibs based on Price Input ════
Plots Fibonacci Levels based on the user specified High and Low Price in the settings input fields. The levels stay intact on any time frame irrespective of new Highs or Lows being formed. Manual Price Input will enable the trader to keep the Levels intact and visually see the higher Fibonacci Retracement levels, when the price crosses beyond 100% retracement. On the other two lookback types, the Fibonacci levels are displayed only upto 100% retracement.
===================================================================================================================
Note: Show Auto-Fibs from current High/Low
When this option is chosen from indicator settings, the Auto-fib levels are drawn from the highest high of the trending price direction to lowest low of last trend for uptrend or vice-versa for downtrend.
===================================================================================================================
Extra Features
The Fibonacci levels can also be reversed by enabling Reverse Fibonacci Levels option from the settings.
0.886 and 1.113 Fib levels can be plotted on chart by enabling Show 0.886 and 1.113 Fibs from settings, as these are important levels for harmonic pattern traders.
Fib Line and Label Style including Color, transparency, size etc. can be changed from settings based on user preference.
===================================================================================================================
Example Charts
XAU-USD Gold Daily chart using Automatic Levels Generator with Zones identified when connected to external indicator
BTC-USDT Daily chart using Automatic Levels Generator
SPX 1hr chart using Automatic Levels Generator
ETH-USDT 1hr chart using AutoFibs generated by connecting Fib Master to RSI with 60/40 Filter levels
XAG-USD (Silver) 1hr chart using Fibonacci Levels based on lookback
===================================================================================================================
Best Practice: Test with different settings first using Paper Trades before trading with real money
===================================================================================================================
This is not a free to use indicator. Get in touch with me (PM me directly if you would like trial access to test the indicator)
Premium Scripts - Trial access and Information
Trial access offered on all Premium scripts.
PM me directly to request trial access to the scripts or for more information.
===================================================================================================================
Линии Фибоначчи

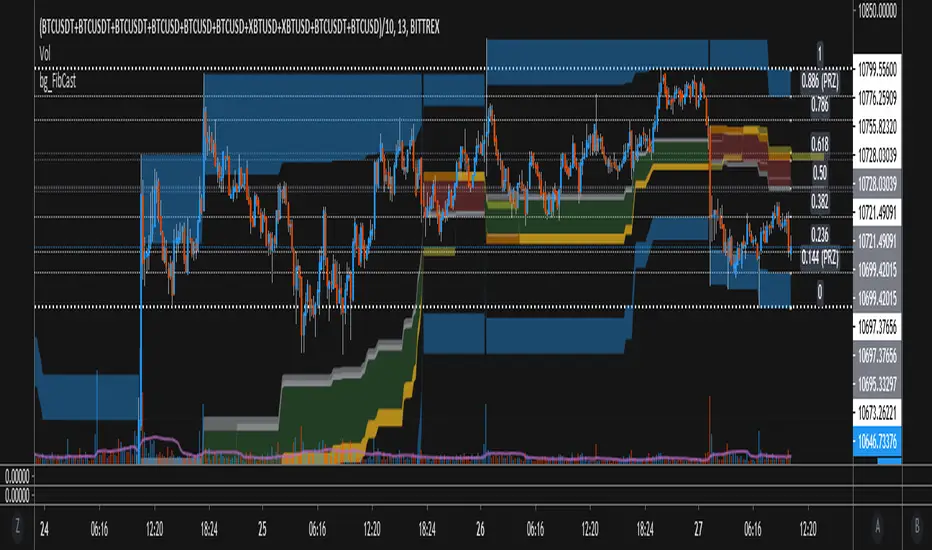
bgeraghty_FibCastThis script draws a High-To-Low or Low-To-High Fibonacci Retrace over the chart, based on which of those two happens in the given time period (Default is 144 Candles).
Updates from older versions:
- Paints 0.5, 0.618, 0.65 and spaces in between, giving good hindsight to the trend, and ideas of where strong support/resistance may lie.
- Silver Paint Strip = 0.50 retrace, Gold = 0.618-0.65, and the Red/Green between indicates the direction of the (Fib) Trend as H->L or L->H
- Paints 0.144 and 0.886 ranges Blue, and these are typically extremes or possible reversal zones. (PRZ)
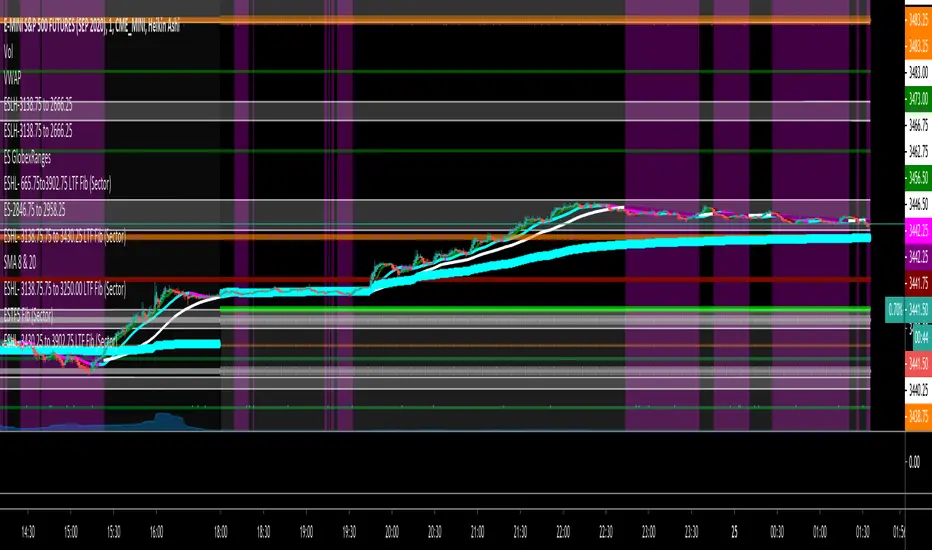
Fibonacci Disciples Auto Levels (ES/NQ/GC/NQ WIDE) - APPROVEDPVTEvery Index, every ETF , every sector started somewhere.
That starting point defines Zones that follow that Index, or ETF forever.
What i am saying is - everything you are trading has a pre-defined range of movement that was established when the stock Index became available to the market.
It is this range that defines specific levels that will always play a significant part in the movement of that stock, or Index for its entire lifespan.
This script will automatically multiply that original price range to the stock or index’s current real time value using Fibonacci sequence and a proprietary pre-calculated Fibonacci formula to draw custom Golden Ratios on your chart in real-time. Each gold line represents a new “Golden Ratio” that is, or has already emerged as price moves up and down.
This phenomenon becomes possible by sealing the gaps between Fibonacci Fractal retracements making each gold line a measured .618:1.618 Golden Ratio.
Having these unique Golden Ratios displayed automatically on your chart allows you as the Trader to always have a price target in mind rather than having to guess where price might be headed on a naked chart.
From there you are welcome to add your favorite moving average or any other tool you wish to help determine the overall direction of the trend whilst using these Golden Ratio targets for scalping opportunities. If you do not know how to identify fractal W’s and M’s may I suggest you utilize a public Williams Fractal tool to accompany this indicator script.
Due to the scalping nature of this tool it will be best used on all time frames from 1min up to 4hrs.
Each measured line is customizable to your liking. If you wish to see less you can unclick individual measurements. I suggest leaving the “Baseline” and each “.618%” line active.
You can also change the color of the lines if you wish.
If you would like access to this script you can either DM me on TradingView

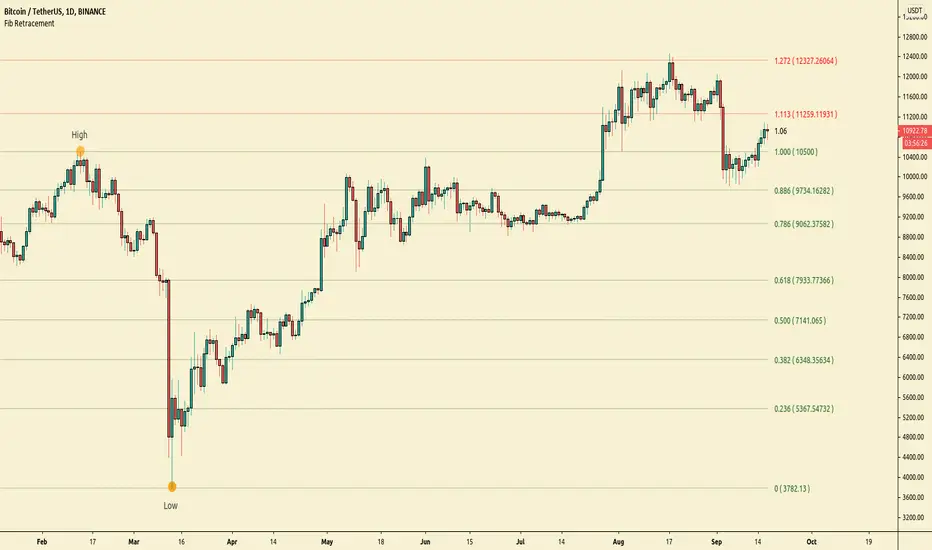
All time Fibonacci RetracementThis script calculates and plots the All time Fibonacci Retracement of the chart.
It's based on the ATH (All Time High) and the ATL (All Time Low).
Made simple, you can choose which levels you wanna plot in the parameters menu.
Enjoy !

Support Resistance - Dynamic v2Hello Traders!
After the addition of "Arrays" to the Pine, I developed new and improved version of Support Resistance - Dynamic script as version 2. In this script Arrays were used. This can be used as Support Resistance tool, also it will be an example for the people who want to learn Array usage in Pine. Many thanks to Pine Team for adding Arrays!
The script finds the Pivot Points and check them in channels if there can be S/R or not, and draws mid line of the channel as S/R line. you can set number of PPs and channel width in the options. Each channel width is optimized dynamically according to Pivot Points. Also you can choose " High/Low " or " Close/Open " as source for Pivot Points.
There is an option for maximum number of S/R levels. S/R levels are found and sorted dynamically and number of S/R lines with enough strength changes dynamically.
Some other options for coloring and line width. (Solid, Dashed or Dotted)
S/R levels are shown in the Labels and Label colors are changed automatically, if S/R line is below the closing price then it's color is Green (as Support), otherwise its color is Red (as Resistance).
Examples:
Enjoy!

TMsignal - Auto Fibonacci V1.0TMSignal Auto Fibonacci V1.0: Automatically calculates the Fibonacci Retracement + Extension of 161.8% in order to always have it plotted in a "millimeter" way.
At the same time, it allows viewing or removing the different levels, so that each one can be configured as desired.
We hope you like it! Contact us any question or improvement suggestions.

Automatic Fibonacci Retracements [MS]Automatic Fibonacci Retracement Level indicator for any time frame, any asset.
Simple to use, just add to your chart and set the size of retracements you want to see.
Fib levels keep drawing in real time until the next low or high is found to start drawing the next fib.
Settings Include
• Fib size
• Show prices
• Draw low-to-high or high-to-low
• Toggle fib levels
Use the link below or PM us to obtain access to this indicator.

Fibonacci ClusterFibonacci Cluster can be used for live day-trading to anticipate possible movements.
Ever line is a Support and Resistance level.
Median = Middle Line
R1 & R2 and S1 & S2 are possible reversal zones.
Upper Limit and Lower Limit are stronger levels.
Conditions:-
If the Lower Limit line is horizontal and the stock is moving upwards along with the Upper Limit Line, such movements indicates bullish trend.
If the Upper Limit line is horizontal and the stock is moving downwards along with the Lower Limit line, such movements indicates bearish trend.
If the price of a stock is at Upper Limit and still moving upwards along with the Upper Limit line, such movements indicates strong bullish trend.
If the price of a stock is at Lower Limit and still moving downwards along with the Lower Limit line, such movements indicates strong bearish trend.
When the cluster in expanding outwards in both directions, such movements indicates increase in volatility. The trend is strong.
When the cluster is contracting inwards from both direction, such movements indicates that the stock will now move sideways.

DTC_ZoneThis Indicator can be used for finding the supply and demand zone. Supply and demand has been fetched from the past 10 days volatility of the particular stock. And the main thing is the target and stop-loss were arrived based on the Fibonacci retracement.

FIB Extensions and RetracmentsA second version of an already published indicator by me.
This Indicator will help you find price levels for the short term instead of long term.
The indicator analyzes short term closing prices( Two days data) . It calculates extensions and retracement.
If you are a Forex trader, add zero to the variable in the input section.
The indicator does not specify tops or bottoms.
When you apply it to your chart, uncheck all the boxes(levels and mids) and keep the plots. this will make it zoomed in without compressing the whole chart.
If you are interested, please send me private message.

Trend Following with Moving AveragesHello Traders,
With the info "Trend is Your Friend ", you should not take position against the trend. This script checks multipte moving averages if they are above/below the closing price and try to find trend. The moving averages with the length 8, 13, 21, 34, 55, 89, 144, 233, 377 used. these are fibonacci numbers, but optionally you can change the lengths of each moving averages. while it's green you better take long positions, while it's red you better take short positions according to other indcators or tools.
Optionally you have "smoothing" option to get rid of whipsaws. it's enabled by default.
You have option to use following moving average types: EMA, SMA, RMA, WMA, VWMA. by default it's EMA
Also the script has "Resolution" option. with this option you can get the trend for other time frames, in following example 1h was set as for higher time frame on 15m chart:
This should not be used as buy/sell signal indicators as it's tries to find trend but not entry points, you should use other indicators (such RSI, Momentum) or other tools to find buy/sell signals.
Enjoy!

FIB Extensions and RetracmentsThis Indicator will help you find price levels.
The indicator analyzes yearly closing prices . It calculates extensions and retracement.
If you are a Forex trader, add zero to the variable in the input section.
The indicator does not specify tops or bottoms.
When you apply it to your chart, uncheck all the boxes(levels and mids) and keep the plots. this will make it zoomed in without compressing the whole chart.
If you are interested, please send me private message.

GC-ShorterTimeFrame (STF) (GC)This is a fractal version of the higher time frame Fib for GC . This is a Shorter Time Frame Fib level indicator. To be used with Longer Time frame Indicator. Though it can be used independently. It shows where the market is looking to go and where it has been. When the market get above one level ( white bar, for example) look for price action to continue to the next level (white bar). If it breaks below the white bar look for price action to go the next level below for support. It is fractal in nature. It is fib levels inside longer time frame fib levels. I hope it will impress! More importantly I hope you can make some money! It is great for having targets and support levels. It helps in knowing why the market may continue in a direction. For example: When the price action has already moved up, why does it keep going up, because it hasn't reached targeted fib level, yet. Same reason price action may move lower once it breaks a particular level. It is looking for its fib level support. I know Gold is in the spot light now...as most of the time. This should help trade smaller time frames. If it drops below or goes above this range I can publish more levels..just ask if I forget. Thx

GC-LongerTimeFrame (LTF) - Maroon, Green, Black/White (GC)Let's bring GOLD to life here! Tis the season...like always for gold. This is a Longer Time Frame Fib level indicator. To be used with Longer Time frame Indicator. Though it can be used independently. It shows where the market is looking to go and where it has been. When the market get above one level ( white bar, for example) look for price action to continue to the next level (white bar). If it breaks below the white bar look for price action to go the next level below for support. It is fractal in nature. It is fib levels inside longer time frame fib levels. I hope it will impress! More importantly I hope you can make some money! It is great for having targets and support levels. It helps in knowing why the market may continue in a direction. For example: When the price action has already moved up, why does it keep going up, because it hasn't reached targeted fib level, yet. Same reason price action may move lower once it breaks a particular level. It is looking for its fib level support. I will add this as well. the third white bar is a reversal bar. If it breaks the top it wants to continue onward. The first white bar is a pullback bar to the bar below that is between the green bars (unless market is actively riding the 8 sma)

ES-3430.25 to 3902.75 ShorterTimeFrame (STF) This is a Shorter Time Frame Fib level indicator. To be used with Longer Time frame Indicator. Though it can be used independently. It shows where the market is looking to go and where it has been. When the market get above one level ( white bar, for example) look for price action to continue to the next level (white bar). If it breaks below the white bar look for price action to go the next level below for support. It is fractal in nature. It is fib levels inside longer time frame fib levels. I hope it will impress! More importantly I hope you can make some money! It is great for having targets and support levels. It helps in knowing why the market may continue in a direction. For example: When the price action has already moved up, why does it keep going up, because it hasn't reached targeted fib level, yet. Same reason price action may move lower once it breaks a particular level. It is looking for its fib level support.
NQ-ShorterTimeFrame (STF) - Maroon, Green, Black/White (NQ)This is a Shorter Time Frame Fib level indicator. To be used with Longer Time frame Indicator. Though it can be used independently. It shows where the market is looking to go and where it has been. When the market get above one level ( white bar, for example) look for price action to continue to the next level (white bar). If it breaks below the white bar look for price action to go the next level below for support. It is fractal in nature. It is fib levels inside longer time frame fib levels. I hope it will impress! More importantly I hope you can make some money! It is great for having targets and support levels. It helps in knowing why the market may continue in a direction. For example: When the price action has already moved up, why does it keep going up, because it hasn't reached targeted fib level, yet. Same reason price action may move lower once it breaks a particular level. It is looking for its fib level support.

NQ-ShorterTimeFrame2 (STF2) - Maroon, Green, Black/White (NQ)This is a Shorter Time Frame Fib level indicator. To be used with Longer Time frame Indicator. Though it can be used independently. It shows where the market is looking to go and where it has been. When the market get above one level ( white bar, for example) look for price action to continue to the next level (white bar). If it breaks below the white bar look for price action to go the next level below for support. It is fractal in nature. It is fib levels inside longer time frame fib levels. I hope it will impress! More importantly I hope you can make some money! It is great for having targets and support levels. It helps in knowing why the market may continue in a direction. For example: When the price action has already moved up, why does it keep going up, because it hasn't reached targeted fib level, yet. Same reason price action may move lower once it breaks a particular level. It is looking for its fib level support.


Simple Fibonacci RetracementSimple Fibonacci Retracement is a free and easy to use script to plot Fibonacci levels, for any assets like Stocks, Forex, Commodities , Cryptocurrencies etc. on any time frame chart.
Fibonacci Levels can be plotted using Lookback or manual Price input from the settings.
1. Lookback type - Candles
Determines the High and Low price of the user input number of Candles back (100 default) and plots Fibonacci Levels based on the calculated High and Low for the number of candles in the past from the current candle. The levels stay intact on any time frame as long as no new Highs or Lows are formed.
2. Lookback type - Days
Determines the High and Low price of the user input number of Days back (100 default) and plots Fibonacci Levels based on the calculated High and Low for the number of days in the past from the day of the current bar. The levels stay intact on any time frame as long as no new Highs or Lows are formed.
3. Manual Price Input
Plots Fibonacci Levels based on the user specified High and Low Price in the settings input fields. The levels stay intact on any time frame irrespective of new Highs or Lows being formed. Manual Price Input will enable the trader to keep the Levels intact and visually see the higher Fibonacci Retracement levels, when the price crosses beyond 100% retracement. On the other two lookback types, the Fibonacci levels are displayed only upto 100% retracement.
The Fibonacci levels can also be reversed by enabling 'Reverse' option from the settings.
Fibs, Pivots & SupportA 3-in-1 indicator for displaying Fibonacci retracement and pivot levels over custom periods along with areas of previous major support. Each of the three tools can be toggled on/off.
Used properly, these should give you a better idea of where to place orders and take profit.
Alerts are built in but had to remain somewhat generic due to data point limitations. There are alerts for crossing and crossing up/down over each category of line.

HFT Fibonacci Bands BacktesterDefault Settings are meant to be used in XBT/USD chart on 15 min time frame. If you want to use for another asset on another time frame YOU MUST CHANGE THE SETTINGS
This is a Fibonacci bands based trading strategy developed by HFT Research. It is a highly customizable strategy and provides endless opportunities to find profitable trades in the market.
Use Fib BB
This is the main decision maker of the strategy. Tuning the settings of this portion of the strategy will change the outcome the most. We have provided default settings. However, they are only good for 15min chart on Bitcoin . Please adjust accordingly.
Fib BB Length: This setting adjusts the middle line of your Fibonacci Bands. It is the moving average that you take it as base for your Fibonacci bands. Default value is currently 20.
Fib Level to Use for Entry: Here, you adjust which one of the Fibonacci Ratio levels you would like to use for your entry. You can only choose one of the following options.
Fibonacci Ratio 1
This is your Fib ratio level 1 and you can put any number here you would like
Fibonacci Ratio 2
This is your Fib ratio level 2 and you can put any number here you would like
Fibonacci Ratio 3
This is your Fib ratio level 3 and you can put any number here you would like
Please keep in mind that Ratio 1 should be higher than Ratio 2 and Ratio 2 should be higher than Ratio 3.
Use RSI
You can also turn on and off the RSI as well. Alternatively, there is an option to use RSI on a different time frame than you are currently on. For example, if you are looking at the 5min chart to use Bollinger bands but you would like to look at the RSI value on the 15min chart. You can do so by selecting the custom RSI timeframe as well as adjusting the Oversold and Overbought value.
Use CCI
Commodity Channel Index is an indicator developed by Donald Lambert. It is a momentum-based oscillator used to help determine when an investment vehicle is reaching conditions of being overbought or oversold. It also used to asses price trend direction and strength. Default settings are usually the safest and the best fit.
Use VWAP
VWAP stands for volume weighted average price . It is an extremely useful indicator when trading intra-day. It does reset every trading session which is at 00:00 UTC . Instead of looking at x number of candles and providing an average price, it will take into consideration volume that’s traded at a certain price and weigh it accordingly.
Use ADX
ADX stands for average directional index . It is an indicator that measures volatility in the market. Unfortunately, the worst market condition for this strategy is sideways market. ADX becomes a useful tool since it can detect trend. If the volatility is low and there is no real price movement, ADX will pick that up and will not let you get in trades during a sideways market. It will allow you to enter trades only when the market is trending.
Use MA Filters
Lookback: It is an option to look back x number of candles to validate the price crossing. If the market is choppy and the price keeps crossing up and down the moving average you have chosen, it will generate a lot of “noisy” signals. This option allows you to confirm the cross by selecting how many candles the price needs to stay above or below the moving average. Setting it 0 will turn it off.
MA Filter Type: There is a selection of moving averages that is available on TradingView currently. You can choose from 14 different moving average types to detect the trend as accurate as possible.
Filter Length: You can select the length of your moving average. Most commonly used length being 50,100 and 200.
Filter Type: This is our propriety smoothing method in order to make the moving averages lag less and influence the way they are calculated slightly. Type 1 being the normal calculation and type 2 being the secret sauce
Reverse MA Filter: This option allows you to use the moving average in reverse. For example, the strategy will go long when the price is above the moving average. However, if you use the reserve MA Filter, you will go short when the price is above the moving average. This method works best in sideways market where price usually retraces back to the moving average. So, in an anticipation of price reverting back to the moving average, it is a useful piece of option to use during sideway markets.
The backtester assumes the following;
- 1000$ capital
- 0.06% commission based on binance
- 1% risk meaning 100% equity on cross leverage
- Backtest results are starting from 2020
If you want to get access to this indicator please DM me or visit our website.

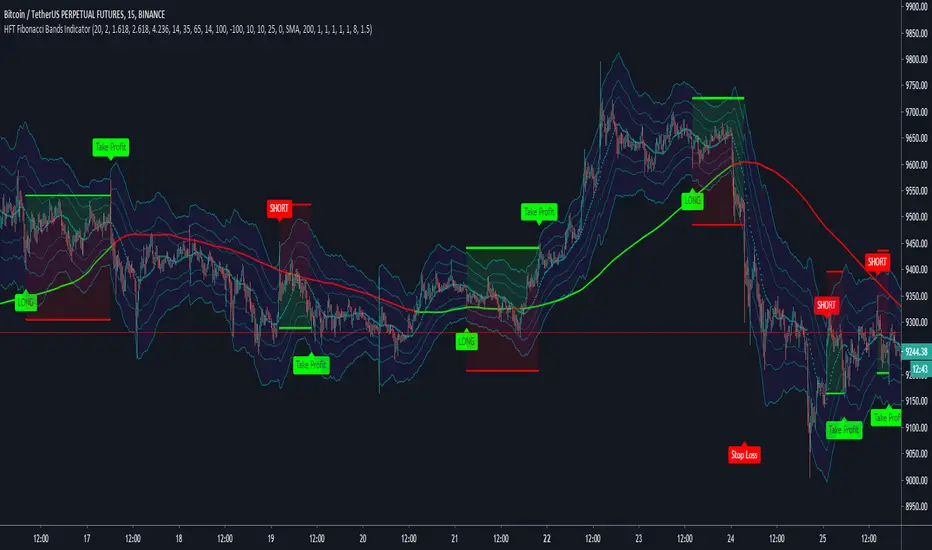
HFT Fibonacci Bands Indicator
Default Settings are meant to be used in XBT/USD chart on 15 min time frame. If you want to use for another asset on another time frame YOU MUST CHANGE THE SETTINGS
This is a Fibonacci bands based trading indicator developed by HFT Research. It is a highly customizable indicator and provided endless opportunities to find profitable trades in the market.
Use Fib BB
This is the main decision maker of the strategy. Tuning the settings of this portion of the strategy will change the outcome the most. We have provided default settings. However, they are only good for 15min chart on Bitcoin. Please adjust accordingly.
Fib BB Length: This setting adjusts the middle line of your Fibonacci Bands. It is the moving average that you take it as base for your Fibonacci bands. Default value is currently 20.
Fib Level to Use for Entry: Here, you adjust which one of the Fibonacci Ratio levels you would like to use for your entry. You can only choose one of the following options.
Fibonacci Ratio 1
This is your Fib ratio level 1 and you can put any number here you would like
Fibonacci Ratio 2
This is your Fib ratio level 2 and you can put any number here you would like
Fibonacci Ratio 3
This is your Fib ratio level 3 and you can put any number here you would like
Please keep in mind that Ratio 1 should be higher than Ratio 2 and Ratio 2 should be higher than Ratio 3.
Use RSI
You can also turn on and off the RSI as well. Alternatively, there is an option to use RSI on a different time frame than you are currently on. For example, if you are looking at the 5min chart to use Bollinger bands but you would like to look at the RSI value on the 15min chart. You can do so by selecting the custom RSI timeframe as well as adjusting the Oversold and Overbought value.
Use CCI
Commodity Channel Index is an indicator developed by Donald Lambert. It is a momentum-based oscillator used to help determine when an investment vehicle is reaching conditions of being overbought or oversold. It also used to asses price trend direction and strength. Default settings are usually the safest and the best fit.
Use VWAP
VWAP stands for volume weighted average price. It is an extremely useful indicator when trading intra-day. It does reset every trading session which is at 00:00 UTC. Instead of looking at x number of candles and providing an average price, it will take into consideration volume that’s traded at a certain price and weigh it accordingly.
Use ADX
ADX stands for average directional index. It is an indicator that measures volatility in the market. Unfortunately, the worst market condition for this strategy is sideways market. ADX becomes a useful tool since it can detect trend. If the volatility is low and there is no real price movement, ADX will pick that up and will not let you get in trades during a sideways market. It will allow you to enter trades only when the market is trending.
Use MA Filters
Lookback: It is an option to look back x number of candles to validate the price crossing. If the market is choppy and the price keeps crossing up and down the moving average you have chosen, it will generate a lot of “noisy” signals. This option allows you to confirm the cross by selecting how many candles the price needs to stay above or below the moving average. Setting it 0 will turn it off.
MA Filter Type: There is a selection of moving averages that is available on TradingView currently. You can choose from 14 different moving average types to detect the trend as accurate as possible.
Filter Length: You can select the length of your moving average. Most commonly used length being 50,100 and 200.
Filter Type: This is our propriety smoothing method in order to make the moving averages lag less and influence the way they are calculated slightly. Type 1 being the normal calculation and type 2 being the secret sauce.
Reverse MA Filter: This option allows you to use the moving average in reverse. For example, the strategy will go long when the price is above the moving average. However, if you use the reserve MA Filter, you will go short when the price is above the moving average. This method works best in sideways market where price usually retraces back to the moving average. So, in an anticipation of price reverting back to the moving average, it is a useful piece of option to use during sideway markets.
If you want to get access to this indicator please DM me or visit our website.
Fibonacci MTFi just made Fibonacci which you can change MTF
Defalt is Daily but you can choose other time, the Fibonacci for the previous time period will be displayed.
I hope that it will be help someoen :)
MTF付のフィボナッチを作ってみました。
ご意見等あればコメントください
