Quality-Controlled Trend StrategyOverview
This strategy demonstrates a clean, execution-aware trend framework with fully isolated risk management.
Entry conditions and risk logic are intentionally separated so risk parameters can be adjusted without altering signal behavior.
All calculations are evaluated on confirmed bars to ensure backtest behavior reflects real-time execution.
Design intent
Many scripts mix entries and exits in ways that make results fragile or misleading.
This strategy focuses on structural clarity by enforcing:
confirmed-bar logic only
fixed and transparent risk handling
consistent indicator calculations
one position at a time
It is intended as a baseline framework rather than an optimized system.
Trading logic (high level)
Trend context
EMA 50 vs EMA 200 defines directional bias
Entry
Price alignment with EMA 50
RSI used as a momentum confirmation, not as an overbought/oversold signal
Risk management
Stop-loss based on ATR
Fixed risk–reward structure
Risk logic is isolated from entry logic
Editing risk without affecting signals
All stop-loss and take-profit calculations are handled in a dedicated block.
Users can adjust:
ATR length
stop-loss multiplier
risk–reward ratio
without modifying entry conditions.
This allows controlled experimentation while preserving signal integrity.
Usage notes
Results vary by market, timeframe, and volatility conditions.
This script is provided for testing and educational purposes and should be validated across multiple symbols and forward-tested before use in live environments.
Following

LogTrend Retest EngineLogTrend Retest Engine (LTRE)
LogTrend Retest Engine (LTRE) is an advanced trend-continuation overlay designed to identify high-probability breakout retests using logarithmic regression , volatility-adjusted deviation bands , and market regime filtering .
Unlike traditional channels or moving averages, LTRE models price behavior in log space , allowing it to adapt naturally to exponential market moves common in crypto, indices, and long-term trends.
🔹 How It Works
Logarithmic Regression Core
Performs linear regression on log-transformed price and time
Produces a structurally accurate trend midline that scales with price growth
Volatility-Adjusted Deviation Bands
Dynamic upper and lower zones based on statistical deviation
ATR weighting expands or contracts bands as volatility changes
Adaptive Lookback (Optional)
Automatically adjusts regression length using volatility pressure
Faster response in high-volatility environments, smoother in consolidation
🔹 Market Regime Detection
LTRE actively filters conditions using:
R² trend strength (trend quality, not just slope)
Volatility compression vs expansion
User-defined minimum trend strength threshold
Signals are disabled during ranging or low-quality conditions .
🔹 Breakout → Retest Signal Logic
LTRE does not chase breakouts.
Signals trigger only when:
1. Price breaks cleanly outside the deviation band
2. Market regime is confirmed as trending
3. Price performs a controlled retest within a user-defined tolerance
BUY
Break above upper band → retest → trend confirmed
SELL
Break below lower band → retest → trend confirmed
This structure is designed to reduce false breakouts and late entries.
🔹 Visual & Projection Tools
Clean midline and deviation bands
Optional filled zones
Optional future trend projection for forward structure planning
On-chart statistics for trend strength and volatility compression
🔹 Best Use Cases
Trend continuation & pullback strategies
Crypto, Forex, Indices, and equities
Works best on 15m and higher timeframes
⚠️ Disclaimer
LTRE is a decision-support tool , not a complete trading system. Always use proper risk management and confirm signals with additional structure, volume, or higher-timeframe context.
Built for traders who wait for structure — not noise.

EDUVEST UTBOT ADJ - Adaptive ATR Trailing StopEDUVEST UTBOT ADJ - Adaptive ATR Trailing Stop with Session-Based Sensitivity
━━━━━━━━━━━━━━━━━━━━━━━━━━━━━━━━━━━━━━━━━━━━━━━━
█ ORIGINALITY
This indicator is an enhanced version of the classic UT Bot concept, featuring automatic session-based ATR sensitivity adjustment. Unlike the original UT Bot which uses a fixed sensitivity value, this version dynamically adapts to different trading sessions (Tokyo, London, New York) and automatically detects asset characteristics to optimize signal generation.
━━━━━━━━━━━━━━━━━━━━━━━━━━━━━━━━━━━━━━━━━━━━━━━━
█ WHAT IT DOES
- Generates BUY and SELL signals based on ATR trailing stop crossovers with a moving average
- Automatically adjusts sensitivity based on current trading session (Tokyo/London/NY)
- Auto-detects asset type and applies optimized parameters for each instrument
- Displays real-time session information and volatility status
- Provides alert functionality with customizable cooldown periods
━━━━━━━━━━━━━━━━━━━━━━━━━━━━━━━━━━━━━━━━━━━━━━━━
█ HOW IT WORKS
【Core Logic: ATR Trailing Stop】
The indicator calculates an ATR-based trailing stop using the formula:
Trailing Stop = Price ± (Sensitivity × ATR)
When price is above the trailing stop and rising, the stop trails below price.
When price is below the trailing stop and falling, the stop trails above price.
【Signal Generation】
- BUY Signal: Price crosses above the trailing stop AND Moving Average crosses above the trailing stop
- SELL Signal: Price crosses below the trailing stop AND Moving Average crosses below the trailing stop
【Session-Based Sensitivity Adjustment】
The indicator adjusts ATR sensitivity based on trading session (JST timezone):
- Tokyo (08:00-15:00): Lower sensitivity (reduced by adjustment value) - typically quieter markets
- London (15:00-23:00): Base sensitivity - moderate volatility
- New York (23:00-08:00): Higher sensitivity (increased by adjustment value) - higher volatility
【Dynamic ATR Adjustment】
When enabled, the indicator compares current ATR to its smoothed average:
- ATR Ratio = Current ATR / SMA(ATR, smoothing period)
- Volatility Multiplier = 1.0 + (Sensitivity × (2.0 - ATR Ratio))
This reduces sensitivity during high volatility (fewer false signals) and increases sensitivity during low volatility (faster response).
【Auto Asset Detection】
The indicator automatically detects the traded instrument and applies optimized parameters:
- Stable pairs (USDJPY, EURUSD, USDCHF): Base sensitivity 1.5-1.8
- Moderate pairs (AUDUSD, USDCAD, EURJPY): Base sensitivity 2.0-2.3
- Volatile pairs (GBPUSD): Base sensitivity 2.8
- Commodities (GOLD/XAUUSD): Base sensitivity 3.5
- Indices (NASDAQ/NAS100): Base sensitivity 4.0
━━━━━━━━━━━━━━━━━━━━━━━━━━━━━━━━━━━━━━━━━━━━━━━━
█ HOW TO USE
【Recommended Settings】
- Timeframe: 15 minutes or higher (15M, 1H, 4H recommended)
- Best performance on: Forex majors, Gold, NASDAQ
- Enable "Auto Asset Detection" for optimized parameters
【Entry Rules】
- BUY: Enter long when green BUY label appears
- SELL: Enter short when pink SELL label appears
【Session Panel】
The top-right panel displays:
- Current trading session (Tokyo/London/NY)
- Volatility status (High Chance/Medium Chance/Caution)
- Mode (AUTO/MANUAL)
【Alert Setup】
1. Enable "Viewer Alert Display" in settings
2. Set cooldown period (default: 15 minutes) to avoid signal spam
3. Create alert with "Any alert() function call" condition
【Important Notes】
- This indicator does not repaint - signals are confirmed at bar close
- Lower timeframes (1M, 5M) may generate excessive signals
- Always use proper risk management and confirm with other analysis
━━━━━━━━━━━━━━━━━━━━━━━━━━━━━━━━━━━━━━━━━━━━━━━━
█ SETTINGS OVERVIEW
🎯 Alert Settings
- Viewer Alert Display: Enable/disable alert labels
- Cooldown Function: Prevent rapid consecutive signals
- Cooldown Time: Minutes between alerts (5-60)
🔧 Dynamic ATR Settings
- Enable Dynamic ATR: Auto-adjust based on volatility
- ATR Period: Calculation period (default: 14)
- ATR Smoothing: Smoothing period for ratio calculation
- Volatility Sensitivity: How much to adjust (0.1-1.0)
🕐 Session ATR Adjustment
- Enable Time Adjustment: Session-based sensitivity
- Show Session Info: Display session panel
📊 Asset Settings
- Auto Asset Detection: Automatically optimize for instrument
- Manual settings available when auto-detection is disabled
━━━━━━━━━━━━━━━━━━━━━━━━━━━━━━━━━━━━━━━━━━━━━━━━
█ CREDITS
Based on the original UT Bot concept by QuantNomad.
Enhanced with session-based adaptation and auto-asset detection by EduVest.
License: Mozilla Public License 2.0

MDZ Strategy v4.2 - Multi-factor trend strategyWhat This Strategy Does
MDZ (Momentum Divergence Zones) v4.2 is a trend-following strategy that enters long positions when multiple momentum and trend indicators align. It's designed for swing trading on higher timeframes (2H-4H) and uses ATR-based position management.
The strategy waits for strong trend confirmation before entry, requiring agreement across five different filters. This reduces trade frequency but aims to improve signal quality.
Entry Logic
A long entry triggers when ALL of the following conditions are true:
1. EMA Stack (Trend Structure)
Price > EMA 20 > EMA 50 > EMA 200
This "stacked" alignment indicates a strong established uptrend
2. RSI Filter (Momentum Window)
RSI between 45-75 (default)
Confirms momentum without entering overbought territory
3. ADX Filter (Trend Strength)
ADX > 20 (default)
Ensures the trend has sufficient strength, not a ranging market
4. MACD Confirmation
MACD line above signal line
Histogram increasing (momentum accelerating)
5. Directional Movement
+DI > -DI
Confirms bullish directional pressure
Exit Logic
Positions are managed with ATR-based levels:
ParameterDefaultDescriptionStop Loss2.5 × ATRBelow entry priceTake Profit6.0 × ATRAbove entry priceTrailing Stop2.0 × ATROptional, activates after entry
The default configuration produces a 1:2.4 risk-reward ratio.
Presets
The strategy includes optimized presets based on historical testing:
PresetTimeframeNotes1H Standard1 HourMore frequent signals2H Low DD2 HourConservative settings3H Optimized3 HourBalanced approach4H Swing4 HourWider stops for swing tradesCustomAnyFull manual control
Select "Custom" to adjust all parameters manually.
Inputs Explained
EMAs
Fast EMA (20): Short-term trend
Slow EMA (50): Medium-term trend
Trend EMA (200): Long-term trend filter
RSI
Length: Lookback period (default 14)
Min/Max: Entry window to avoid extremes
ADX
Min ADX: Minimum trend strength threshold
Risk
Stop Loss ATR: Multiplier for stop distance
Take Profit ATR: Multiplier for target distance
Trail ATR: Trailing stop distance (if enabled)
Session (Optional)
Filter entries by time of day
Recommended OFF for 3H+ timeframes
What's Displayed
Info Panel (Top Right)
Current preset
Trend status (Strong/Wait)
ADX, RSI, MACD readings
Position status
Risk-reward ratio
Stats Panel (Top Left)
Net P&L %
Total trades
Win rate
Profit factor
Maximum drawdown
Chart
EMA lines (20 blue, 50 orange, 200 purple)
Green background during strong uptrend
Triangle markers on entry signals
Important Notes
⚠️ This is a long-only strategy. It does not take short positions.
⚠️ Historical results do not guarantee future performance. Backtests show what would have happened in the past under specific conditions. Markets change, and any strategy can experience drawdowns or extended losing periods.
⚠️ Risk management is your responsibility. The default settings risk 100% of equity per trade for backtesting purposes. In live trading, appropriate position sizing based on your risk tolerance is essential.
⚠️ Slippage and commissions matter. The backtest includes 0.02% commission and 1 tick slippage, but actual execution costs vary by broker and market conditions.
Best Practices
Test on your specific market — Results vary significantly across different instruments
Use appropriate position sizing — Never risk more than you can afford to lose
Combine with your own analysis — No indicator replaces understanding market context
Paper trade first — Validate the strategy matches your trading style before risking capital
Alerts
Two alerts are available:
MDZ Long Entry: Fires when all entry conditions are met
Uptrend Started: Fires when EMA stack first aligns bullish
Methodology
This strategy is based on the principle that trend continuation has better odds than reversal when multiple timeframe momentum indicators agree. By requiring five independent confirmations, it filters out weak setups at the cost of fewer total signals.
The ATR-based exits adapt to current volatility rather than using fixed pip/point targets, which helps the strategy adjust to different market conditions.
Questions? Leave a comment below.

ML-Inspired Adaptive Momentum Strategy (TradingView v6)This strategy demonstrates an adaptive momentum approach using volatility-normalized trend strength. It is designed for educational and analytical purposes and uses deterministic, fully transparent logic compatible with Pine Script v6.
ML-Inspired Concept (Educational Context)
Pine Script cannot train or execute real machine-learning models.
Instead, this strategy demonstrates ML-style thinking by:
Converting price data into features
Normalizing features to account for volatility differences
Producing a bounded confidence score
Applying thresholds for decision making
This is not predictive AI and does not claim forecasting capability.
Strategy Logic
EMA is used to measure directional bias
EMA slope represents momentum change
ATR normalizes the slope (feature scaling)
A clamped score between −1 and +1 is generated
Trades trigger only when the score exceeds defined thresholds
Risk & Execution
Position size capped at 5% equity
Commission and slippage included for realistic testing
Signals are calculated on closed bars only
Purpose
This script is intended to help traders explore adaptive momentum concepts and understand how feature normalization can be applied in systematic trading strategies.

ThaiRiches Predictor [AI Premium]ThaiRiches Predictor is a comprehensive trend-following system designed to help traders identify high-probability entries while managing risk effectively. This script combines Zero-Lag technology (ZLEMA) with volatility filters and an intelligent AI Dashboard to analyze market conditions in real-time.
Key Features:
Zero-Lag Trend Engine: Uses a custom Zero-Lag EMA (ZLEMA) logic combined with volatility bands to detect trend changes earlier than traditional Moving Averages.
AI Analysis Dashboard: A real-time monitor panel that evaluates Trend, Momentum (RSI), and Volatility to provide actionable advice (e.g., "Strong Uptrend", "Overbought - Wait for Pullback", or "Low Volatility - Caution").
Auto TP & SL System: Automatically calculates and displays Stop Loss (SL), Take Profit 1 (TP1), and Take Profit 2 (TP2) based on ATR, adapting to the current market volatility.
Improved Safety: SL is calculated from the High/Low of the signal candle to prevent premature stop-outs.
Visual Alerts: Clear BUY/SELL labels with price targets and color-coded candlesticks for easy visual confirmation.
How to Use:
BUY Signal: Look for the Green Label and Green Trend Line. Confirm with the Dashboard (Status: BULLISH).
S ELL Signal: Look for the Red Label and Red Trend Line. Confirm with the Dashboard (Status: BEARISH).
Risk Management: Use the provided SL levels. It is recommended to take partial profit at TP1 and trail your stop to entry.
Caution: Avoid trading when the Dashboard shows "Low Volatility" or "Choppy" warnings.
Settings:
You can adjust the Trend Sensitivity and RSI Period.
TP/SL Multipliers are fully customizable to fit different assets (Gold, Forex, Crypto).

Flux Momentum Oscillator[BullByte]Flux Momentum Oscillator is a professional-grade momentum analysis system built on an original methodology called Momentum Flux Bars (MFB). Unlike conventional oscillators that measure momentum over fixed time periods, this indicator constructs synthetic momentum bars based on actual price movement, creating a pure representation of directional pressure independent of time-based noise.
This is NOT a mashup or combination of existing indicators. The entire system is built from the ground up around a single cohesive concept: measuring momentum through price-triggered synthetic bars rather than time-triggered calculations.
CORE INNOVATION: MOMENTUM FLUX BARS (MFB)
Traditional momentum indicators calculate values at fixed time intervals, which means a slow, grinding move receives the same measurement weight as a fast, explosive move occurring over the same number of bars. This creates distortion in momentum readings.
Momentum Flux Bars solve this problem by forming only when price travels a volatility-adjusted distance. Each MFB represents genuine directional commitment from market participants.
Key Properties of Momentum Flux Bars:
- Form based on price movement, not time passage
- Automatically adjust their formation threshold based on current volatility
- Capture the velocity of price movement (how quickly each bar forms)
- Record volume participation during formation
- Create a noise-filtered view of true market momentum
The oscillator then analyzes the pattern, velocity, and characteristics of recent MFB formations to produce its readings.
WHY THIS APPROACH MATTERS FOR TRADERS
Time-Based Problem: A 14-period RSI on a choppy day produces the same calculation structure as on a trending day, even though market behavior differs completely. The indicator cannot distinguish between meaningful moves and noise.
Flux-Based Solution: When price chops sideways, fewer MFBs form because price fails to travel the required distance. When price trends strongly, MFBs form rapidly in sequence. The oscillator inherently adapts to actual market behavior.
Practical Benefits:
- Cleaner signals during trending conditions
- Automatic noise reduction during consolidation
- Earlier detection of momentum shifts through velocity analysis
- Reduced false signals in choppy markets
- No manual adjustment needed across different market conditions
COMPLETE FEATURE BREAKDOWN
FEATURE 1: AUTO-OPTIMIZATION ENGINE
The indicator includes an optional auto-optimization system that continuously evaluates different sensitivity parameters and selects the configuration producing the cleanest momentum measurement for current conditions.
How It Works:
- Tests multiple ATR multiplier values against recent price history
- Scores each configuration based on trend capture efficiency
- Automatically applies the optimal setting
- Re-evaluates periodically to adapt to changing conditions
Trader Benefit: Eliminates the guesswork of parameter tuning. The indicator finds its own optimal settings.
FEATURE 2: MARKET REGIME CLASSIFICATION
The system classifies current market conditions into four distinct regimes based on MFB formation patterns:
EXPLOSIVE: Rapid MFB formation with strong directional bias and high volume participation. Indicates powerful trending conditions with high momentum.
STEADY: Consistent MFB formation in a primary direction with normal velocity. Represents healthy, sustainable trends suitable for trend-following approaches.
CONSOLIDATING: Mixed direction MFB formation with decreasing velocity. Suggests range-bound conditions where breakout strategies may be appropriate.
DEAD: Minimal MFB formation activity. Indicates extremely low volatility or market indecision. Often precedes significant moves.
Trader Benefit: Instantly understand current market character and adjust strategy accordingly.
FEATURE 3: VELOCITY DIVERGENCE DETECTION
This advanced feature monitors the formation speed of Momentum Flux Bars and compares it against price direction.
Velocity Divergence Bearish: Price making higher highs but MFBs forming progressively slower. Suggests buying pressure is weakening despite higher prices.
Velocity Divergence Bullish: Price making lower lows but MFBs forming progressively slower. Suggests selling pressure is weakening despite lower prices.
Trader Benefit: Early warning system for potential reversals before they appear on price charts.
FEATURE 4: MOMENTUM EXHAUSTION DETECTION
The system identifies when a trending move may be running out of energy by analyzing the duration pattern of consecutive same-direction MFBs.
Exhaustion Pattern: When each successive MFB in a trend takes progressively longer to form, it indicates diminishing momentum even though direction remains unchanged.
States Displayed:
- BUILDING: Momentum is increasing or stable
- PEAK: Maximum momentum velocity reached
- EXHAUSTING: Progressive slowdown detected
Trader Benefit: Know when a trend is losing steam before price reverses.
FEATURE 5: HIGHER TIMEFRAME ALIGNMENT
The indicator checks whether higher timeframe MFB direction supports or conflicts with current timeframe momentum.
ALIGNED BULL: Both timeframes showing bullish MFB direction
ALIGNED BEAR: Both timeframes showing bearish MFB direction
DIVERGENT: Timeframes showing opposing directions
NEUTRAL: Higher timeframe direction unclear
Trader Benefit: Trade with higher timeframe support for higher probability setups.
FEATURE 6: CHOPPY MARKET DETECTION
A dedicated algorithm analyzes recent MFB patterns to determine if the market is in a choppy, directionless state.
Detection Factors:
- Frequency of direction changes in recent MFBs
- Lack of consecutive same-direction formations
- Weak directional bias in the MFB sequence
Trader Benefit: Avoid trend-following strategies when market conditions do not support them.
FEATURE 7: TREND STRENGTH MEASUREMENT
A percentage-based strength reading derived from MFB pattern analysis.
Flux Momentum Oscillator Chart Example
Chart Overview: Bitcoin 15-Minute Chart (Dec 21, 2025)
BTCUSD Market Snapshot
Price: $88,854.53 | Oscillator: 77.38 | Direction: BULLISH | Regime: EXPLOSIVE
1. EXPLOSIVE REGIME DETECTION (Current State - Right Side)
2. MOMENTUM EXHAUSTION ZONE (Mid-Chart)
3. CHOP/CONSOLIDATION PERIOD (Before Breakout)
4. VELOCITY DIVERGENCE (Around 21:00 the previous day)
5. BULLISH MOMENTUM SHIFT (Around 09:00)
6. FORMATION PROGRESS BAR (Bottom of Oscillator)
7. TREND STRENGTH INDICATOR (Bottom Bar)
8. EXTREME ZONES (Top and Bottom Boundaries)
Reading Interpretation:
- Above 70%: Strong trending conditions
- 40% to 70%: Moderate trend or developing move
- Below 40%: Weak trend or choppy conditions
Visual representation provided via the strength bar at the bottom of the indicator panel.
HOW TO READ THE OSCILLATOR PLOT
OSCILLATOR LINE (Main Line):
- Ranges from -100 to +100
- Above zero indicates bullish momentum
- Below zero indicates bearish momentum
- Color intensity reflects momentum direction and strength
- Glow effect (optional) enhances visibility of the main reading
SIGNAL LINE (Secondary Line):
- Smoothed version of the oscillator
- Crossovers indicate momentum shifts
- Purple/accent colored for visual distinction
HISTOGRAM BARS:
- Represent the difference between oscillator and signal line
- Increasing histogram in direction of oscillator confirms momentum
- Decreasing histogram warns of potential momentum shift
- Bright colors indicate increasing momentum
- Faded colors indicate decreasing momentum
ZONE INTERPRETATION:
+75 to +100 (Extreme Bullish Zone):
Very strong bullish momentum. Price has moved significantly and rapidly. Watch for exhaustion patterns. Not ideal for new long entries. Consider profit-taking on existing longs.
+50 to +75 (Strong Bullish Zone):
Healthy bullish momentum. Good conditions for trend-following long strategies. Pullbacks to signal line often provide continuation opportunities.
0 to +50 (Mild Bullish Zone):
Positive but moderate momentum. Trend may be developing or maturing. Watch for strength building or fading.
0 to -50 (Mild Bearish Zone):
Negative but moderate momentum. Downtrend may be developing or maturing. Watch for weakness building or recovering.
-50 to -75 (Strong Bearish Zone):
Healthy bearish momentum. Good conditions for trend-following short strategies. Rallies to signal line often provide continuation opportunities.
-75 to -100 (Extreme Bearish Zone):
Very strong bearish momentum. Price has moved significantly and rapidly to downside. Watch for exhaustion patterns. Not ideal for new short entries. Consider profit-taking on existing shorts.
HOW TO READ THE DASHBOARD
The dashboard provides comprehensive market analysis at a glance. Each row displays specific information:
OSCILLATOR ROW:
Shows current oscillator value with directional icon.
indicates reading above +50 (High)
indicates reading below -50 (Low)
DIRECTION ROW:
Current MFB direction.
BULLISH: Recent MFB formed upward
BEARISH: Recent MFB formed downward
NEUTRAL: No recent MFB or unclear
REGIME ROW:
Current market regime classification.
EXPLOSIVE / STEADY / CONSOLIDATING / DEAD
Color coded for quick recognition.
MARKET ROW:
Trend state assessment.
TRENDING UP: Confirmed uptrend in progress
TRENDING DN: Confirmed downtrend in progress
CHOPPY: No clear trend, high direction changes
MIXED: Partial trend characteristics
STRENGTH ROW:
Visual bar showing trend strength percentage.
More filled bars indicate stronger trend.
Color shifts from red (weak) to yellow (moderate) to green (strong).
VELOCITY ROW:
MFB formation speed status.
ACCELERATING: MFBs forming faster over time
STEADY: Consistent formation speed
DECELERATING: MFBs forming slower over time
MOMENTUM ROW:
Momentum development status.
BUILDING: Momentum increasing
PEAK: Maximum momentum reached
EXHAUSTING: Momentum declining despite same direction
HTF ALIGN ROW:
Higher timeframe alignment status.
BULL: HTF supports bullish bias
BEAR: HTF supports bearish bias
DIVERGENT: HTF opposes current direction
NEUTRAL: HTF unclear
FORMING ROW:
Progress toward next MFB formation.
Visual bar fills as price approaches formation threshold.
Helps anticipate when next MFB will complete.
Additional rows (when not in Compact Mode):
- Flux Size: Current MFB formation threshold value
- ATR Mult: Current optimized ATR multiplier (when auto-optimization enabled)
- Regime %: Numerical regime score
FORMATION PROGRESS INDICATOR
The horizontal line near the bottom of the indicator panel shows progress toward the next MFB formation.
Reading the Progress Line:
- Starts at baseline after each MFB completion
- Rises as price moves toward formation threshold
- Higher position indicates imminent MFB formation
- Color changes from neutral to accent to warning as formation approaches
Practical Use:
- Anticipate when new momentum data will become available
- Gauge intra-bar momentum development
- Understand why signals occur when they do
TREND STRENGTH BAR
The horizontal bar at the very bottom of the indicator displays trend strength visually.
Components:
- Gray background bar represents full scale (0-100%)
- Colored fill represents current strength reading
- Label displays exact percentage value
Color Interpretation:
- Green fill: Strong trend (above 70%)
- Yellow fill: Moderate trend (40-70%)
- Red fill: Weak trend (below 40%)
RECOMMENDED USAGE GUIDELINES
TIMEFRAME RECOMMENDATIONS:
Scalping (1m to 5m):
- Use lower Flux Period (8-10) for faster response
- Focus on oscillator crossovers and histogram momentum
- Regime should be STEADY or EXPLOSIVE for best results
Day Trading (5m to 30m):
- Default settings work well
- Use HTF alignment with 1H or 4H for confirmation
- Avoid trading when regime shows DEAD
Swing Trading (1H to 4H):
- Consider higher Flux Period (18-21) for smoother signals
- Regime classification becomes very valuable
- Velocity divergence provides excellent early warnings
Position Trading (Daily and above):
- Higher Flux Period (21-30) recommended
- Focus on regime changes and exhaustion patterns
- HTF alignment less relevant, oscillator zones more important
ASSET CLASS NOTES:
Forex: Works well on major pairs. Consider slightly higher sensitivity on less volatile pairs.
Crypto: Higher volatility may require lower sensitivity multiplier. Regime detection particularly useful.
Stocks: Excellent for liquid stocks. Less effective on illiquid names due to gappy price action.
Indices: Very effective. Clean price action produces clean MFB patterns.
Commodities: Works well, especially on gold and oil. Adjust sensitivity for different volatility profiles.
SETTINGS OVERVIEW
MODE AND THEME:
- Trading Mode: Simple (clean), Pro (full data), Hybrid (balanced)
- Visual Theme: Dark, Light, Neon, Stealth
- Compact Dashboard: Reduces dashboard rows
FLUX ENGINE:
- Flux Calculation Method: Choose optimization approach
- Enable Auto-Optimization: Let indicator find optimal parameters
- Flux Period: Base volatility calculation period
- Sensitivity Multiplier: Adjust MFB formation threshold
- Optimization Lookback: Bars analyzed for optimization
- Optimization Frequency: How often to re-optimize
OSCILLATOR:
- Oscillator Smoothing: Main line smoothness
- Signal Line Length: Signal line responsiveness
- Momentum Depth: MFBs analyzed for oscillator
- Histogram Scale: Visual scaling of histogram
MARKET STATE:
- Chop Detection Window: MFBs analyzed for chop detection
- Chop Threshold: Sensitivity of chop classification
- Min Trend Confirmation: Consecutive bars for trend confirmation
ADVANCED ANALYSIS:
- Enable Regime Classification: Market regime detection
- Enable Velocity Divergence: Formation speed analysis
- Enable Exhaustion Detection: Trend exhaustion warnings
- Enable HTF Alignment: Higher timeframe checking
- Higher Timeframe: Which timeframe to check
VISUALS:
- Glow Effect: Visual enhancement on oscillator
- Show Zone Fills: Background zone coloring
- Show Formation Progress: Progress indicator display
- Show Trend Strength Bar: Bottom strength bar
- Show Dashboard: Information panel display
- Dashboard Position: Corner placement
SIGNAL INTERPRETATION GUIDELINES
BULLISH MOMENTUM SHIFT:
Oscillator crosses above signal line while not in extreme bearish territory.
Suggests emerging bullish momentum.
Stronger when occurring near zero line or in mild bearish zone.
BEARISH MOMENTUM SHIFT:
Oscillator crosses below signal line while not in extreme bullish territory.
Suggests emerging bearish momentum.
Stronger when occurring near zero line or in mild bullish zone.
STRONG TREND CONDITIONS:
Oscillator beyond +/-55, in direction of signal line, trend strength above 55%, not choppy.
Indicates conditions favorable for trend-following approaches.
EXTREME ZONES:
Oscillator beyond +/-75.
Diamond markers appear.
Exercise caution with new positions in trend direction.
Watch for exhaustion and divergence signals.
ALERT SYSTEM
The indicator includes comprehensive alerts for automated monitoring:
Momentum Alerts:
- Bullish Momentum Shift
- Bearish Momentum Shift
- Strong Uptrend Initiated
- Strong Downtrend Initiated
Zone Alerts:
- Extreme Bullish Zone Reached
- Extreme Bearish Zone Reached
Market State Alerts:
- Choppy Conditions Detected
- Choppy Conditions Cleared
- Explosive Regime Entered
- Dead Regime Entered
Advanced Alerts:
- Velocity Divergence Detected
- Exhaustion Warning Triggered
- HTF Aligned Bullish
- HTF Aligned Bearish
- HTF Divergence Detected
MFB Alerts:
- Bullish MFB Formed
- Bearish MFB Formed
WHAT THIS INDICATOR IS NOT
This indicator is NOT:
- A buy/sell signal generator (it provides momentum context, not trade signals)
- A standalone trading system (combine with price action and other analysis)
- A guarantee of profitability (no indicator can guarantee results)
- A replacement for risk management (always use proper position sizing and stops)
- A mashup of existing indicators (this is original methodology)
ORIGINALITY STATEMENT
The Momentum Flux Bars concept was designed specifically to address limitations of time-based momentum calculations.
Every component of this system serves the central MFB methodology:
- The oscillator measures MFB directional weight
- The regime classifier interprets MFB patterns
- The velocity analysis tracks MFB formation speed
- The exhaustion detector monitors MFB duration progression
- The HTF alignment checks MFB direction across timeframes
This is a unified analytical framework, not a collection of separate indicators.
TECHNICAL NOTES
Non-Repainting Confirmation:
All signal generation uses confirmed bar data only. MFB formations occur on bar close. Historical signals will not change after they appear.
Performance Considerations:
Auto-optimization runs periodically, not every bar, to maintain performance.
MFB history is trimmed to prevent memory issues on extended sessions.
Reduce Max MFB History if experiencing performance issues.
Symbol and Timeframe Handling:
The indicator resets its MFB history when symbol or timeframe changes.
This ensures clean analysis without carryover from previous contexts.
DISCLAIMER
This indicator is provided for educational and informational purposes only. It is not financial advice and should not be considered as such.
Trading involves substantial risk of loss. Past performance of any trading methodology or indicator does not guarantee future results. The author makes no representations regarding the profitability or suitability of this indicator for any particular purpose.
Users are solely responsible for their own trading decisions. Always use proper risk management, including appropriate position sizing and stop-loss orders. Never risk more than you can afford to lose.
Before using this or any indicator in live trading, thoroughly test it on historical data and in a demo environment. Understand its behavior across different market conditions.
The author is not liable for any losses incurred through the use of this indicator.
Developed by BullByte
Version 1.0.0

SuperBandsThis script combines two of the most powerful trading tools into a single indicator: Supertrend for trend following and Bollinger Bands for volatility analysis. This combo allows you to save your limited indicator slots on TradingView while keeping your chart clean.

Infinity Algo█ OVERVIEW
Infinity Algo is an all-in-one signal system with 5 entry modes, 6 take-profit levels, and built-in Auto-Tune optimization.
Switch between trend-following, contrarian, and sniper modes based on market conditions — all within one indicator. Auto-Tune tests 500+ parameter combinations to selects the best-scoring settings from historical simulations.
Includes on-chart TP/SL visualization, trailing stop modes, and webhook-ready alerts.
█ KEY FEATURES
✅ 5 Signal Modes: Normal, Smart, AI, HL Sniper, AI Sniper
✅ 3 Exit Modes: Percentage targets, Signal step-outs, Opposite signal
✅ 6 Take-Profit Levels with on-chart visualization
✅ Trailing Stop-Loss (Breakeven / Moving Target)
✅ Auto-Tune Parameter Optimization
✅ Visual Helpers: Bar coloring, gradient background, "signal coming" markers
✅ Built-in alert conditions for automation
✅ Designed for crypto, forex, stocks, indices, and commodities
█ WHAT MAKES THIS INDICATOR DIFFERENT
🧠 Auto-Tune Engine
Most indicators use static settings that fail when volatility shifts. Auto-Tune tests 500+ parameter combinations in the background — varying sensitivity, thresholds, and trigger configs — selects the best-scoring settings from historical simulations.
Choose from 12 scoring metrics: Sharpe Ratio, Sortino Ratio, Calmar Ratio, SQN, Martin Ratio, GPR, Win Rate, Total Profit, Average Profit, Profit Factor, and more.
Note: Auto-Tune is systematic parameter optimization on historical data — not predictive AI. Past performance does not guarantee future results.
🎯 Multi-Mode Signal System
One indicator, five signal modes:
Normal: Contrarian entries against the trend filter
Smart: Trend-following entries with the trend filter
Auto-Tune: Auto-optimized momentum signals
HL Sniper: More selective trend triggers
Auto-Tune Sniper: Auto-optimized sniper configuration
🛡️ Adaptive Risk Management
Trailing SL modes that respond to your TP hits — not arbitrary price levels. Lock in breakeven or ratchet your stop as profit grows.
👁️ Anticipation Markers
"Possible Long/Short Coming" labels appear when momentum approaches signal levels — giving you time to prepare before the signal fires.
█ SIGNAL MODES EXPLAINED
Normal + Smart (Default)
The dual-mode system that adapts to market conditions:
Normal Signals: Momentum threshold cross against the trend filter — contrarian plays for reversals and range boundaries
Smart Signals: Momentum threshold cross with the trend filter — trend-following plays for continuation moves
Auto-Tune Mode
Let the optimization engine find best-scoring settings:
Tests 500+ parameter combinations against historical data
Simulates trades using your configured TP/SL levels
Scores each configuration by your chosen metric (Sharpe, Sortino, Win Rate, etc.)
Walk-Forward: Re-optimizes every N bars to adapt to regime changes
Static: Locks in best-scoring settings from full available history
HL Sniper
For traders who prefer quality over quantity:
Trend-trigger mode for more selective entries
Fewer signals, more selective setups
Best suited for volatile markets where patience matters
Auto-Tune Sniper
Combines sniper selectivity with automatic optimization:
Optimizes RSI period, smoothing factor, and trigger sensitivity
Adapts configuration based on historical performance
Selective entries + adaptive parameters
█ EXIT & RISK MANAGEMENT
Percentage Targets
Up to 6 TP levels (TP1…TP6) with on-chart lines and labels
Configure price distance (%) and position size (%) for each level
Designed for scaling out positions systematically
Signal Step-Outs
Momentum-shift condition triggers partial exits
Optional higher-timeframe confirmation for stronger signals
"New TP Must Beat Last" prevents weak consecutive exits
Opposite Signal
Closes/flips position when the next opposite entry signal appears
Simple and effective for trend-following systems
Stop-Loss & Trailing
Fixed SL as % from entry (configurable separately for long/short)
Breakeven: Moves SL to entry price after chosen TP is hit
Moving Target: Advances SL to previous TP level as profit grows
█ VISUAL HELPERS
On-Chart TP/SL Lines: See your targets and stops directly on the chart
Bar Coloring: Candles colored by current signal bias
Background Gradient: Visual confirmation of position direction
"Possible Signal Coming" Markers: Anticipate entries before they trigger
Peak Profit Label: Track maximum unrealized profit during trades
█ AUTO-TUNE DASHBOARD
When Auto-Tune is enabled, the dashboard displays:
Current Parameters: Active sensitivity, thresholds, or sniper config
Simulated Performance: Trade count, win rate, P&L from internal backtest
Confidence Score: Stability indicator based on agreement among top configurations
Note: Auto-Tune is automated parameter selection on historical data — not predictive AI. It cannot guarantee future performance.
█ USE CASES
📈 Trending Markets
Use "Smart" signals + Percentage TPs. Stay aligned with momentum while scaling out at multiple targets. Enable Moving Target trailing to maximize winners.
📉 Ranging / Choppy Markets
Use "Normal" signals (contrarian mode). Catch reversals at range boundaries. Tighter TP targets and quicker exits work best.
⚡ High Volatility / News Events
Use "HL Sniper" for selective entries. Fewer signals, more selective. Wider SL to accommodate volatility.
🧪 New Asset / Unfamiliar Market
Enable "AI" mode and let Auto-Tune find optimal parameters. Great for exploring new markets without manual optimization.
🤖 Automation & Bots
Structured alert payloads work with popular bot platforms and custom webhooks. Entry + 6 TPs + SL in one alert.
█ HOW TO USE
Apply to your chart (any timeframe, any market)
Choose your signal mode based on market conditions
Pick your direction (Long / Short / Both)
Select exit mode: Percentage, Signals, or Opposite Signal
Configure TP levels and position sizing
Enable Stop-Loss and choose a trailing mode
Optional: Enable Auto-Tune for adaptive optimization
Set alerts for signals and TP/SL events
█ ALERTS
Built-in alert conditions for:
All entry signal types (Normal, Smart, AI, HL Sniper, AI Sniper)
TP hits (percentage levels or signal-based steps)
SL touch events
"Possible Long/Short Coming" anticipation markers
Tip: Create separate alerts for each condition. Use TradingView placeholders ({{ticker}}, {{close}}) in your alert messages.
█ WORKS ON
Crypto
Forex
Stocks
Indices
Commodities
█ REALISTIC EXPECTATIONS
No indicator wins 100% of the time — this is no exception
Signals should be combined with your own analysis
Auto-Tune optimizes on past data — it cannot predict the future
Always use proper position sizing and risk management
Paper trade or backtest before risking real capital
█ LIMITATIONS
Signals and overlays are decision-support tools — they cannot eliminate losses
Auto-Tune can overfit if used without out-of-sample validation
Multi-timeframe logic confirms on higher-TF closes — slight delay is expected
Best evaluated on standard candles with realistic fee/slippage assumptions
█ DISCLAIMER
This indicator is provided for educational and informational purposes only and does not constitute financial advice. Past performance is not indicative of future results. Trading involves substantial risk of loss, and you are solely responsible for your own trading decisions.

Daily Close Breakout 20/10 + 200 (Signals)Daily Close Breakout 20/10 + 200 (Signals)
A simple “check once per day” breakout signal tool designed for the Daily (1D) chart.
Quickstart:
* Signals are confirmed at the daily candle close.
* If a triangle prints today, the earliest you act is the next day’s open (not the same candle).
* Green triangle = consider entering long.
* Red triangle = consider exiting.
* Long-only (no shorts).
How to use:
* Use on the Daily (1D) timeframe.
* Check the chart once per day after the daily candle closes.
* Do not act intraday on signals.
Rules (default settings 20 / 10 / 200):
* BUY: A green up triangle prints when the daily close is above the prior 20-day high and above the 200-day Simple Moving Average.
* SELL: A red down triangle prints when the daily close is below the prior 10-day low.
Lines and colors:
* Prior 20-day high (entry level): red
* Prior 10-day low (exit level): yellow
* 200-day Simple Moving Average: aqua
Notes:
* Best used on the Daily (1D) timeframe. Other timeframes may behave differently.
* This script plots signals and reference levels only. For performance metrics, use a matching strategy/backtest script.
* Educational use only. Not financial advice.

Strategy: HMA 50 + Supertrend SniperHMA 50 + Supertrend Confluence Strategy (Trend Following with Noise Filtering)
Description:
Introduction and Concept This strategy is designed to solve a common problem in trend-following trading: Lag vs. False Signals. Standard Moving Averages often lag too much, while price action indicators can generate false signals during choppy markets. This script combines the speed of the Hull Moving Average (HMA) with the volatility-based filtering of the Supertrend indicator to create a robust "Confluence System."
The primary goal of this script is not just to overlay two indicators, but to enforce a strict rule where a trade is only taken when Momentum (HMA) and Volatility Direction (Supertrend) are in perfect agreement.
Why this combination? (The Logic Behind the Mashup)
Hull Moving Average (HMA 50): We use the HMA because it significantly reduces lag compared to SMA or EMA by using weighted calculations. It acts as our primary Trend Direction detector. However, HMA can be too sensitive and "whipsaw" during sideways markets.
Supertrend (ATR-based): We use the Supertrend (Factor 3.0, Period 10) as our Volatility Filter. It uses Average True Range (ATR) to determine the significant trend boundary.
How it Works (Methodology) The strategy uses a boolean logic system to filter out low-quality trades:
Bullish Confluence: The HMA must be rising (Slope > 0) AND the Close Price must be above the Supertrend line (Uptrend).
Bearish Confluence: The HMA must be falling (Slope < 0) AND the Close Price must be below the Supertrend line (Downtrend).
The "Choppy Zone" (Noise Filter): This is a unique feature of this script. If the HMA indicates one direction (e.g., Rising) but the Supertrend indicates the opposite (e.g., Downtrend), the market is considered "Choppy" or indecisive. In this state, the script paints the candles or HMA line Gray and exits all positions (optional setting) to preserve capital.
Visual Guide & Signals To make the script easy to interpret for traders who do not read Pine Script, I have implemented specific visual cues:
Green Cross (+): Indicates a LONG entry signal. Both HMA and Supertrend align bullishly.
Red Cross (X): Indicates a SHORT entry signal. Both HMA and Supertrend align bearishly.
Thick Line (HMA): The main line changes color based on the trend.
Green: Bullish Confluence.
Red: Bearish Confluence.
Gray: Divergence/Choppy (No Trade Zone).
Thin Step Line: This is the Supertrend line, serving as your dynamic Trailing Stop Loss.
Strategy Settings
HMA Length: Default is 50 (Mid-term trend).
ATR Factor/Period: Default is 3.0/10 (Standard for trend catching).
Exit on Choppy: A toggle switch allowing users to decide whether to hold through noise or exit immediately when indicators disagree.
Risk Warning This strategy performs best in trending markets (Forex, Crypto, Indices). Like all trend-following systems, it may experience drawdown during prolonged accumulation/distribution phases. Please backtest with your specific asset before using it with real capital.

XAU BUY/SELL Scalping Strategy M5 PROFX:XAUUSD
This XAU/USD Pro Scalping Strategy is tailored specifically for the M5 timeframe , designed to capture rapid Gold price movements. Instead of relying on lagging indicators, this system utilizes advanced Price Action and Market Structure analysis to identify high-probability entry zones.
The core strength of this strategy lies in its built-in Money Management engine and Multi-threaded Trailing Stop system, ensuring capital preservation and profit maximization.
🚀 Key Features:
1. Smart Price Action Recognition:
The algorithm scans for specific market scenarios to apply dynamic Risk:Reward ratios (ranging from 1:1 to 1:3).
Filters out noise and false breakouts using multi-candle analysis.
Auto Position Sizing:
Calculates trade quantity automatically based on your defined Risk % per Trade .
Ensures consistent risk management regardless of the Stop Loss distance.
Intelligent Trailing Stop:
Uses a dynamic trailing mechanism based on "R" multiples (Risk Units).
Automatically secures profits by moving SL based on the specific setup type ("Case") of each trade.
Safety Filters:
Min SL and Max SL inputs prevent trades during periods of extremely low volatility or excessive risk.
⚙️ Settings:
Risk % per Trade: The percentage of equity to risk per trade (Recommended: 1.0% - 2.0%).
Min/Max SL Points: Dynamic boundaries for Stop Loss to adapt to current market volatility.
💡 Recommendations:
Symbol: XAUUSD / Gold - FXCM.
Timeframe: M5.
Best performance during London and New York sessions.

Anchor SafeSwing Gold StrategyOverview:
The Anchor SafeSwing Gold Strategy is designed for users who prefer structured, rule-based swing trading on XAUUSD. It focuses on identifying high-quality trade setups rather than frequent entries.
This strategy analyzes the market using multiple technical indicators and methods—including trend analysis, multi-chart confirmation, and support/resistance evaluation—to identify potential swing points. It also incorporates a dynamic approach to risk management through adaptive stop-loss and take-profit logic.
How the Strategy Works
1. Multi-Chart & Trend Analysis:
The strategy evaluates trend direction using several indicators and multiple charts. This helps determine whether the trend favors long or short setups.
2. Buy/Sell Conditions:
a. Buy Conditions: When the broader trend is identified as bullish, the strategy waits for the formation of a strong support zone before considering a long position.
b. Sell Conditions: When the trend is bearish, it waits for a confirmed resistance zone before initiating short positions.
3. Dynamic Take-Profit Logic
The strategy uses adaptive take-profit behavior based on evolving market conditions. It monitors new support/resistance structures and various overbought/oversold signals to dynamically exit trades.
4. Dynamic and Configurable Stop-Loss:
A flexible stop-loss system adjusts according to volatility and market structure.
Users can modify the stop-loss threshold in the settings based on their own risk tolerance and account size.
Trading Frequency :
This strategy focuses on select, high-quality setups. As a result, trade frequency is relatively low and may vary depending on market conditions. Backtesting may show roughly several trades per month, but actual live performance can differ.
Important Notes
All trading involves risk, and users should evaluate the strategy and adjust settings according to their own risk management preferences.

Qullamagi EMA Breakout Autotrade (Crypto Futures L+S)Title: Qullamagi EMA Breakout – Crypto Autotrade
Overview
A crypto-focused, Qullamagi-style EMA breakout strategy built for autotrading on futures and perpetual swaps.
It combines a 5-MA trend stack (EMA 10/20, SMA 50/100/200), volatility contraction boxes, volume spikes and an optional higher-timeframe 200-MA filter. The script supports both long and short trades, partial take profit, trailing MA exits and percent-of-equity position sizing for automated crypto futures trading.
Key Features (Crypto)
Qullamagi MA Breakout Engine – trades only when price is aligned with a strong EMA/SMA trend and breaks out of a tight consolidation range. Longs use: Close > EMA10 > EMA20 > SMA50 > SMA100 > SMA200. Shorts are the mirror condition with all MAs sloping in the trend direction.
Strict vs Loose Modes – Strict (Daily) is designed for cleaner swing trades on 1H–4H (full MA stack, box+ATR and volume filters, optional HTF filter). Loose (Intraday) focuses on 10/20/50 alignment with relaxed filters for more frequent 15m–30m signals.
Volatility & Volume Filters for Crypto – ATR-based box height limit to detect volatility contraction, wide-candle filter to avoid chasing exhausted breakouts, and a volume spike condition requiring current volume to exceed an SMA of volume.
Higher-Timeframe Trend Filter (Optional) – uses a 200-period SMA on a higher timeframe (default: 1D). Longs only when HTF close is above the HTF 200-SMA, shorts only when it is below, helping avoid trading against dominant crypto trends.
Autotrade-Oriented Trade Management – position size as % of equity, initial stop anchored to a chosen MA (EMA10 / EMA20 / SMA50) with optional buffer, partial take profit at a configurable R-multiple, trailing MA exit for the remainder, and an optional cooldown after a full exit.
Markets & Timeframes
Best suited for BTC, ETH and major altcoin futures/perpetuals (Binance, Bybit, OKX, etc.).
Strict preset: 1H–4H charts for classic Qullamagi-style trend structure and fewer fake breakouts.
Loose preset: 15m–30m charts for higher trade frequency and more active intraday trading.
Always retune ATR length, box length, volume multiplier and position size for each symbol and exchange.
Strategy Logic (Quick Summary)
Long (Strict): MA stack in bullish alignment with all MAs sloping up → tight volatility box (ATR-based) → volume spike above SMA(volume) × multiplier → breakout above box high (close or intrabar) → optional HTF close above 200-SMA.
Short: Mirror logic: bearish MA stack, tight box, volume spike and breakdown below box low with optional HTF downtrend.
Best Practices for Crypto
Backtest on each symbol and timeframe you plan to autotrade, including commissions and slippage.
Start on higher timeframes (1H/4H) to learn the behavior, then move to 15m–30m if you want more signals.
Use the higher-timeframe filter when markets are strongly trending to reduce counter-trend trades.
Keep position-size percentage conservative until you fully understand the drawdowns.
Forward-test / paper trade before connecting to live futures accounts.
Webhook / Autotrade Integration
Designed to work with TradingView webhooks and external crypto trading bots.
Alert messages include structured fields such as: EVENT=ENTRY / SCALE_OUT / EXIT, SIDE=LONG / SHORT, STRATEGY=Qullamagi_MA.
Map each EVENT + SIDE combination to your bot logic (open long/short, partial close, full close, etc.) on your preferred exchange.
Important Notes & Disclaimer
Crypto markets are highly volatile and can change regime quickly. Backtest and forward-test thoroughly before using real capital. Higher timeframes generally produce cleaner MA structures and fewer fake breakouts.
This strategy is for educational and informational purposes only and does not constitute financial advice. Trading leveraged crypto products involves substantial risk of loss. Always do your own research, manage risk carefully, and never trade with money you cannot afford to lose.

EMA Cross + RSI + ADX - Autotrade Strategy V2Overview
A versatile trend-following strategy combining EMA 9/21 crossovers with RSI momentum filtering and optional ADX trend strength confirmation. Designed for both cryptocurrency and traditional futures/options markets with built-in stop loss management and automated position reversals.
Key Features
Multi-Market Compatibility: Works on both crypto futures (Bitcoin, Ethereum) and traditional markets (NIFTY, Bank NIFTY, S&P 500 futures, equity options)
Triple Confirmation System: EMA crossover + RSI filter + ADX strength (optional)
Automated Risk Management: 2% stop loss with wick-touch detection
Position Auto-Reversal: Opposite signals automatically close and reverse positions
Webhook Ready: Six distinct alert messages for automation (Entry Buy/Sell, Close Long/Short, SL Hit Long/Short)
Performance Metrics
NIFTY Futures (15min): 50%+ win rate with ADX filter OFF
Crypto Markets: Requires extensive backtesting before live deployment
Optimal Timeframes: 15-minute to 1-hour charts (patience required for higher timeframes)
Strategy Logic
Entry Signals:
LONG: EMA 9 crosses above EMA 21 + RSI > 55 + ADX > 20 (if enabled)
SHORT: EMA 9 crosses below EMA 21 + RSI < 45 + ADX > 20 (if enabled)
Exit Signals:
Opposite EMA crossover (auto-closes current position)
Stop loss hit at 2% from entry price (tracks candle wicks)
Technical Indicators:
Fast EMA: 9-period (short-term trend)
Slow EMA: 21-period (primary trend)
RSI: 14-period with 55/45 thresholds (momentum confirmation)
ADX: 14-period with 20 threshold (trend strength filter - optional)
Market-Specific Settings
Traditional Markets (NIFTY, Bank NIFTY, S&P Futures, Options)
Recommended Settings:
ADX Filter: Turn OFF (less choppy, cleaner trends)
Timeframe: 15-minute chart
Win Rate: 50%+ on NIFTY Futures
Why No ADX: Traditional markets have more institutional participation and smoother price action, making ADX unnecessary
Cryptocurrency Markets (BTC, ETH, Altcoins)
Recommended Settings:
ADX Filter: Turn ON (ADX > 20)
Timeframe: 15-minute to 1-hour
Extensive backtesting required before live trading
Why ADX: Crypto markets are highly volatile and prone to false breakouts; ADX filters low-quality chop
Best Practices
✅ Backtest thoroughly on your specific instrument and timeframe
✅ Use larger timeframes (1H, 4H) for higher quality signals and better risk/reward
✅ Adjust RSI thresholds based on market volatility (try 52/48 for more signals, 60/40 for fewer but stronger)
✅ Monitor ADX effectiveness - disable for traditional markets, enable for crypto
✅ Proper position sizing - adjust default_qty_value based on your capital and instrument price
✅ Paper trade first - test for 2-4 weeks before risking real capital
Risk Management
Fixed 2% stop loss per trade (adjustable)
Stop loss tracks candle wicks for accurate execution
Positions auto-reverse on opposite signals (no manual intervention needed)
0.075% commission built into backtest (adjust for your broker)
Customization Options
All parameters are adjustable via inputs:
EMA periods (default: 9/21)
RSI length and thresholds (default: 14-period, 55/45 levels)
ADX length and threshold (default: 14-period, 20 threshold)
Stop loss percentage (default: 2%)
Webhook Automation
This strategy includes six distinct alert messages for automated trading:
"Entry Buy" - Long position opened
"Entry Sell" - Short position opened
"Close Long" - Long position closed on opposite crossover
"Close Short" - Short position closed on opposite crossover
"SL Hit Long" - Long stop loss triggered
"SL Hit Short" - Short stop loss triggered
Compatible with Delta Exchange, Binance Futures, 3Commas, Alertatron, and other webhook platforms.
Important Notes
⚠️ Crypto markets require extensive backtesting - volatility patterns differ significantly from traditional markets
⚠️ Higher timeframes = better results - 15min works but 1H/4H provide cleaner signals
⚠️ ADX toggle is critical - OFF for traditional markets, ON for crypto
⚠️ Not financial advice - always conduct your own research and use proper risk management
⚠️ Past performance ≠ future results - backtest results may not reflect live trading conditions
Disclaimer
This strategy is for educational and informational purposes only. Trading futures and options involves substantial risk of loss. Always backtest thoroughly, start with paper trading, and never risk more than you can afford to lose. The author assumes no responsibility for any trading losses incurred using this strategy.

EMA + RSI Autotrade Webhook - VarunOverview
The EMA + RSI Autotrade Webhook is a powerful trend-following indicator designed for automated crypto futures trading. This indicator combines the reliability of Exponential Moving Average (EMA) crossovers with RSI momentum filtering to generate high-probability buy and sell signals optimized for webhook integration with crypto exchanges like Delta Exchange, Binance Futures, and Bybit.Key Features
Simple & Effective: Uses proven EMA 9/21 crossover strategy
RSI Momentum Filter: Eliminates low-probability trades in ranging markets
Webhook Ready: Two clean alerts (LONG Entry, SHORT Entry) for seamless automation
Exchange Compatible: Works with Delta Exchange, 3Commas, Alertatron, and other webhook platforms
Zero Lag Signals: Real-time alerts on crossover confirmation
Visual Clarity: Clean chart markers for easy signal identification
How It Works
Entry Signals:
LONG Entry: Triggers when EMA 9 crosses above EMA 21 AND RSI is above 52 (bullish momentum confirmed)
SHORT Entry: Triggers when EMA 9 crosses under EMA 21 AND RSI is below 48 (bearish momentum confirmed)
Technical Components:
Fast EMA: 9-period (tracks short-term price action)
Slow EMA: 21-period (identifies primary trend)
RSI: 14-period (confirms momentum strength)
RSI Long Threshold: 52 (filters weak bullish signals)
RSI Short Threshold: 48 (filters weak bearish signals)
Best Use Cases
Crypto Futures Trading: Bitcoin, Ethereum, Altcoin perpetual contracts
Automated Trading Bots: Integration with Delta Exchange webhooks, TradingView alerts
Timeframes: Optimized for 15-minute charts (works on 5min-1H)
Markets: Trending crypto markets with clear directional moves
Risk Management: Best used with 1-2% stop loss per trade (managed externally)
Webhook Automation Setup
Add indicator to your TradingView chart
Create alerts for "LONG Entry" and "SHORT Entry"
Configure webhook URL from your exchange (Delta Exchange, Binance, etc.)
Use alert message: Entry LONG {{ticker}} @ {{close}} or Entry SHORT {{ticker}} @ {{close}}
Exchange automatically reverses positions on opposite signals
Advantages
✅ No manual trading required - fully automated
✅ Eliminates emotional trading decisions
✅ Catches trending moves early with EMA crossovers
✅ RSI filter reduces whipsaws in choppy markets
✅ Works 24/7 without monitoring
✅ Simple two-alert system (easy to manage)
✅ Compatible with multiple exchanges via webhooksStrategy Philosophy
This indicator follows a trend-following with momentum confirmation approach. By waiting for both EMA crossover AND RSI confirmation, it ensures you're entering trades with genuine momentum behind them, not just random price noise. The tight RSI thresholds (52/48) keep you aligned with the prevailing trend.Recommended Settings
Timeframe: 15-minute (primary), 5-minute (scalping), 1-hour (swing)
Markets: BTC/USDT, ETH/USDT, high-liquidity altcoin perpetuals
Position Sizing: 100% capital per signal (exchange manages reversals)
Stop Loss: 2% (managed via exchange or external bot)
Leverage: 1-2x for conservative approach, up to 5x for aggressive
Important Notes
⚠️ This indicator generates entry signals only - position reversals are handled automatically by your exchange
⚠️ Always backtest on historical data before live trading
⚠️ Use proper risk management and position sizing
⚠️ Best performance in trending markets; may generate false signals in tight ranges
⚠️ Requires TradingView Premium or higher for webhook functionalityTags
cryptocurrency futures automated-trading ema-crossover rsi webhook delta-exchange tradingview-alerts trend-following momentum bitcoin ethereum crypto-bot algo-trading 15-minute-strategy

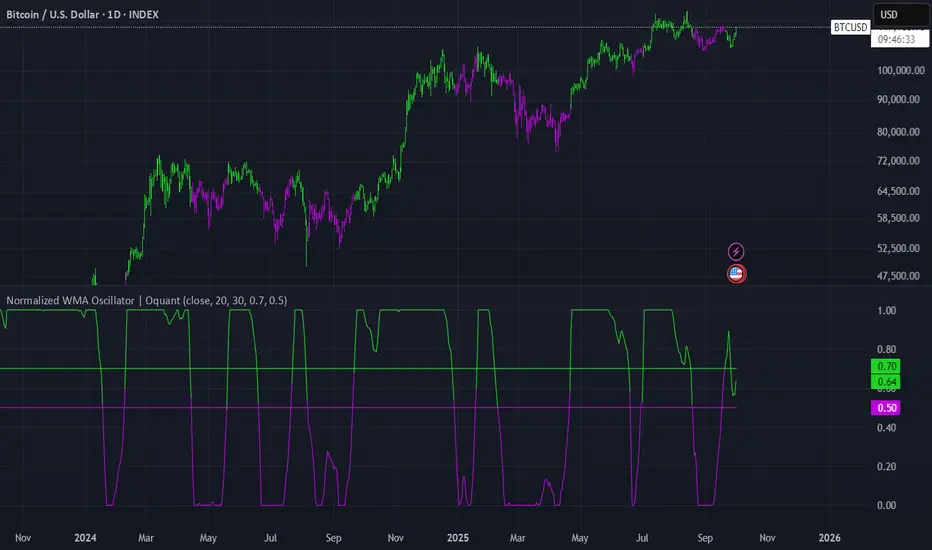
Normalized WMA Oscillator | OquantNormalized WMA Oscillator | Oquant
The Normalized WMA Oscillator is a trend-momentum indicator designed to help traders visualize the relative position of a Weighted Moving Average (WMA) within its recent price range.
What is a WMA and How It Works:
A Weighted Moving Average (WMA) is a type of moving average that gives more weight to recent price data, making it more responsive to price changes compared to a simple moving average. Each price point in the lookback period is multiplied by a weighting factor, with the most recent prices having the highest weights. The WMA helps traders identify potential trends more quickly.
This indicator applies min-max normalization to the standard WMA, scaling its values between 0 and 1 over a configurable lookback period. This allows traders to see whether the WMA is near its recent highs, lows, or midpoint, regardless of the absolute price level.
Key Features:
WMA Source Input: Choose price source for wma calculation.
Customizable WMA Length: Adjust the sensitivity of the WMA.
Min-Max Normalization Length: Smooth the scaling of WMA values between 0 and 1.
Signal Thresholds: Configurable upper and lower thresholds to indicate potential entries.
Visual Alerts: Color-coded oscillator and candles plot for bullish (green) and bearish (purple) signals.
Alerts Ready: Built-in alert conditions for crossovers and crossunders of the oscillator.
How It Works:
Calculate the WMA on the selected source.
Normalize its value using the minimum and maximum WMA values over the specified lookback period.
Generate long signals when the normalized WMA moves above the upper threshold, and short signals when it moves below the lower threshold.
Plot the oscillator and candles in green for bullish signals and purple for bearish signals.
Inputs:
Source: Data used for WMA calculation.
WMA Length: Period for Weighted Moving Average.
Min-Max Length: Lookback period for min-max scaling.
Upper Threshold: Level above which a long signal is considered.
Lower Threshold: Level below which a short signal is considered.
⚠️ Disclaimer: This indicator is intended for educational and informational purposes only. Trading/investing involves risk, and past performance does not guarantee future results. Always test and evaluate indicators/strategies before applying them in live markets. Use at your own risk.
Bayesian Trend Navigator [QuantAlgo]🟢 Overview
The Bayesian Trend Navigator uses Bayesian statistics to continuously update trend probabilities by combining long-term expectations (prior beliefs) and short-term observations (likelihood evidence), rather than relying solely on recent price data like many conventional indicators. This mathematical framework produces robust directional signals that naturally balance responsiveness with stability, making it suitable for traders and investors seeking statistically-grounded trend identification across diverse market environments and asset types.
🟢 How It Works
The indicator operates on Bayesian inference principles, a statistical method for updating beliefs when new evidence emerges. The system begins by establishing a prior belief - a long-term trend expectation calculated from historical price behavior. This represents the "baseline hypothesis" about market direction before considering recent developments.
Simultaneously, the algorithm collects recent market evidence through short-term trend analysis, representing the likelihood component. This captures what current price action suggests about directional momentum independent of historical context.
The core Bayesian engine then combines these elements using conjugate normal distributions and precision weighting. It calculates prior precision (inverse variance) and likelihood precision, combining them to determine a posterior precision. The resulting posterior mean represents the mathematically optimal trend estimate given both historical patterns and current reality. This posterior calculation includes intervals derived from the posterior variance, providing probabilistic confidence bounds around the trend estimate.
Finally, volatility-based standard deviation bands create adaptive boundaries around the Bayesian estimate. The trend line adjusts within these constraints, generating color transitions between bullish (green) and bearish (red) states when the posterior calculation crosses these probabilistic thresholds.
🟢 How to Use
Green/Bullish Trend Line: Posterior probability favoring upward momentum, indicating statistically favorable conditions for long positions (buy)
Red/Bearish Trend Line: Posterior probability favoring downward momentum, signaling mathematically supported timing for short positions (sell)
Rising Green Line: Strengthening bullish posterior as new evidence reinforces upward beliefs, showing increasing probabilistic confidence in trend continuation with favorable long entry conditions
Declining Red Line: Intensifying bearish posterior with accumulating downside evidence, indicating growing statistical certainty in downtrend persistence and optimal short positioning opportunities
Flattening Trends: Diminishing posterior confidence regardless of color suggests equilibrium between prior beliefs and contradictory evidence, potentially signaling consolidation or insufficient statistical clarity for high-conviction trades
🟢 Pro Tips for Trading and Investing
→ Preset Configuration Strategy: Deploy presets based on your trading horizon - Scalping preset maximizes evidence weight (0.8) for rapid Bayesian updates on 1-15 minute charts, Default preset balances prior and likelihood for general applications, while Swing Trading preset equalizes weights (0.5/0.5) for stable inference on hourly and daily timeframes.
→ Prior Weight Adjustment: Calibrate prior weight according to market regime - increase values (0.5-0.7) in stable trending markets where historical patterns remain predictive, decrease values (0.2-0.3) during regime changes or news-driven volatility when recent evidence should dominate the posterior calculation.
→ Evidence Period Tuning: Modify the evidence period based on information flow velocity. Use shorter periods (5-8 bars) for assets with continuous price discovery like cryptocurrencies, medium periods (10-15) for liquid stocks, and longer periods (15-20) for slower-moving markets to ensure adequate likelihood sample size.
→ Likelihood Weight Optimization: Adjust likelihood weight inversely to market noise levels. Higher values (0.7-0.8) work well in clean trending conditions where recent data is reliable, while lower values (0.4-0.6) help during choppy periods by maintaining stronger reliance on established prior beliefs.
→ Multi-Timeframe Bayesian Confluence: Apply the indicator across multiple timeframes, using higher timeframes (Daily/Weekly) to establish prior belief direction and lower timeframes (Hourly/15-minute) for likelihood-driven entry timing, ensuring posterior probabilities align across temporal scales for maximum statistical confidence.
→ Standard Deviation Multiplier Management: Adapt the multiplier to match current uncertainty levels. Use tighter multipliers (1.0-1.5) during low-volatility consolidations to capture early trend emergence, and wider multipliers (2.0-2.5) during high-volatility events to avoid premature signals caused by statistical noise rather than genuine posterior shifts.
→ Variance-Based Position Sizing: Monitor the implicit posterior variance through trend line stability - smooth consistent movements indicate low uncertainty warranting larger positions, while erratic fluctuations suggest high statistical uncertainty calling for reduced exposure until clearer probabilistic convergence emerges.
→ Alert-Based Probabilistic Execution: Utilize trend change alerts to capture every statistically significant posterior shift from bullish to bearish states or vice versa without constantly monitoring the charts.

Bollinger Adaptive Trend Navigator [QuantAlgo]🟢 Overview
The Bollinger Adaptive Trend Navigator synthesizes volatility channel analysis with variable smoothing mechanics to generate trend identification signals. It uses price positioning within Bollinger Band structures to modify moving average responsiveness, while incorporating ATR calculations to establish trend line boundaries that constrain movement during volatile periods. The adaptive nature makes this indicator particularly valuable for traders and investors working across various asset classes including stocks, forex, commodities, and cryptocurrencies, with effectiveness spanning multiple timeframes from intraday scalping to longer-term position analysis.
🟢 How It Works
The core mechanism calculates price position within Bollinger Bands and uses this positioning to create an adaptive smoothing factor:
bbPosition = bbUpper != bbLower ? (source - bbLower) / (bbUpper - bbLower) : 0.5
adaptiveFactor = (bbPosition - 0.5) * 2 * adaptiveMultiplier * bandWidthRatio
alpha = math.max(0.01, math.min(0.5, 2.0 / (bbPeriod + 1) * (1 + math.abs(adaptiveFactor))))
This adaptive coefficient drives an exponential moving average that responds more aggressively when price approaches Bollinger Band extremes:
var float adaptiveTrend = source
adaptiveTrend := alpha * source + (1 - alpha) * nz(adaptiveTrend , source)
finalTrend = 0.7 * adaptiveTrend + 0.3 * smoothedCenter
ATR-based volatility boundaries constrain the final trend line to prevent excessive movement during volatile periods:
volatility = ta.atr(volatilityPeriod)
upperBound = bollingerTrendValue + (volatility * volatilityMultiplier)
lowerBound = bollingerTrendValue - (volatility * volatilityMultiplier)
The trend line direction determines bullish or bearish states through simple slope comparison, with the final output displaying color-coded signals based on the synthesis of Bollinger positioning, adaptive smoothing, and volatility constraints (green = long/buy, red = short/sell).
🟢 Signal Interpretation
Rising Trend Line (Green): Indicates upward direction based on Bollinger positioning and adaptive smoothing = Potential long/buy opportunity
Falling Trend Line (Red): Indicates downward direction based on Bollinger positioning and adaptive smoothing = Potential short/sell opportunity
Built-in Alert System: Automated notifications trigger when bullish or bearish states change, allowing you to act on significant development without constantly monitoring the charts
Candle Coloring: Optional feature applies trend colors to price bars for visual consistency
Configuration Presets: Three parameter sets available - Default (standard settings), Scalping (faster response), and Swing Trading (slower response)

Sine Weighted Trend Navigator [QuantAlgo]🟢 Overview
The Sine Weighted Trend Navigator utilizes trigonometric mathematics to create a trend-following system that adapts to various market volatility. Unlike traditional moving averages that apply uniform weights, this indicator employs sine wave calculations to distribute weights across historical price data, creating a more responsive yet smooth trend measurement. Combined with volatility-adjusted boundaries, it produces actionable directional signals for traders and investors across various market conditions and asset classes.
🟢 How It Works
At its core, the indicator applies sine wave mathematics to weight historical prices. The system generates angular values across the lookback period and transforms them through sine calculations, creating a weight distribution pattern that naturally emphasizes recent price action while preserving smoothness. The phase shift feature allows rotation of this weighting pattern, enabling adjustment of the indicator's responsiveness to different market conditions.
Surrounding this sine-weighted calculation, the system establishes volatility-responsive boundaries through market volatility analysis. These boundaries expand and contract based on current market conditions, creating a dynamic framework that helps distinguish meaningful trend movements from random price fluctuations.
The trend determination logic compares the sine-weighted value against these adaptive boundaries. When the weighted value exceeds the upper boundary, it signals upward momentum. When it drops below the lower boundary, it indicates downward pressure. This comparison drives the color transitions of the main trend line, shifting between bullish (green) and bearish (red) states to provide clear directional guidance on price charts.
🟢 How to Use
Green/Bullish Trend Line: Rising momentum indicating optimal conditions for long positions (buy)
Red/Bearish Trend Line: Declining momentum signaling favorable timing for short positions (sell)
Steepening Green Line: Accelerating bullish momentum with increasing sine-weighted values indicating strengthening upward pressure and high-probability trend continuation
Steepening Red Line: Intensifying bearish momentum with declining sine-weighted calculations suggesting persistent downward pressure and optimal shorting opportunities
Flattening Trend Lines: Gradual reduction in directional momentum regardless of color may indicate approaching consolidation or trend exhaustion requiring position management review
🟢 Pro Tips for Trading and Investing
→ Preset Strategy Selection: Utilize the built-in presets strategically - Scalping preset for ultra-responsive 1-15 minute charts, Default preset for balanced general trading, and Swing Trading preset for 1-4 hour charts and multi-day positions.
→ Phase Shift Optimization: Fine-tune the phase shift parameter based on market bias - use positive values (0.1-0.5) in trending bull markets to enhance uptrend sensitivity, negative values (-0.1 to -0.5) in bear markets for improved downtrend detection, and zero for balanced neutral market conditions.
→ Multiplier Calibration: Adjust the multiplier according to market volatility and trading style. Use lower values (0.5-1.0) for tight, responsive signals in stable markets, higher values (2.0-3.0) during earnings seasons or high-volatility periods to filter noise and reduce whipsaws.
→ Sine Period Adaptation: Customize the sine weighted period based on your trading timeframe and market conditions. Use 5-14 for day trading to capture short-term momentum shifts, 14-25 for swing trading to balance responsiveness with reliability, and 25-50 for position trading to maintain long-term trend clarity.
→ Multi-Timeframe Sine Validation: Apply the indicator across multiple timeframes simultaneously, using higher timeframes (4H/Daily) for overall trend bias and lower timeframes (15m/1H) for entry timing, ensuring sine-weighted calculations align across different time horizons.
→ Alert-Driven Systematic Execution: Leverage the built-in trend change alerts to eliminate emotional decision-making and capture every mathematically-confirmed trend transition, particularly valuable for traders managing multiple instruments or those unable to monitor charts continuously.
→ Risk Management: Increase position sizes during strong directional sine-weighted momentum while reducing exposure during frequent color changes that indicate mathematical uncertainty or ranging market conditions lacking clear directional bias.
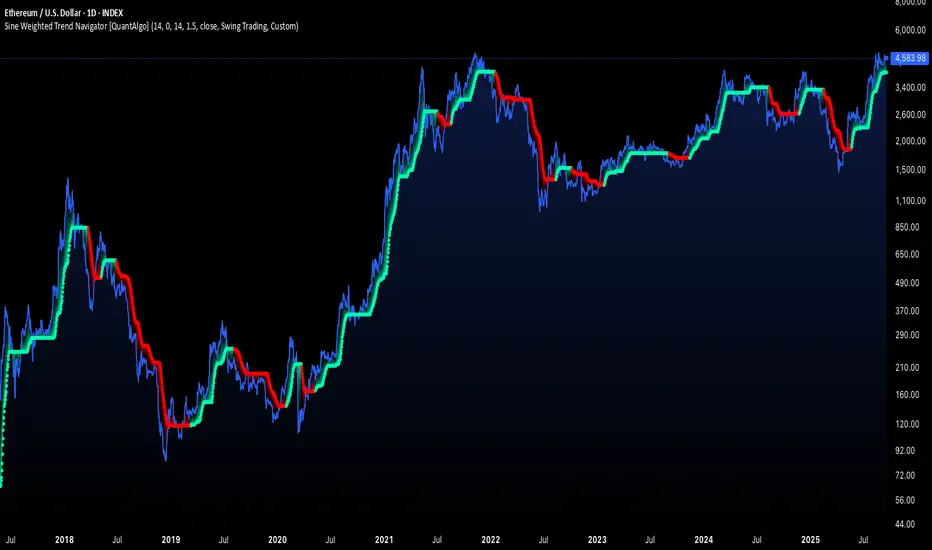
RSI Trend Navigator [QuantAlgo]🟢 Overview
The RSI Trend Navigator integrates RSI momentum calculations with adaptive exponential moving averages and ATR-based volatility bands to generate trend-following signals. The indicator applies variable smoothing coefficients based on RSI readings and incorporates normalized momentum adjustments to position a trend line that responds to both price action and underlying momentum conditions.
🟢 How It Works
The indicator begins by calculating and smoothing the RSI to reduce short-term fluctuations while preserving momentum information:
rsiValue = ta.rsi(source, rsiPeriod)
smoothedRSI = ta.ema(rsiValue, rsiSmoothing)
normalizedRSI = (smoothedRSI - 50) / 50
It then creates an adaptive smoothing coefficient that varies based on RSI positioning relative to the midpoint:
adaptiveAlpha = smoothedRSI > 50 ? 2.0 / (trendPeriod * 0.5 + 1) : 2.0 / (trendPeriod * 1.5 + 1)
This coefficient drives an adaptive trend calculation that responds more quickly when RSI indicates bullish momentum and more slowly during bearish conditions:
var float adaptiveTrend = source
adaptiveTrend := adaptiveAlpha * source + (1 - adaptiveAlpha) * nz(adaptiveTrend , source)
The normalized RSI values are converted into price-based adjustments using ATR for volatility scaling:
rsiAdjustment = normalizedRSI * ta.atr(14) * sensitivity
rsiTrendValue = adaptiveTrend + rsiAdjustment
ATR-based bands are constructed around this RSI-adjusted trend value to create dynamic boundaries that constrain trend line positioning:
atr = ta.atr(atrPeriod)
deviation = atr * atrMultiplier
upperBound = rsiTrendValue + deviation
lowerBound = rsiTrendValue - deviation
The trend line positioning uses these band constraints to determine its final value:
if upperBound < trendLine
trendLine := upperBound
if lowerBound > trendLine
trendLine := lowerBound
Signal generation occurs through directional comparison of the trend line against its previous value to establish bullish and bearish states:
trendUp = trendLine > trendLine
trendDown = trendLine < trendLine
if trendUp
isBullish := true
isBearish := false
else if trendDown
isBullish := false
isBearish := true
The final output colors the trend line green during bullish states and red during bearish states, creating visual buy/long and sell/short opportunity signals based on the combined RSI momentum and volatility-adjusted trend positioning.
🟢 Signal Interpretation
Rising Trend Line (Green): Indicates upward momentum where RSI influence and adaptive smoothing favor continued price advancement = Potential buy/long positions
Declining Trend Line (Red): Indicates downward momentum where RSI influence and adaptive smoothing favor continued price decline = Potential sell/short positions
Flattening Trend Lines: Occur when momentum weakens and the trend line slope approaches neutral, suggesting potential consolidation before the next move
Built-in Alert System: Automated notifications trigger when bullish or bearish states change, sending "RSI Trend Bullish Signal" or "RSI Trend Bearish Signal" messages for timely entry/exit
Color Bar Candles Option: Optional candle coloring feature that applies the same green/red trend colors to price bars, providing additional visual confirmation of the current trend direction

Linear Regression Trend Navigator [QuantAlgo]🟢 Overview
The Linear Regression Trend Navigator is a trend-following indicator that combines statistical regression analysis with adaptive volatility bands to identify and track dominant market trends. It employs linear regression mathematics to establish the underlying trend direction, while dynamically adjusting trend boundaries based on standard deviation calculations to filter market noise and maintain trend continuity. The result is a straightforward visual system where green indicates bullish conditions favoring buy/long positions, and red signals bearish conditions supporting sell/short trades.
🟢 How It Works
The indicator operates through a three-phase computational process that transforms raw price data into adaptive trend signals. In the first phase, it calculates a linear regression line over the specified period, establishing the mathematical best-fit line through recent price action to determine the underlying directional bias. This regression line serves as the foundation for trend analysis by smoothing out short-term price variations while preserving the essential directional characteristics.
The second phase constructs dynamic volatility boundaries by calculating the standard deviation of price movements over the defined period and applying a user-adjustable multiplier. These upper and lower bounds create a volatility-adjusted channel around the regression line, with wider bands during volatile periods and tighter bands during stable conditions. This adaptive boundary system operates entirely behind the scenes, ensuring the trend signal remains relevant across different market volatility regimes without cluttering the visual display.
In the final phase, the system generates a simple trend line that dynamically positions itself within the volatility boundaries. When price action pushes the regression line above the upper bound, the trend line adjusts to the upper boundary level. Conversely, when the regression line falls below the lower bound, the trend line moves to the lower boundary. The result is a single colored line that transitions between green (rising trend line = buy/long) and red (declining trend line = sell/short).
🟢 How to Use
Green Trend Line: Upward momentum indicating favorable conditions for long positions, buy signals, and bullish strategies
Red Trend Line: Downward momentum signaling optimal timing for short positions, sell signals, and bearish approaches
Rising Green Line: Accelerating bullish momentum with steepening angles indicating strengthening upward pressure and potential for trend continuation
Declining Red Line: Intensifying bearish momentum with increasing negative slopes suggesting persistent downward pressure and shorting opportunities
Flattening Trend Lines: Gradual reduction in slope regardless of color may indicate approaching consolidation or momentum exhaustion requiring position review
🟢 Pro Tips for Trading and Investing
→ Entry/Exit Timing: Trade exclusively on band color transitions rather than price patterns, as each color change represents a statistically-confirmed shift that has passed through volatility filtering, providing higher probability setups than traditional technical analysis.
→ Parameter Optimization for Asset Classes: Customize the linear regression period based on your trading style. For example, use 5-10 bars for day trading to capture short-term statistical shifts, 14-20 for swing trading to balance responsiveness with stability, and 25-50 for position trading to filter out medium-term noise.
→ Volatility Calibration Strategy: Adjust the standard deviation multiplier according to market volatility. For instance, increase to 2.0+ during high-volatility periods like earnings or news events to reduce false signals, decrease to 1.0-1.5 during stable market conditions to maintain sensitivity to genuine trends.
→ Cross-Timeframe Statistical Validation: Apply the indicator across multiple timeframes simultaneously, using higher timeframes for directional bias and lower timeframes for entry timing.
→ Alert-Based Systematic Trading: Use built-in alerts to eliminate discretionary decision-making and ensure you capture every statistically-significant trend change, particularly effective for traders who cannot monitor charts continuously.
→ Risk Allocation Based on Signal Strength: Increase position sizes during periods of strong directional movement while reducing exposure during frequent band color changes that indicate statistical uncertainty or ranging conditions.
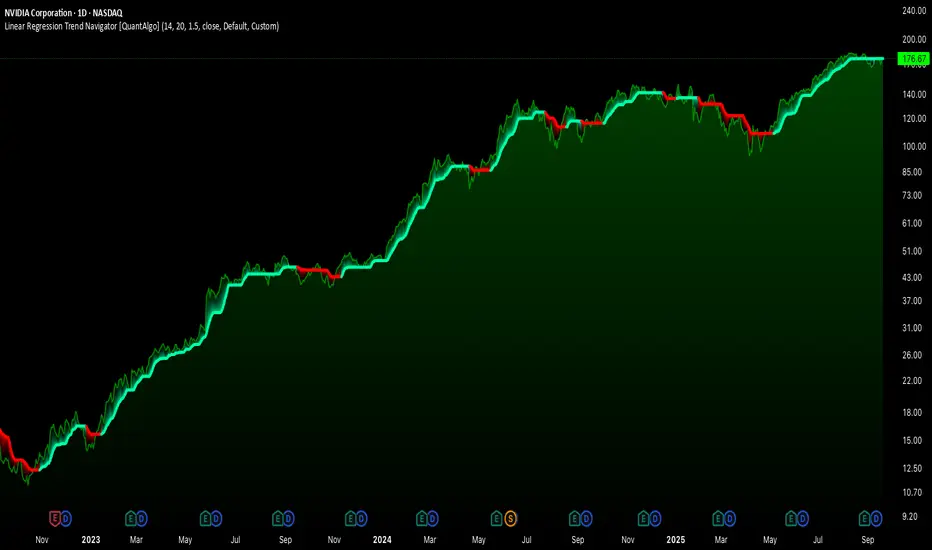
Smart Structure Breaks & Order BlocksOverview (What it does)
The indicator “Smart Structure Breaks & Order Blocks” detects market structure using swing highs and lows, identifies Break of Structure (BOS) events, and automatically draws order blocks (OBs) from the origin candle. These zones extend to the right and change color/outline when mitigated or invalidated. By formalizing and automating part of discretionary analysis, it provides consistent zone recognition.
Main Components
Swing Detection: ta.pivothigh/ta.pivotlow identify confirmed swing points.
BOS Detection: Determines if the recent swing high/low is broken by close (strict mode) or crossover.
OB Creation: After a BOS, the opposite candle (bearish for bullish BOS, bullish for bearish BOS) is used to generate an order block zone.
Zone Management: Limits the number of zones, extends them to the right, and tracks tagged (mitigated) or invalidated states.
Input Parameters
Left/Right Pivot (default 6/6): Number of bars required on each side to confirm a swing. Higher values = smoother swings.
Max Zones (default 4): Maximum zones stored per direction (bull/bear). Oldest zones are overwritten.
Zone Confirmation Lookback (default 3): Ensures OB origin candle validity by checking recent highs/lows.
Show Swing Points (default ON): Displays triangles on swing highs/lows.
Require close for BOS? (default ON): Strict BOS (close required) vs loose BOS (line crossover).
Use candle body for zones (default OFF): Zones drawn from candle body (ON) or wick (OFF).
Signal Definition & Logic
Swing Updates: Latest confirmed pivots update lastHighLevel / lastLowLevel.
BOS (Break of Structure):
Bullish – close breaks last swing high.
Bearish – close breaks last swing low.
Only one valid BOS per swing (avoids duplicates).
OB Detection:
Bullish BOS → previous bearish candle with lowest low forms the OB.
Bearish BOS → previous bullish candle with highest high forms the OB.
Zones: Bull = green, Bear = red, semi-transparent, extended to the right.
Zone States:
Mitigated: Price touches the zone → border highlighted.
Invalidated:
Bull zone → close below → turns red.
Bear zone → close above → turns green.
Chart Appearance
Swing High: red triangle above bar
Swing Low: green triangle below bar
Bull OB: green zone (border highlighted on touch)
Bear OB: red zone (border highlighted on touch)
Invalid Zones: Bull zones turn reddish, Bear zones turn greenish
Practical Use (Trading Assistance)
Trend Following Entries: Buy pullbacks into green OBs in uptrends, sell rallies into red OBs in downtrends.
Focus on First Touch: First mitigation after BOS often has higher reaction probability.
Confluence: Combine with higher timeframe trend, volume, session levels, key price levels (previous highs/lows, VWAP, etc.).
Stops/Targets:
Bull – stop below zone, partial take profit at swing high or resistance.
Bear – stop above zone, partial take profit at swing low or support.
Parameter Tuning (per market/timeframe)
Pivot (6/6 → 4/4/8/8): Lower for scalping (3–5), medium for day trading (5–8), higher for swing trading (8–14). Increase to reduce noise.
Strict Break: ON to reduce false breaks in ranging markets; OFF for earlier signals.
Body Zones: ON for assets with long wicks, OFF for cleaner OBs in liquid instruments.
Zone Confirmation (default 3): Increase for stricter OB origin, fewer zones.
Max Zones (default 4 → 6–10): Increase for higher volatility, decrease to avoid clutter.
Strengths
Standardizes BOS and OB detection that is usually subjective.
Tracks mitigation and invalidation automatically.
Adaptable: allows body/wick zone switching for different instruments.
Limitations
Pivot-based: Signals appear only after pivots confirm (slight lag).
Zones reflect past balance: Can fail after new events (news, earnings, macro data).
Range-heavy markets: More false BOS; consider stricter settings.
Backtesting: This script is for drawing/visual aid; trading rules must be defined separately.
Workflow Example
Identify higher timeframe trend (4H/Daily).
On lower TF (15–60m), wait for BOS and new OB.
Enter on first mitigation with confirmation candle.
Stop beyond zone; targets based on R multiples and swing points.
FAQ
Q: Why are zones invalidated quickly?
A: Flow reversal after BOS. Adjust pivots higher, enable Strict mode, or switch to Body zones to reduce noise.
Q: What does “tagged” mean?
A: Price touched the zone once = mitigated. Implies some orders in that zone may have been filled.
Q: Body or Wick zones?
A: Wick zones are fine in clean markets. For volatile pairs with long wicks, body zones provide more realistic areas.
Customization Tips (Code perspective)
Zone storage: Currently ring buffer ((idx+1) % zoneLimit). Could prioritize keeping unmitigated zones.
Automated testing: Add strategy.entry/exit for rule-based backtests.
Multi-timeframe: Use request.security() for higher timeframe swings/BOS.
Visualization: Add labels for BOS bars, tag zones with IDs, count touches.
Summary
This indicator formalizes the cycle Swing → BOS → OB creation → Mitigation/Invalidation, providing consistent structure analysis and zone tracking. By tuning sensitivity and strictness, and combining with higher timeframe context, it enhances pullback/continuation trading setups. Always combine with proper risk management.
