Finlu Momentum PRO What it does
Finlu Momentum PRO analyzes real price momentum and shows when the market is entering or leaving extreme zones, highlighting potential reversals or continuations with confirmation. It plots clean visual signals and can trigger real-time alerts.
Who it’s for
Traders who want to improve their entry and exit timing while avoiding the noise of traditional oscillators.
Recommended timeframes
15 min, 1 h, 4 h
Markets
Forex, indices, gold and cryptocurrencies.
Includes
Invite-only indicator: Finlu Momentum PRO
10-minute quick-start video guide
Risk management template
How to get access
Purchase access on the official page: finlutrading.systeme.io and enter your exact TradingView username at checkout.
Alternatively, you can send me a DM on Instagram @finlu_trading with the message “Finlu Momentum PRO access” to get the instructions.
Notes
Educational use only. Single-user license. Source code is not disclosed. Redistribution or reselling is strictly prohibited.
Forexsignals

ahax – CRT V0 ahax – CRT V0 is an enhanced CRT indicator that works on candlestick formations and generates BUY/SELL signals when certain conditions are met.
In this version, the classic CRT logic has been supplemented with additional controls for more stable operation, with a particular focus on reducing unnecessary signals. Each signal is generated based on the middle candlestick, and confirmation signals (+/-) can be displayed, if desired, based on the close of the next candle.
The indicator works based on the relationship between the left candlestick, the middle candlestick, and the right candlestick. It provides quick visual feedback on points such as trend reversals, potential manipulation, or reaction zones.
It is designed to be simple, clear, and clean, allowing you to adapt it to your own strategy.
It does not include any risk management or trading recommendations.

Forex Session High/Low TrackerThis indicator maps out each Forex session along with their relative highs and lows.

AI Trading Alerts v6 — SL/TP + Confidence + Panel (Fixed)Overview
This Pine Script is designed to identify high-probability trading opportunities in Forex, commodities, and crypto markets. It combines EMA trend filters, RSI, and Stochastic RSI, with automatic stop-loss (SL) & take-profit (TP) suggestions, and provides a confidence panel to quickly assess the trade setup strength.
It also includes TradingView alert conditions so you can set up notifications for Long/Short setups and EMA crosses.
⚙️ Features
EMA Trend Filter
Uses EMA 50, 100, 200 for trend confirmation.
Bull trend = EMA50 > EMA100 > EMA200
Bear trend = EMA50 < EMA100 < EMA200
RSI Filter
Bullish trades require RSI > 50
Bearish trades require RSI < 50
Stochastic RSI Filter
Prevents entries during overbought/oversold extremes.
Bullish entry only if %K and %D < 80
Bearish entry only if %K and %D > 20
EMA Proximity Check
Price must be near EMA50 (within ATR × adjustable multiplier).
Signals
Continuation Signals:
Long if all bullish conditions align.
Short if all bearish conditions align.
Cross Events:
Long Cross when price crosses above EMA50 in bull trend.
Short Cross when price crosses below EMA50 in bear trend.
Automatic SL/TP Suggestions
SL size adjusts depending on asset:
Gold/Silver (XAU/XAG): 5 pts
Bitcoin/Ethereum: 100 pts
FX pairs (default): 20 pts
TP = SL × Risk:Reward ratio (default 1:2).
Confidence Score (0–4)
Based on conditions met (trend, RSI, Stoch, EMA proximity).
Labels:
Strongest (4/4)
Strong (3/4)
Medium (2/4)
Low (1/4)
Visual Panel on Chart
Shows ✅/❌ for each condition (trend, RSI, Stoch, EMA proximity, signal now).
Confidence row with color-coded strength.
Alerts
Long Setup
Short Setup
Long Cross
Short Cross
🖥️ How to Use
1. Add the Script
Open TradingView → Pine Editor.
Paste the full script.
Click Add to chart.
Save as "AI Trading Alerts v6 — SL/TP + Confidence + Panel".
2. Configure Inputs
EMA Lengths: Default 50/100/200 (works well for swing trading).
RSI Length: 14 (standard).
Stochastic Length/K/D: Default 14/3/3.
Risk:Reward Ratio: Default 2.0 (can change to 1.5, 3.0, etc.).
EMA Proximity Threshold: Default 0.20 × ATR (adjust to be stricter/looser).
3. Read the Panel
Top-right of chart, you’ll see ✅ or ❌ for:
Trend → Are EMAs aligned?
RSI → Above 50 (bull) or below 50 (bear)?
Stoch OK → Not extreme?
Near EMA50 → Close enough to EMA50?
Above/Below OK → Price position vs. EMA50 matches trend?
Signal Now → Entry triggered?
Confidence row:
🟢 Green = Strongest
🟩 Light green = Strong
🟧 Orange = Medium
🟨 Yellow = Low
⬜ Gray = None
4. Alerts Setup
Go to TradingView Alerts (⏰ icon).
Choose the script under “Condition”.
Select alert type:
Long Setup
Short Setup
Long Cross
Short Cross
Set notification method (popup, sound, email, mobile).
Click Create.
Now TradingView will notify you automatically when signals appear.
5. Example Workflow
Wait for Confidence = Strong/Strongest.
Check if market session supports volatility (e.g., XAU in London/NY).
Review SL/TP suggestions:
Long → Entry: current price, SL: close - risk_pts, TP: close + risk_pts × RR.
Short → Entry: current price, SL: close + risk_pts, TP: close - risk_pts × RR.
Adjust based on your own price action analysis.
📊 Best Practices
Use on H1 + D1 combo → align higher timeframe bias with intraday entries.
Risk only 1–2% of account per trade (position sizing required).
Filter with market sessions (Asia, Europe, US).
Strongest signals work best with trending pairs (e.g., XAUUSD, USDJPY, BTCUSD).

Crypto & Forex Intraday LevelsThis indicator automatically Plots the Intraday Bullish and Bearish Levels for Major Crypto and Forex Counters. Preferred time frames are 15/30/60 Minutes
Calculation
Compute the Last 5 days O H L C then calculate H-O and H-L, take average of the difference of H-O and H-L then Minimum Value then the average difference is added with the day opening to get the bullish zone and the average is subtracted from the opening price to get the bearish zone
Trade Ideas
Long Trade Example 1
Buy Above the Bullish Zone
Long Trade Example 2
Buy While taking support from Bearish Zone
Short Trade Example 1
Sell Below the Bearish Zone
Short Trade Example 2
Sell While taking rejection from Bullish Zone
Set Automatic Alerts
You can add alerts to this indicator, so that when the price breaches the Bullish zone or the Bearish Zone it will be notified automatically.

DT_KEY_LEVELSDT_Key_Levels: Powerful Market Structure Analysis Indicator
DT_Key_Levels is an advanced indicator for fundamental market structure analysis, optimized for higher timeframes (D1, W, M). The indicator combines three powerful technical analysis tools — fractals, Fair Value Gaps (FVG), and psychological levels — in one comprehensive solution.
Three Components of the Indicator
1. Enhanced Fractal System
The indicator uses an improved version of Bill Williams' classic fractals, allowing for deeper market structure analysis:
Dual Identification System:
Standard 5-bar fractals (displayed with thick lines) for analyzing reliable support/resistance levels
Light 3-bar fractals (displayed with thin lines) for early identification of potential reversal points
Intelligent Tracking System:
Automatic detection and filtering of completed fractals
Marking fractals with corresponding timeframe designation (HTF-1D, HTF-1W, HTF-1M)
Tracking and marking the All-Time High (ATH)
2. Fair Value Gaps (FVG) System
The indicator identifies and visualizes price gaps in market structure — zones that often act as magnets for future price movements:
Precise Identification of Inefficient Zones:
Bullish FVG: when the current candle's low is above the -2 candle's high
Bearish FVG: when the current candle's high is below the -2 candle's low
Detailed Visualization:
Clear display of upper and lower boundaries of each FVG
Midline (0.5 FVG) for determining key reaction levels within the gap
Marking each FVG with "FF" (Fair value Fill) label for quick identification
Dynamic Management:
Automatic removal of FVGs when they are filled by price movement
Customizable line extension for improved tracking of target zones
3. Intelligent Psychological Levels
The indicator automatically determines key psychological levels with adaptation to the type of instrument being traded:
Specialized Calibration for Various Assets:
Forex (EUR/USD, GBP/USD, USD/JPY): optimization for standard figures and round values
Precious metals (XAUUSD): adaptation to typical gold reaction zones with a $50 step
Cryptocurrencies (BTC, ETH): dynamic step adjustment depending on current price zone
Stock indices (NASDAQ, S&P500, DAX): accounting for the movement characteristics of each index
Smart Adaptation System:
Automatic determination of the optimal step for any instrument
Generation of up to 24 key levels, evenly distributed around the current price
Intelligent filtering to display only significant levels
Practical Application
Strategic Analysis
Identifying Key Structural Levels:
Use monthly and weekly fractals to determine strategic support/resistance zones
Look for coincidences of fractals with psychological levels to identify particularly strong zones of interest
Determine long-term barriers using type 5 fractals on higher timeframes
Analysis of Market Inefficiencies:
Track the formation of FVGs as potential targets for future movements
Use FVG midlines (0.5) as important internal reaction levels
Analyze the speed of FVG filling to understand trend strength
Tactical Trading Decisions
Entry Points and Risk Management:
Use bounces from fractals in the direction of the larger trend as a signal for entry
Place stop-losses behind fractal levels or key psychological levels
Monitor the formation of new fractals as a signal of potential reversal
Determining Target Levels:
Use unfilled FVGs as natural price targets
Apply nearby psychological levels for partial position closing
Project higher timeframe fractals to determine long-term goals
Indicator Advantages
Comprehensive Approach: combining three methodologies for a complete understanding of market structure
Intelligent Adaptation: automatic adjustment to the characteristics of different types of assets
Clean Visual Presentation: despite the abundance of information, the indicator maintains clarity of display
Effective Signal Filtering: automatic removal of completed levels to reduce visual noise
Higher Timeframe Optimization: specifically designed for daily, weekly and monthly charts
Usage Recommendations
Use the indicator only on D1, W, and M timeframes for the most reliable signals
Pay special attention to areas where different types of signals coincide (e.g., fractal + psychological level)
Use higher timeframe fractals as key zones for medium and long-term trading
Track FVGs as potential target zones and focus on their filling

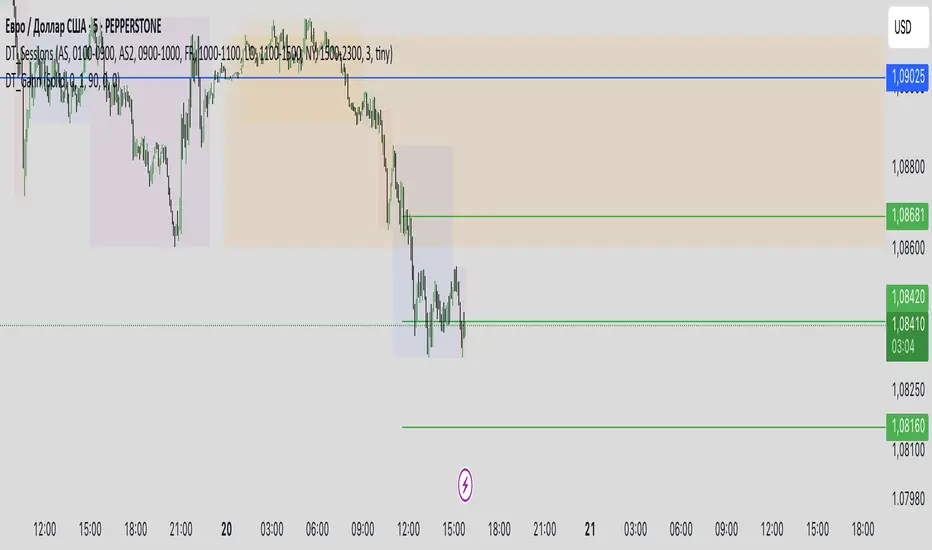
DT_GannDT_Gann - Combined Indicator Description
This TradingView indicator implements W.D. Gann's Square 9 concept with several visual enhancements to help traders identify key support and resistance levels. The indicator automatically adapts to different market types (forex or stocks) and includes the following features:
KEY FEATURES:
Support and resistance levels:
Automatically calculates and displays multiple support and resistance levels based on the Gann square theory of 9, with customizable colors (default green for support, red for resistance).
Day Opening Line:
Shows the day's opening price as a reference point, which serves as the base for all Gann calculations.
Previous 4H Range Box:
Displays a rectangular box showing the high-llow range of the previous day's last 4-hour candle, helping traders identify important price zones.
Vertical Time Lines:
Additional temporary vertical lines marking 4-hour intervals to help visualize potential reversal points.
Reject Mode:
Allows you to fine-tune support and resistance levels using percentage deviations.
CUSTOMIZATION OPTIONS:
Line Styles:
Select a solid, dashed, or dotted line.
Colors:
Adjust colors for support, resistance, daily open line, 4H rectangle and time lines.
Line Width:
Customize the thickness of all lines (1-5 pixels)
Opacity settings:
Control the transparency of various elements
Deviation settings:
Apply percentage adjustments to support and resistance levels
TECHNICAL IMPLEMENTATION:
Indicator:
- Automatically determines the appropriate point values depending on the instrument.
- Calculates Gann levels using the mathematical principle of Square 9.
- Finds the nearest support and resistance levels relative to the current price.
- Creates visualizations based on both charts and lines.
- Dynamically updates as price moves.
USAGE:
This indicator is especially useful for swing traders and day traders who follow Gann methods. The combination of price levels (support/resistance) and time markers (vertical lines) helps identify potential reversal zones where price and time align according to Gann principles.
The previous day's 4-hour rectangular frame often serves as an important reference zone that price can return to or respect.
The indicator works on all timeframes, but is most effective on charts from 15-minute to 4-hour charts, where time-based components provide the most value.
Weekly RSI Buy/Sell SignalsWeekly RSI Buy/Sell Signal Indicator
This indicator is designed to help traders identify high-probability buy and sell opportunities on the weekly chart by using the Relative Strength Index (RSI). By utilizing weekly RSI values, this indicator ensures signals align with broader market trends, providing a clearer view of potential price reversals and continuation.
How It Works:
Weekly RSI Calculation: This script calculates the RSI using a 14-period setting, focusing on the weekly timeframe regardless of the user’s current chart view. The weekly RSI is derived using request.security, allowing for consistent signals even on intraday charts.
Signal Conditions:
Buy Signal: A buy signal appears when the RSI crosses above the oversold threshold of 30, suggesting that price may be gaining momentum after a potential bottom.
Sell Signal: A sell signal triggers when the RSI crosses below the overbought threshold of 70, indicating a possible momentum shift downwards.
Visual Cues:
Buy/Sell Markers: Clear green "BUY" and red "SELL" markers are displayed on the chart when buy or sell conditions are met, making it easy to identify entry and exit points.
RSI Line and Thresholds: The weekly RSI value is plotted in real time with color-coded horizontal lines at 30 (oversold) and 70 (overbought), providing a visual reference for key levels.
This indicator is ideal for traders looking for reliable, trend-based signals on higher timeframes and can be a helpful tool for filtering out shorter-term market noise.

Order Flow / Delta Volume IndicatorOrder Flow / Delta Volume Indicator
The Order Flow / Delta Volume Indicator is designed to give traders a comprehensive view of market activity by combining delta volume analysis, order flow imbalances, and momentum filters. This indicator is not just a mashup of components, but a carefully crafted tool that enhances decision-making by integrating various layers of market analysis into one powerful system.
How the Components Work Together:
1. Delta Volume Bars: The core of this indicator, delta volume shows the difference between buy and sell orders, allowing traders to see real-time shifts in market sentiment. Green bars indicate buy-side pressure, while red bars show sell-side dominance. By visualizing this in bar form, traders can easily spot significant shifts in order flow that could signal trend changes or momentum shifts.
2. Cumulative Delta Line (Rescaled): The cumulative delta is rescaled to plot under the price candles, giving traders a clear, contextualized view of how net buyer or seller dominance is developing over time. This line helps identify potential market reversals when price moves diverge from cumulative delta trends.
3. Order Flow Imbalance Detection: Imbalances in buy and sell volumes are automatically detected using a threshold, ensuring that traders are alerted to significant market moves. These imbalances provide insight into aggressive buying or selling behavior, which is crucial for identifying points of high trading activity or potential breakout/reversal zones.
4. VWAP Filter: Volume Weighted Average Price (VWAP) is included as a filter to confirm trend direction. The VWAP ensures that buy signals are only triggered when price action is above the VWAP (indicating strength), and sell signals are triggered when price is below the VWAP (indicating weakness). This ensures that signals are not just based on volume, but also on where price is relative to a critical benchmark.
5. RSI Filter: The inclusion of the Relative Strength Index (RSI) adds a momentum check to the signals. By using RSI, traders can avoid taking trades during low-momentum periods, ensuring they only act when market conditions favor a stronger move.
6. Signal Cooldown Feature: To avoid clutter and noise from frequent signals, this indicator includes a cooldown period between signals, ensuring that traders don’t receive excessive alerts in a short timeframe. This feature prevents overtrading and helps focus on high-quality signals.
Why This Combination is Useful:
• Comprehensive Market Insight: By combining delta volume analysis with order flow imbalance detection, this indicator provides a deep understanding of market sentiment, showing not only price movement but the underlying volume dynamics driving those moves.
• Signal Accuracy: The VWAP and RSI filters ensure that signals are only generated in strong market conditions, filtering out weak or false signals that often occur in choppy markets.
• Divergence Detection: The cumulative delta line provides traders with a tool for spotting divergences between price action and underlying volume, allowing for earlier detection of potential reversals.
This indicator is more than a simple combination of existing tools—it’s a strategic fusion of volume analysis, order flow, and momentum filters designed to provide traders with a clearer view of market activity and to generate more reliable buy/sell signals.
This description explains how the components work together and highlights the indicator’s usefulness, which should address TradingView’s concerns about originality and purpose.

Trend Filtered Signals with Confidence LevelThe Trend Filtered Signals with Confidence Level is a powerful technical analysis tool designed for trend-following traders. It provides clear buy and sell signals, enhanced by a unique confidence level indicator, helping traders filter out market noise and focus on higher-probability trades. This indicator is built with advanced trend detection, volatility filtering, and volume confirmation, making it suitable for various markets such as stocks, forex, and cryptocurrencies.
Key Features:
Precise Trend Detection:
The indicator uses the Average Directional Index (ADX) to measure the strength of the trend, only generating signals when the trend is strong enough (above a user-defined threshold). This prevents false signals during sideways markets and ensures the system follows meaningful trends.
Buy and Sell Signals:
Buy signals are generated when the price crosses above the fast moving average, and the market is in a strong uptrend based on ADX and other filters. Conversely, sell signals are created when the price crosses below the fast moving average in a strong downtrend. These signals appear directly on the chart with visual markers, making them easy to spot in real-time trading.
Confidence Level for Signals:
Each buy and sell signal is given a confidence percentage, calculated from multiple factors:
The strength of the trend (ADX).
The price’s relationship to moving averages (fast MA and slow MA).
The current trading volume compared to its moving average.
The distance between the price and the moving averages, which is checked against the ATR (Average True Range).
A higher confidence percentage indicates a stronger, more reliable signal. Traders can choose to act only on signals that meet or exceed their preferred confidence level.
ATR-Based Volatility Filtering:
To avoid over-trading or receiving signals that are too close together, the ATR (Average True Range) is used as a volatility filter. This ensures that the signals are spaced out, and traders only receive alerts when the price has moved a meaningful distance, considering market volatility.
Volume Confirmation:
Volume plays a crucial role in signal accuracy. The indicator compares the current volume to its moving average, ensuring that signals are generated only when there is sufficient market participation. This feature helps traders avoid signals during low-volume or illiquid market conditions.
Exit Alerts for Trend Reversals:
The indicator doesn’t just help you enter trades; it also assists with exits. When the trend shows signs of weakening or reversing (such as price crossing back over the moving average or losing ADX strength), the indicator will issue an exit alert, helping traders lock in profits or minimize losses.
How to Use the Indicator:
Choosing Timeframes:
The Trend Filtered Signals with Confidence Level works on multiple timeframes. For intraday traders, it can be applied on 5-minute or 15-minute charts. Swing traders might prefer the 1-hour or daily timeframe to capture longer-term trends. Adjust the inputs based on the volatility of the asset you're trading and the timeframe.
Customizing Inputs:
ADX Length: Defines the length for calculating ADX. A typical setting is 14, but this can be adjusted based on how quickly or slowly you want the indicator to react to changes in trend strength.
ADX Threshold: Set this value to filter out weak trends. The default is 20, but for stronger trend signals, a threshold of 25 or 30 may be more suitable.
ATR Length & Multiplier: Used to calculate the average true range, helping to filter out signals that are too close to each other. The ATR multiplier increases the signal’s precision in volatile markets.
Fast and Slow Moving Averages: These moving averages help define the short- and long-term trend. The default fast MA is 9, and the slow MA is 21, but traders can adjust these based on their strategy.
Volume MA: Defines the length of the moving average applied to volume. A longer setting may be more appropriate for swing trading, while a shorter setting can work better for day trading.
Interpreting the Confidence Percentage:
Signals with a confidence level above 50% are generally considered reliable. However, traders can choose to filter trades based on their risk tolerance by only acting on signals above a certain confidence level (e.g., 70% or higher for conservative traders).
Use the confidence percentage as a guide to increase the likelihood of entering higher-probability trades.
Signal Alerts:
The indicator provides customizable alerts for both buy and sell signals. It also generates alerts when it's time to exit a position due to weakening trend conditions.
Alerts can be set up through TradingView’s alert system to notify you via mobile, email, or browser pop-up, so you never miss an opportunity.
Managing Entries and Exits:
Combine the buy and sell signals with the confidence level to time entries more effectively. After entering a position, keep an eye on the exit signals generated by the indicator to manage your trades.
For trend-following strategies, stay in the trade as long as the indicator shows a strong trend. When the confidence level drops significantly, or the exit alert triggers, it may be time to close the trade.
Inputs Overview:
ADX Length: Default 14, for trend strength.
ADX Threshold: Default 20, minimum trend strength for signal generation.
ATR Length & Multiplier: Adjust for volatility filtering.
Fast MA & Slow MA Lengths: Define the short-term and long-term trend.
Volume MA Length: Confirm signals with volume strength.
Minimum Signal Distance: Prevents excessive signal clustering.
Conclusion:
The Trend Filtered Signals with Confidence Level indicator by Danytradehit is a comprehensive tool that not only identifies trends and trend reversals but also helps you gauge the reliability of each signal through a confidence percentage. It simplifies decision-making for traders by filtering out weak or low-probability trades, ensuring you only act on the most promising market opportunities. This indicator is highly customizable and works across various timeframes and asset classes.

Sniper Entry Indicator, Crypto, Forex, Indices, I ndicator Description:
Momentum & Sideways Market Detector is a powerful TradingView indicator that combines the strengths of RSI (Relative Strength Index) and Moving Averages to identify market momentum and detect sideways movements. This versatile tool is designed to work effectively across various asset classes, including Cryptocurrencies, Forex pairs, Gold, and major stock indices like Nifty, BankNifty, Finifty, and Midcap.
Key Features:
Momentum Detection: The indicator uses RSI to gauge market momentum, highlighting overbought and oversold conditions to signal potential reversals by Displaying strength on the chart, above 90 it will be overbought and check for reversal trade, below 10 it will be oversold and check for the long opportunity.
Sideways Market Identification: It utilizes a combination of Moving Averages to detect low-volatility periods and sideways market conditions, helping traders avoid choppy markets. Area or label highlighted by blue means it is sideways, you can ignore entries in this zone.
Multi-Asset Compatibility: The indicator is optimized to perform well on diverse asset classes, including Crypto, Forex, Commodities, and Equity Indices, making it a versatile tool for traders of all types. It is compatible with Indian indices as well giving trader opportunity to see live trade with strike price entry and sl. It also trails the SL when reached the first target.
Customizable Parameters: Users can adjust RSI and Moving Average settings to suit their trading style and timeframe preferences.
Settings:
Stock/Option (Whether you want to trade Sport or it's option, if unchecked it will look for expiry of the stock option, month, and year, user also needs to provide the call and put option)
Spot Symbol (I have provided some of the spot symbols for the selection which will help him to configure it's F&O )
Backtest Day (User can backtest the data by changing the day to previous lookback, it is a very good feature to test the results.)
Remove lines from the table (If table is too long, i have provided the option to remove some of the lines from the table, provide number to remove the lines)
This indicator is a must-have for traders looking to enhance their strategy by accurately identifying market conditions and adapting their trades accordingly.

NOVO ALGO - Starry SkyGeneral Description:
This indicator provides the possible buy and sell entry with the estimated risk and its corresponding Stop Loss (SL) value.
It has originally developed for 1-min chart and works the best on this time-frame. It may work on the other time-frames, but its profitability has not been checked. So, I would rather recommend to use and apply it only on 1-min chart.
Novelty of the indicator:
Trading in 1-min chart consists of dealing with so many small swings and price variations which are very local and does not affect the general trend even in the 5-min time frame.
We call these small price variations and swings 'Noise'.
The novelty of the indicator is in a parameter which we call the Noise Level and filtering length.
It has been widely used in the Fluid Dynamics and in the Large Eddy Simulations where small noises of flow is removed by a dynamic filter.
In this indicator, we have tried to incorporate the same idea but in the price trend detection.
For the current version, we have used a less tolerance for noise level which results in much less signals compared to the full capacity of the indicator. It roughly sends out around 10-15% of the total confirmed positions.
How it detects the entry positions
To define the entry point, 5 main properties are considered and checked at 3 main time frames including 1-min, 5-min, and 15-min.
These time-frames are selected based on the fact that the target chart is in 1-min.
The 5 properties evaluated are:
1- Smooth Moving Average
2- Bollinger Band
3- Price Regression
4- Candle Pattern
5- Volume
Detailed Description:
Detect a possible entry by Smooth Moving Average:
- At each time frame, 3 lengths are considered to calculate the price moving average values; i.e. short, medium and long lengths.
- The interaction of these MAs, of course, defines the local trend of the price generally. It also provides an idea about the strength of the trend.
- The information calculated at 1-min time frame triggers the possible buy/sell. However, it waits until getting confirmation from the upper time frame (5-min).
- We use the MAs of 15-min time frame to define the general dominant price trend and stop reverse signals when the trend is fully dominant in one direction.
When a possible entry position is triggered by the MAs, at that very price bar we calculate the noise level.
If the noise level is higher than a certain predefined value, then the signal is rejected. Otherwise the signal gets out.
The threshold we use to define if a signal is noisy or not is normalized so it can be used without any concern at different markets.
We believe the calculations and ideas behind the Noise Level is what makes this indicator unique and practical.
We define the noise level parameter based on the following properties:
1- Smooth Moving Average at upper time frame (basically 15-min):
If a possible signal is against the trend of the upper time-frame, the noise level is increased.
If it is in the direction of the upper time-frame trend, then the noise level is untouched.
As already mentioned, different lengths are used. So, as the length of MA is larger its impact on the noise level is considered higher.
2- Bollinger Band of upper time frames (5-min and 15-min)
We employ bollinger bands to define 4 regions.
1. Above the upper band
2. Between middle and upper band
3. Between Lower and middle bands
4. Below the lower band
Then use these 4 regions along with the candle position and price regression.
For example, if the price regression line and candle position are on the same region of BB, then we assume less possibility for reverse or strong trend.
Consequently, we increase the noise level parameter. On the other hand, if they belong to two different region, we assume more possibility for big price change, and so we lower the noise level.
3- Price Regression
We use average price regression line to filter out very small swings in the price. We have also set a criterion of continuity for the regression line that ensures small price variation and swings are left out and filtered.
This will come with the sot of delay in the confirmation of signal, but we found it very important to remove very small swings of price that, for example, consists of only few bars in 1-min chart.
We have also used the position of the regression line along with the regions defied by BBs to evaluate the strength of a newly detected trend.
As candles will always reach to the regression at some point, if a possible entry is detected and the regression line and candles belong to two different region, we assume a strong price change. But if they belong to the same region, we increase the noise level and will assume that it might be a small swing.
4- Candle Pattern
We assumed several rules for candles shape and prices to define if a price movement is strong or it is just a small swing. For example we expect the price to be increase in the last 2-3 candles if we should call a entry for long position.
These set of self-made rules have been extracted by using the visual inspections of the price movement. This has been done much more advanced for long entry position which has resulted in more long signals by the indicator.
5- Volume
We use volume of trades in 1-min, 5-min, and 15-min to evaluate the strength of the trend. We use both absolute and what we call directional volume! The directional volume is the volume with the sign of the candle. This helps us to know if the reverse trend supported by enough volume or it is just a small swing.
For example, if the directional volume of 1-min can surpass the 5-min directional volume, this indicates to us that the importance of 5-min data and its validity is less. So, more focus will be put on the 1-min volume data and the direction it indicates.
Money Management:
Profit calculation: the profit is calculated based on the user defined leverage (default 100x). The user has the option to change the buy/sell leverages to the desired values.
Risk assessment: The user has the option to adjust the risk of the trades. Then the SL value will be calculated for each trade according to the defined risk value.
If a value of zero is set for the risk, then the indicator will define the local SL of each trade based on the pivot point.
As in 1-min trading, the prices are noise and include several small swings and consequently several minor pivot points, we filtered the pivot points that belong to the super small swings detected by our noise level indicator.
Suggestion
I found it more profitable to make the trades risk-free when their profits passes 10% (with leverage 100x). Then, readjust the TP of trades if the trend is in the direction of the position.
I would recommend to observe the performance of the indicator for a day or two, before actually trading with its signals. This will help to have a better understanding of the leverage and risk you may apply.

Tripart Super Forex IndicatorOverview
The “Tripart Super Forex Indicator” is an advanced trading tool designed specifically for intraday trading and scalping. It combines the power of Exponential Moving Averages (EMAs), Average True Range (ATR), and the Relative Strength Index (RSI) to generate precise buy and sell signals. This indicator helps traders identify trend direction, volatility, and momentum, ensuring well-timed entry and exit points in the forex market.
What It Does
The Tripart Super Forex Indicator provides traders with the following:
1. Entry Signals: Buy and sell signals are generated based on the crossover of short-
term and long-term EMAs combined with ATR-based volatility filtering.
2. Exit Signals: Exit signals are generated using RSI to identify overbought and oversold
conditions, ensuring timely exits to lock in profits.
3. Trailing Stop-Loss: Dynamic trailing stop-loss levels are calculated using ATR to
manage risk effectively during trades.
How It Works
1. Exponential Moving Averages (EMAs):
• Short-term EMA: Represents recent price trends, reacting quickly to price changes.
• Long-term EMA: Represents longer price trends, providing a smoother view of the
market direction.
• Buy Signal: Generated when the short-term EMA crosses above the long-term EMA,
and the closing price is above the long-term EMA plus a multiple of the ATR.
• Sell Signal: Generated when the short-term EMA crosses below the long-term EMA,
and the closing price is below the long-term EMA minus a multiple of the ATR.
2. Average True Range (ATR):
• Measures market volatility.
• Used to filter out signals during low volatility periods, ensuring trades are only taken
during significant price movements.
• ATR is also used to calculate dynamic trailing stop-loss levels to protect gains and
manage risk.
3. Relative Strength Index (RSI):
• Measures the speed and change of price movements.
• Exit Buy Signal: Triggered when RSI falls below the overbought level minus a defined
threshold, indicating potential for price reversal.
• Exit Sell Signal: Triggered when RSI rises above the oversold level plus a defined
threshold, indicating potential for price reversal.
• Helps ensure exits are timely and consistent with momentum changes.
How to Use It
1. Adding the Indicator :
• Add the “Tripart Super Forex Indicator” to your chart from the TradingView library.
• The indicator will overlay buy and sell signals on the price chart and plot EMAs if
enabled.
2. Configuring Settings :
• Customize the EMA lengths, ATR length, ATR multiplier, RSI length, RSI overbought
and oversold levels, and RSI exit threshold to suit your trading strategy.
• Optionally enable or disable the display of EMAs and ATR on the chart for a cleaner
view.
3. Interpreting Signals :
• Buy Signal: Look for green “Buy” labels below the candlesticks indicating a potential
long entry.
• Sell Signal: Look for red “Sell” labels above the candlesticks indicating a potential
short entry.
• Exit Buy Signal: Look for yellow “Exit Buy” labels below the candlesticks indicating a
recommended exit from long positions.
• Exit Sell Signal: Look for orange “Exit Sell” labels above the candlesticks indicating a
recommended exit from short positions.
4. Risk Management :
• Use the dynamic trailing stop-loss levels plotted on the chart to manage open trades
and protect profits.
• Adjust the trailing stop multiplier based on your risk tolerance and market conditions.
Concepts Underlying Calculations
• Trend Detection: Utilizes the crossover of short-term and long-term EMAs to identify
trend direction and potential entry points.
• Volatility Filtering: Incorporates ATR to filter signals during low volatility periods,
ensuring trades are taken during significant price movements.
• Momentum-Based Exits: Uses RSI to detect overbought and oversold conditions for
timely exits, preventing premature or delayed exits.
By integrating these concepts, the Tripart Super Forex Indicator provides a comprehensive and robust tool for intraday trading and scalping, helping traders make informed decisions and improve their trading performance.
Feel free to reach out for further support or clarification on using the Tripart Super Forex Indicator. Happy trading!

Hull WavesThe Hull Waves indicator is based on the Hull Moving Averages (HMA), which are special moving averages that stand out for their ability to filter out market noise and offer a clearer view of price trends. Compared to traditional moving averages, HMAs are more responsive yet smoother, allowing traders to capture significant price movements without getting overwhelmed by short-term fluctuations.
The HMAs integrated into Hull Waves provide two distinct perspectives on the price trend:
8-period HMA: This short-term HMA is extremely reactive and closely follows price changes. It is ideal for capturing short-term trading signals while the medium-term 21-period HMA offers a more balanced view of price trends and identifies medium-term trends.
By crossing HMAs, traders can efficiently identify trend reversal points or strong market continuations.
Another feature of the indicator is the “fan” of dynamic lines, which acts as a visual float for price candles, allowing traders to quickly evaluate trading opportunities.
The "fan" or float of dynamic lines represents a visual representation of the candle's price movements. These lines extend from the start point to the end point, like an open fan. This visual approach makes the market dynamics immediately evident.
Strategy:
Long Entry Signal (Buy):
When the Hull Waves range shows a series of upward sloping lines and the Hull Moving Averages (e.g. 8-period HMA) crosses the 21-period HMA upwards, it is a long entry signal.
Confirmation of the signal can come from an increase in trader volume or other supporting indicators.
Place a buy order at the next closing price.
Short Entry Signal (Sell):
When the Hull Waves range shows a series of downward sloping lines and the Hull Moving Averages (e.g. 8-period HMA) crosses the 21-period HMA downward, it is a short entry signal.
Confirm the signal with an increase in trader volume or other relevant indicators.
Place a sell order at the next closing price.
Exit Signal (Closing a Position):
To close a long position, wait for a signal reversal, such as the Hull Moving Averages crossing downwards or a change in the Hull Waves range.
To close a short position, wait for a signal reversal, such as the Hull Moving Averages crossing higher or a change in the Hull Waves range.

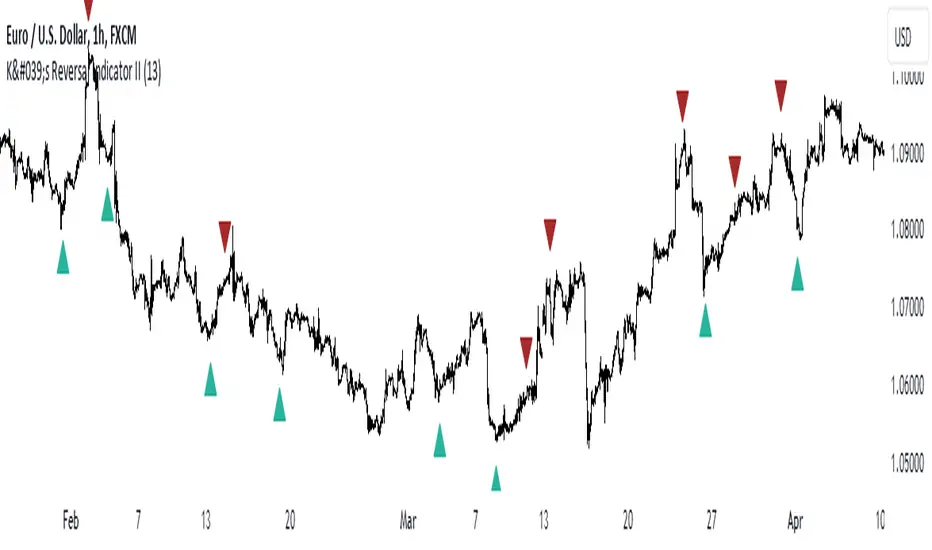
K's Reversal Indicator IIK’s Reversal Indicator II uses a moving average timing technique to deliver its signals. The method of calculation is as follows:
* Calculate a moving average (by default, a 13-period moving average).
* Calculate the number of times where the market is above its moving average. Whenever that number hits 21, a bearish signal is generated, and whenever that number if zero, a bullish signal is generated.
The indicator signals short-term to mid-term reversals as a mean-reversion move.
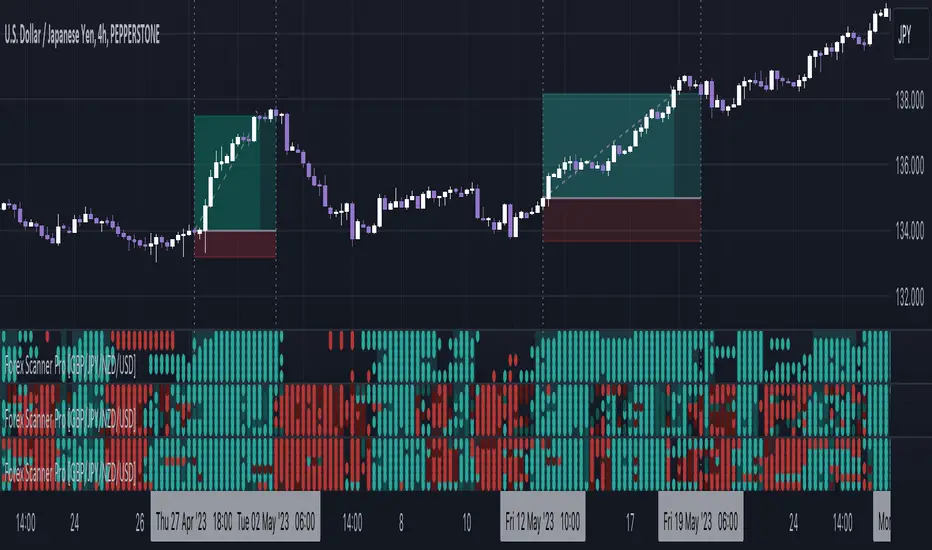
Forex Scanner Pro - GBP/JPY/NZD/USD [FxScripts]Forex Scanner Pro is both a multi-functional indicator and market scanner combined. The combination allows you to have multiple eyes across the market, all from a single chart.
The scanner is comprised of an intuitively designed 3-in-1 tool that tracks the key metrics that drive markets. Each use advanced algorithms to gather information from multiple data points, distilled into one simplified view.
***** TREND SCANNER *****
The first indicator featured on the chart is the Trend Scanner, this allows you to track price action across the wider market. Instantly see pattern shifts and emerging trends; when the market moves, you move with it.
***** MOMENTUM SCANNER *****
The second is the Momentum Scanner which offers a realtime representation of momentum shifts as they occur. This allows you to monitor false breakouts and catch the moves that matter.
***** VOLUME SCANNER *****
The third is the Volume Scanner which provides unique insight into where buy and sell volume is being placed across the market. It offers a further way of determining entry and exit points or simply confirmation that a trend is underway.
***** HOW IT WORKS *****
1. The scanner surveys the market looking for strengths and weaknesses in Trend, Momentum or Volume.
2. It displays the underlying strength or weakness as a series of dots with up to six green dots showing strength and up to six red dots showing weakness.
3. Lighter colored dots are displayed where the strength of the trend, momentum or volume is lesser; if a dot is missing this is a sign of market neutrality.
4. All scanners have a sensitivity setting plus a volatility filter which can be adjusted according to your style of trading and the underlying instrument (full details below).
5. The background can be set to color-fill when the majority of dots are coloured either red or green, with higher values denoting greater strength or greater weakness.
6. Alerts can be configured in the same way as the background to provide both entry and exit signals (further details below).
***** INSTRUMENTS *****
Due to computational restraints, the scanner is split across two different indicators. This one features GBP, JPY, NZD and USD; the other AUD, CAD, CHF and EUR. Both form part of the same package.
Forex Scanner Pro works effortlessly with any of the following major or minor crosses:
AUDCAD, AUDCHF, AUDJPY, AUDNZD, AUDSGD, AUDUSD, CADCHF, CADJPY, CADSGD, CHFJPY, EURAUD, EURCAD, EURCHF, EURGBP, EURJPY, EURNZD, EURSGD, EURUSD, GBPAUD, GBPCAD, GBPCHF, GBPJPY, GBPNZD, GBPSGD, GBPUSD, NZDCAD, NZDCHF, NZDJPY, NZDUSD, SGDJPY, USDCAD, USDCHF, USDJPY, USDSGD
***** SETTINGS OVERVIEW *****
The scanner features the following customizable settings:
~~ Trend Settings ~~
▶ Trend Filter - adjusting this will allow you to focus on short term trends (most suitable for scalping), medium or long term (best for swing trading).
▶ Countertrend Strength - increases the sensitivity of weaker vs stronger countertrends. As countertrends are trends that run against the main trend, this will assist in detecting the strength of a pullback or reversal and allow you to either hold, exit or reverse the trade with confidence.
~~ Momentum Settings ~~
▶ Momentum Filter - increase or decrease the sensitivity of the momentum scanner. Increase to avoid periods of low or weak momentum, decrease to highlight stronger surges in momentum.
~~ Volume Settings ~~
▶ Volume Filter - increase or decrease the sensitivity of the volume scanner. Increase to avoid periods where buy and sell volume can potentially cancel each other out.
~~ Volatility Settings ~~
▶ Volatility Offset - use this to fine tune the volatility filter. A higher value generally delays the volatility filter allowing for confirmation of stronger trends, a lower value will detect trend, momentum or volume movement sooner but may be less accurate.
▶ Each scanner has its own setting allowing you to adjust how you monitor the underlying volatility for each.
▶ As with all settings, we recommend adjusting this to your style of trading, instrument and timeframe.
~~ Alerts ~~
Alerts can be configured to send notifications when anything from 4-6 bullish or bearish dots are showing. Exit markers can be configured when anything from 2+ dots are revealed. This adds an extra layer of sensitivity for traders who appreciate complete control over their trade.
~~ Display Settings ~~
You have the ability to hide all colored dots and only show the background or, alternatively, hide the background and only show colored dots.
***** TRIAL PERIOD *****
We offer a FREE, no questions asked, 7-day trial with every new registration. Visit the link below to register.
EMA Power BandsHello!
Today, I am delighted to introduce you to the "EMA Power Bands" indicator, designed to assist in identifying buying and selling points for assets moving in the markets.
Key Features of the Indicator:
EMA Bands: "EMA Power Bands" utilizes Exponential Moving Average (EMA) to create trend lines. These bands automatically expand or contract based on the price trend, adapting to market conditions.
ATR-Based Volatility: The indicator measures price volatility using the Average True Range (ATR) indicator, adjusting the width of the EMA bands accordingly. As a result, wider bands form during periods of increased volatility, while they narrow during lower volatility.
RSI-Based Buy-Sell Signals: "EMA Power Bands" uses the Relative Strength Index (RSI) to identify overbought and oversold zones. Entering the overbought zone generates a sell signal, while entering the oversold zone produces a buy signal.
Trend Direction Identification: The indicator assists in determining the price trend direction by analyzing the slope of the EMA bands. This allows you to identify periods of uptrends and downtrends.
Visualization of Buy-Sell Signals: "EMA Power Bands" visually marks the buy and sell signals:
- When RSI enters the overbought zone, it displays a sell signal (🪫).
- When RSI enters the oversold zone, it indicates a buy signal (🔋).
- When a candle closes above the emaup line, it displays a bearish signal (🔨).
- When a candle closes below the emadw line, it indicates a bullish signal (🚀).
By using the "EMA Power Bands" (EMA Güç Bantları) indicator, especially in trend-following strategies and periods of volatility, you can make more informed and disciplined trading decisions. However, I recommend using it in conjunction with other technical analysis tools and fundamental data.
*You can also use it with CCI as an example.
With this indicator, you can identify potential trend reversals in advance and strengthen your risk management strategies.
So, go ahead and try the "EMA Power Bands" (EMA Güç Bantları) indicator to enhance your technical analysis skills and make more informed trading decisions!

BBO-ALPHA-PHANTOMHello friends, this is the second time I am publishing this script, hopefully the description will be sufficient and you can use it reliably.
Script Description:
The script consists of several indicators and generates buy and sell signals based on their calculations. Here's a breakdown of the functions and indicators used in the script:
Moving Average Convergence Divergence (MACD):
Fast Length: The number of periods used for calculating the fast moving average.
Slow Length: The number of periods used for calculating the slow moving average.
Source: The price source used for calculations (default is the closing price).
Signal Smoothing: The number of periods used for smoothing the signal line.
Oscillator MA Type: The type of moving average used for the oscillator line (default is Exponential Moving Average).
Signal Line MA Type: The type of moving average used for the signal line (default is Exponential Moving Average).
Benefit: MACD is a trend-following momentum indicator that helps identify potential trend reversals, bullish or bearish market conditions, and generate buy and sell signals based on the crossovers of the oscillator and signal lines.
Relative Strength Index (RSI):
RSI Length: The number of periods used for calculating RSI.
RSI Source: The price source used for RSI calculations (default is (high + low + close) / 3).
MA Type: The type of moving average used for smoothing RSI values (default is Simple Moving Average).
MA Length: The number of periods used for smoothing RSI values.
Benefit: RSI is a momentum oscillator that measures the speed and change of price movements. It helps identify overbought and oversold conditions, potential trend reversals, and generate buy and sell signals based on the crossovers of RSI and its moving average.
Money Flow Index (MFI):
MFI Length: The number of periods used for calculating MFI.
Source: The price source used for MFI calculations (default is (high + low + close) / 3).
Benefit: MFI is a momentum indicator that uses both price and volume data to measure buying and selling pressure. It helps identify overbought and oversold conditions and potential trend reversals.
Directional Movement Index (DMI):
Signal Length: The number of periods used for smoothing the ADX line.
Length: The number of periods used for calculating DMI.
Benefit: DMI consists of three lines: ADX, +DI (Plus Directional Indicator), and -DI (Minus Directional Indicator). ADX measures the strength of a trend, while +DI and -DI indicate the direction of the trend. DMI helps identify trend strength, trend direction, and potential trend reversals.
Stochastic Oscillator:
SmoothK: The number of periods used for smoothing %K line.
SmoothD: The number of periods used for smoothing %D line.
Length RSI: The number of periods used for calculating RSI within Stochastic.
Length Stoch: The number of periods used for calculating Stochastic.
Benefit: Stochastic Oscillator is a momentum indicator that compares the closing price of an asset to its price range over a specific period. It helps identify overbought and oversold conditions and potential trend reversals.
Moving Averages (MA):
MA50: Simple Moving Average with a length of 50 periods.
MA200: Simple Moving Average with a length of 200 periods.
Benefit: Moving averages are commonly used to
Advantages of the script compared to common indicators:
Comprehensive analysis: The script combines several indicators such as MACD, RSI, MFI, DMI, Stochastic Oscillator and Moving Averages. It thus provides a broader and more comprehensive view of the market and its development.
Synergy of indicators: Using multiple indicators increases the reliability and confirmation of signals. Combining different indicators can provide potentially stronger and more accurate signals of a trend change.
Identifying Oversold and Overbought Levels: RSI, MFI and Stochastic Oscillator are used to identify oversold and overbought levels in the market. This can help uncover opportunities to buy or sell in line with these levels.
Identifying trends and their strength: DMI and Moving Averages help identify trends in the market and provide information about their strength. This can help traders in deciding the appropriate time to enter and exit the market.
Early signal generation: The script generates signals based on a combination of various indicators, which can help traders identify potential trading opportunities at an early stage.
The main thing for me is that it helps me from overtrading, I only trade when I get an alert or see it on the chart. I recommend
I find it best to trade in the 1h and 2h time frame. The shorter ones like 15min and 30min are perfect for me to get out of the position.
It is important to note that no indicator guarantees 100% accuracy in generating signals and trading on financial

LeafAlgo ProThis indicator utilizes signals generated from a normalized consensus of one of the four following consensus strategies: Oscillator Consensus, Moving Average Consensus, Democratic Fib Consensus, and an Ichimoku Cloud Consensus. When the values of the individual consensus are normalized, they can be utilized as an oscillator with a range of 0-100. The range of 0-100 can be broken down into zones where if the oscillator breaks through the different thresholds and meets the directional filter requirements, a signal is generated for strong buy, buy, sell, and strong sell with respect to which underlying threshold is breached.
Oscillator:
The Oscillator setting consists of the Average Directional Index (ADX) set as a value instead of +/- and is not used in the scoring to gather consensus. Rather, a value of 25 or above is used to confirm the trend regardless of positive or negative. The Chande Momentum Oscillator (CMO), Detrended Price Oscillator (DPO), Momentum, Rate of Change (ROC), Relative Strength Index (RSI), True Strength Index (TSI), and Volume Oscillator are used in the Oscillator table for a consensus value and given a + or - depending on the condition being met. The conditions and weighting are as follows:
-- CMO > or < 0, given a weight of +/- 2
-- DPO > or < 0, given a weight of +/- 2
-- Momentum > or < 0, given a weight of +/- 2
-- ROC > or < 0, given a weight of +/- 2
-- RSI > or < 50, given a weight of +/- 1
-- TSI Value Line > or < 0, given a weight of +/- 1
-- TSI Signal Line > or < 0, given a weight of +/- 1
-- Volume Osc. > or < 0, given a weight of +/- 2
Moving Average:
For the Moving Average Ribbon/Multi-MA setting the user is able to determine the type of MA for 11 moving averages. The type selection consists of EMA, DEMA, TEMA, SMA, RMA, VWMA, WMA, SMMA, and a Hull MA. The preset values for the 11 moving averages are 5, 7, 10, 14, 21, 26, 50, 75, 100, 150, and 200. The consensus conditions and weighting are as follows:
-- If MA(1 through 10) < or > the price source, given a weight of +/- 1
-- If MA(11) < or > the price source, given a weight of +/- 2
DFMA:
The Democratic Fibonacci Moving Average setting is derived from our indicator of the same name. The source for the DFMA can be chosen by the user, but the SMA lengths are predetermined in Fibonacci intervals from 3 to 233. The DFMA line itself is determined by finding the average value of these 10 Fibonacci MA lengths. The consensus conditions and weighting are as follows:
-- If Fib. MA (3-233) < or > the source, given a weight of +/- 1
-- If DFMA value < or > the source, given a weight of +/- 2.
Ichimoku:
The Ichimoku setting values a handful of conditions using the Tenkan-sen/Conversion Line, Kijun-sen/Base Line, Senkou-span A and B, and the Chikou-span, each of which are given their standard values of 9, 26, 52, and 26, respectively, but can be changed in the user settings if desired. As opposed to the other tables, there are fewer conditions to be met and given values to. All of the conditions are given the same weighting (+/- 1). The conditions are as follows:
-- Kijun-sen < or > the source
-- Tenkan-sen < or > the source
-- Kijun-sen > or < the Chikou-span
-- Tenkan-sen > or < the Kijou-sen
-- Senkou Span A > or < Senkou Span B
Dynamic Bar Coloring
The bar coloring is based on the values of the underlying consensus oscillator.
-- If the consensus value >= 75 coloring= "Lime"
-- If the consensus value is between 55 and 70, coloring= "Green"
-- If the consensus value is between 45 and 55, coloring= "Yellow"
-- If the consensus value is between 30 and 45, coloring= "Orange"
-- If consensus value is <= 30, coloring= "Red"
Regression Channels
The visible channel utilizes a basis line of a quadratic regression line. The quadratic regression is well suited for determining (and predicting) trends. Calculating the regression involves five summation equations that utilize the bar index (x1), the price source (defaulted to ohlc4), the desired length, and the square of x1. Determining the coefficient values requires an additional step that factors in the simple moving average of the source, bar index, and squared bar index. The envelopes that are formed around the regression line are a multiple of that regression line using the high/low range of the price. This envelope can be used to determine points of interest where the price may break through, consolidate at, or reverse from. The channels should be used in conjunction with the signals generated to determine if the signal is valid.
Note past performance is not indicative of future results. This is meant to be used as a tool, and the signals generated by this script should be confirmed with other technical analysis.

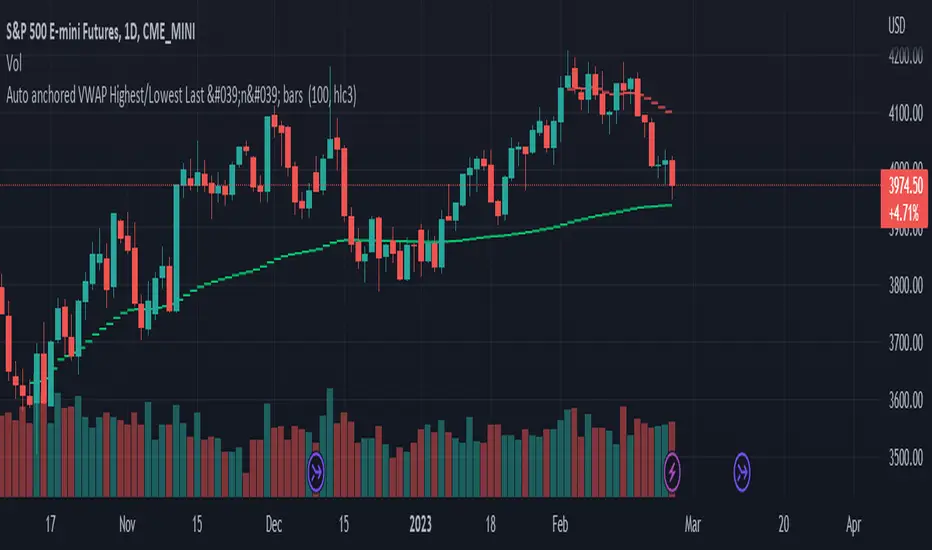
Auto anchored VWAP Highest/Lowest Last 'n' bars The VWAP (Volume Weighted Average Price) indicator is used to calculate the average price weighted by volume. This indicator is designed to automatically draw VWAPs from the highest and lowest points of the last 'n' bars.
It utilizes arrays to calculate the values of VWAP and plot it on the chart on the last historical bar. This version was coded to get a similar version to the official "VWAP Auto anchored" with the highest/lowest selected settings.
To use VWAP, traders can look for price movements relative to the VWAP line to identify potential support or resistance levels. It can also be used in conjunction with other technical indicators to develop trading strategies.
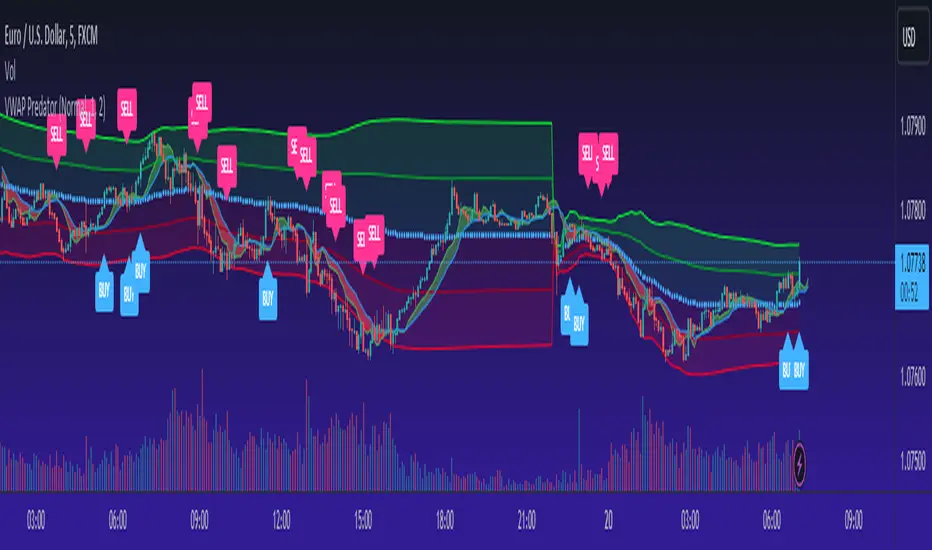
VWAP PredatorUsing VWAP as a start point, the VWAP Predator uses proprietary Fibonacci bands to help determine signal criteria. Most traders use VWAP in a simple way to determine whether an instrument is in a bearish or bullish state, but that doesn't help choosing the correct time to go long or short.
The xBat VWAP Predator uses behavioural analysis with volume, price action with open and close proximities to the Fibonacci bands/zones (Fib Zones). The following describes how the xBrat VWAP Predator is different to any standard use of Volume Weighted Average Price and uses xBrat Proprietary Behavioural logic to determine high probability long and Short signals. All of this heavy lifting and logic is done behind the scenes, keeping traders charts clean.
Long Trading Signals - Candle Coloured in Blue - There are many states with the logic to produce these signals, which are briefly described below:
1. The only standard criteria here - The price action must be above the VWAP Line
2. The Price must open below the boundary of one Fib Zone and close into the next Fib Zone
3. That Same Candle has to be an Accumulation Candle (more volume than the preceding candle and More Buyers) - This is determined with our proprietary logic coding
4. The Same signal candle also has to be higher than average volume. Again, our proprietary xBrat Logic just doesn't look back over a set number of bars, it looks at times of day and day of week, plus more to determine a true valuation of higher, lower or equal to average volume.
5. Only when these states are met, plus two more ema proximity logic, Does the xBrat VWAP predator give a Long Signal.
6. Trade Management is either set targets or indeed a simple ema cross which we provide as a ribbon on the chart to help traders. These ema's are different to entry logic. When the Ribbon turns from green to red, the trader should consider exiting the trade
Short Trading Signals - Candle Coloured in Pink - There are many states with the logic to produce these signals, which are briefly described below:
1. The only standard criteria here - The price action must be below the VWAP Line
2. The Price must open above the boundary of one Fib Zone and close into the next Fib Zone
3. That Same Candle has to be a Distribution Candle (more volume than the preceding candle and More Sellers) - This is determined with our proprietary logic coding
4. The Same signal candle also has to be higher than average volume. Again, our proprietary xBrat Logic just doesn't look back over a set number of bars, it looks at times of day and day of week, plus more to determine a true valuation of higher, lower or equal to average volume.
5. Only when these states are met, plus two more ema proximity logic, Does the xBrat VWAP predator give a Short Signal.
6. Trade Management is either set targets or indeed a simple ema cross which we provide as a ribbon on the chart to help traders. These ema's are different to entry logic. When the Ribbon turns from red to green, the trader should consider exiting the trade.
VWAP Predator is a day trading and scalping signals trading indicator.
Rob Booker Reversal Tabs StrategyRob Booker Reversal Tabs Strategy is an updated version of Rob Bookers Reversal Tab study: Rob Booker Reversal Tabs
While the original is a Pinescript study, this version can be switched between strategy and indicator mode.
Rob Bookers script generates reversal signal based on MACD and Stochastics, it is not a true reversal system, default pyramiding value is set to 5.
Inputs determine MACD and Stochastics settings. The only additional input is the "Strategy Mode" checkbox.
This script works well on its own for some tickers, but like any reversal pattern generating scripts, traders will profit from looking at overall price action and trend strength before making a trade.
From the original:
A simple reversal pattern indicator that uses MACD and Stochastics.
Created by Rob Booker and programmed by Andrew Palladino.
Please note that I only updated the original to V5 and edited it to be a strategy, which was a grand total of 5 minutes of work. I updated it because I wanted to see how the script performs as a strategy and I'm publishing it in case others would like to use it. I take no credit whatsoever for the original and WILL take this version down if Rob Booker or his Team ask me to or decide to release their own strategy version of the original.
Check out Rob Bookers scripts and ideas on his Tradingview account: robbooker

Forex Midpoint Stratejisi For Nasdaq English Knowledge:
Midpoint Strategy;
The general calculation method is a strategy that helps determine direction by the intersection of a MA line and the value obtained by dividing the lowest and highest price in the specified length range.
Başlangıç Periyodu: The data length of the Midpoint Line.
Kaydırma Seviyesi: The number of steps forward or backward of the Midpoint Line.
Yüzde Seviyesi: the amount of vertical scrolling.
Uzunluk: The length of the MA line
represents.
This strategy is prepared for the Nasdaq 5-minute period. It needs to be optimized for use on other instruments.
There are take profit and stop loss levels within the codes. Friends who want to use it can remove the invisibility from the relevant sections. Also, I removed the midpoint and the MA line so that it does not crowd the image, you can add it if you want.
Thank you.
Turkish Knowledge:
Midpoint Stratejisi;
Genel hesaplama yöntemi, belirlenen uzunluk aralığındaki en düşük ve en yüksek fiyatın ikiye bölümü ile elde edilen değer ve bir ortalama çizgisinin kesişimleriyle yön belirlemeye yardımcı bir stratejidir.
Başlangıç Period: Midpoint Çizgisinin veri uzunluğunu.
Kaydırma Seviyesi: Midpoint Çizgisinin ileri veya geri adım sayısını.
Yüzde Seviyesi: dikey kaydırma miktarını.
Uzunluk: Ortalama çizgisinin uzunluğunu
temsil etmektedir.
Bu strateji Nasdaq 5 dakikalık periot için hazırlanmıştır. Diğer enstrümanlarda kullanılması için optimize edilmesi gerekir.
Kodların içinde Kar alma , zarar durdurma seviyeleri mevcuttur. Kullanmak isteyen arkadaşlar ilgili bölümlerden görünmezliği kaldırabilirler. ayrıca midpoint ve ortalama çizgisinide görüntü kalabalığı yapmaması için ben kaldırdım isterseniz siz ekleyebilirsiniz.
Teşekkürler.
