[AKM] Daily Opening Gap IndicatorThis indicator will mark yesterday daily closing price with today daily opening price.
Do not use this indicator with timeframe higher than Daily timeframe.
Gap up will be indicate with green color.
Gap down will be indicate with red color.
Send us private message on TV to gain access to the indicator.
Gaps

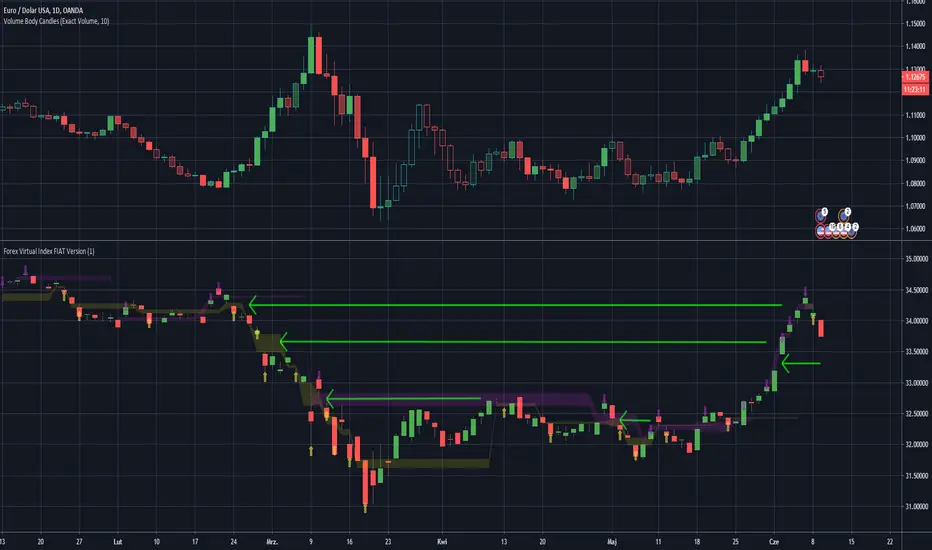
Forex Virtual Index FIAT VersionThis is virtually created FX Fiat pairs index based on OANDAs data.
Pairs are: EUR/USD , AUD/USD , GBP/USD , NZD/USD , AUD/JPY , EUR/JPY , GBP/JPY , USD/JPY , USD/CAD , USD/PLN
Be awared that some pairs like USD/CAD , have reversed correlation to the index.
You may look at the gaps as on standard S/R levels.
ps. Take look inside the scirpt's settings.
ps2. This script is invite-only for the members of our trading group (info in signature, group is free of charge).
Trend Following IndicatorTrend Following Indicator is for following trend and being in trend till trend is not changed.
Each Bullish and Bearish signal you can add one more future or option lot and be in trade till bearish signal is not coming.
You can close Long trade i.e. Bullish pyramiding trade when you see there is small red arrows are there
and similarly when you are in Short trade you can pyramid with each Bearish signal and you can close the trade when small green arrow start coming.
Pros: This signal system is working in stocks and Index and Commodity and Currency.
Cons: Choppy market results are not good on that time you have to believe on small arrows for signals.
This signal is available on subscription. contact me or ping me for more details.

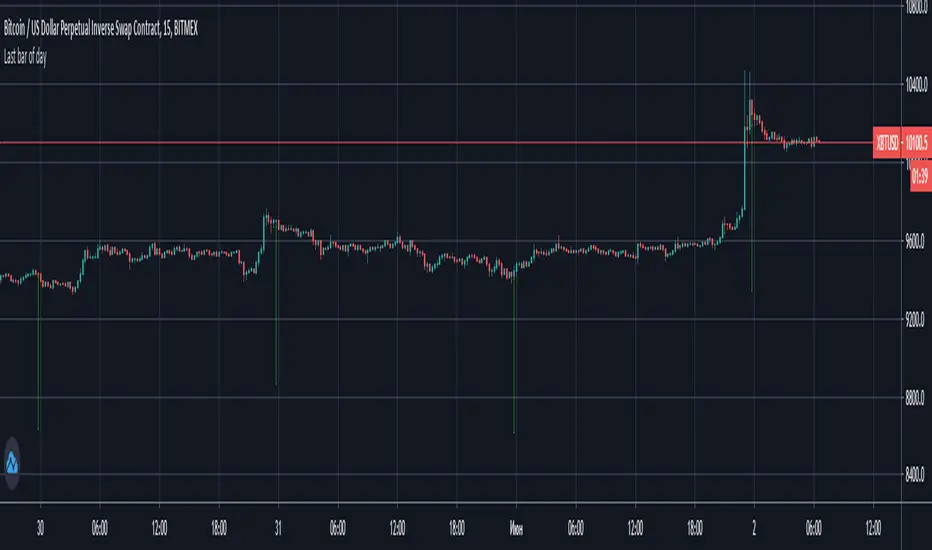
How to detect last bar of day Simple way how to detect last bar of day and close all positions
UPD: day end can be different for yours because stocks market use another timezone
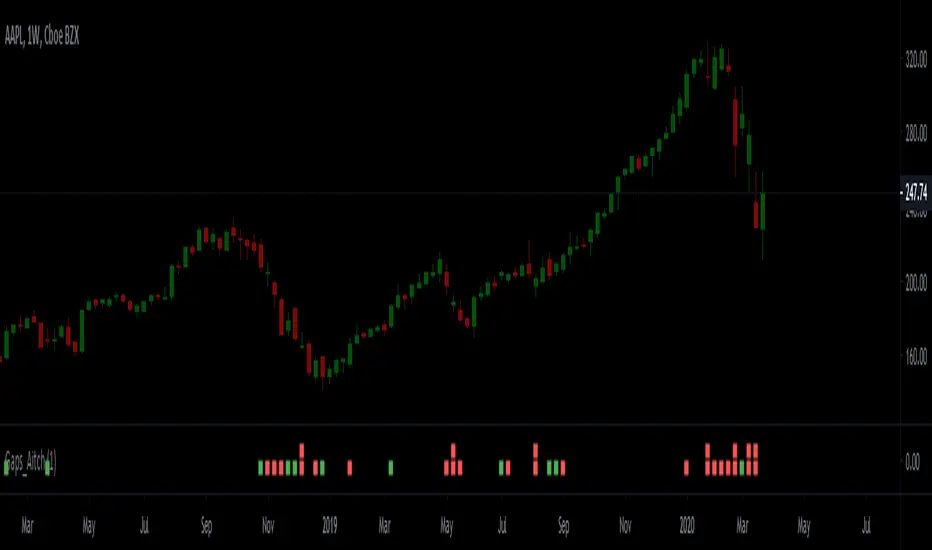
Gap Finder - Aitch-TGap finder finds the following types of gaps:
- Full Gap Up (open price is higher than the previous day's high)
- Partial Gap Up (open price is higher than the previous day's close)
- Full Gap Down (open price is lower than the previous day's low)
- Partial Gap Down (open price is lower that the previous day's close)
The script is fully customizable and can be applied to Forex, futures, stocks and crypto.
How to use it:
Once you have added the script to your chart, go to the script's settings and type in the size of the gap, then move to the style tab and check the types of gaps that you want the script to find. If you wish, you can also edit the rest of the settings to your liking.
Hit the Ok button when your done.
Green and red squares will appear on top and bottom of the indicator pointing out the location of the sharp move.
By default, full gap signals appear on top of the indicator while partial gap signals appear on the bottom of the indicator.
Defaul gap size is 1%.
My VWAP Reversal + Pivot Points StandardThis indicator, with the addition of a standard VWAP indicator to the 5m chart, helps the operator when using a closing candle Price to initiate a VWAP Reversal strategy.
The strategy involves Price gapping up, look for a Close below the 1st 5m candle Low; else look for a Close above the 1st 5m candle High. On a break of VWAP, take the trade in the opposite direction of the gap, hence the VWAP Reversal. Not my own strat, credit to T3 Newsbeat, publicly posted on YouTube.
The Pivot Points Standard in the Pine 4 user manual, was the base source code, and leaving it here will allow me to remove the PP indicator I was using.

GAPS CheckerUsing this indicator allows you to indentify large GAPS directly in your stock chart at first glance.
It uses two different sorts for large GAPS (e.g. larger than 3%) and for very large GAPS (e.g. larger than 6%). These values can be changed in the indicator settings.
Hope this helps many of you to be more efficient in your chart analysis - have fun!

ATS Masters Indicator #3This master indicator is a collection of multiple useful indicators, which only requires one indicator slot in TradingView.
In this collection you will find the following 4 special indicators:
Gaps Checker
Large Candles Checker
SPY Checker Lite
Volume Checker Pro
So, using this master indicator you are able to use up to 4 special indicators in one.
If you would like to test this master indicator drop me a line and send a request for it.

GAPS Checker v2 PROUsing this indicator allows you to indentify large GAPS directly in your stock chart at first glance. The algorithm of the indicator *Gaps Checker v2* was optimized in this new indicator as well as it using the new pine script version v4. For backwards compatibility reasons this indicator is published.
This indicator is available in two versions ‘Lite’ and ‘PRO’. The difference is the calculated precision and the percent inputs in integer numbers or more granular in float values.
It uses two different sorts for large GAPS (yellow, e.g. larger than 2%) and for very large GAPS (red, e.g. larger than 4%). These values can be changed in the indicator settings.
Hope this helps many of you to be more efficient in your chart analysis - have fun!

GAPS Checker v2 LiteUsing this indicator allows you to indentify large GAPS directly in your stock chart at first glance. The algorithm of the indicator *Gaps Checker v2* was optimized in this new indicator as well as it using the new pine script version v4. For backwards compatibility reasons this indicator is published.
This indicator is available in two versions ‘Lite’ and ‘PRO’. The difference is the calculated precision and the percent inputs in integer numbers or more granular in float values.
It uses two different sorts for large GAPS (yellow, e.g. larger than 2%) and for very large GAPS (red, e.g. larger than 4%). These values can be changed in the indicator settings.
Hope this helps many of you to be more efficient in your chart analysis - have fun!

GapGap
I've seen many trade decisions based on the CME Bitcoin Futures gap, so this indicator will let you know if that strategy is good or not, so use it as another confirmation 👍🏻.
- Shows when a gap is created, when it is filled and if not filled if a new gap is created.
- You can also use another security as a reference.
- Multi Timeframe , by default it will search the daily gaps.

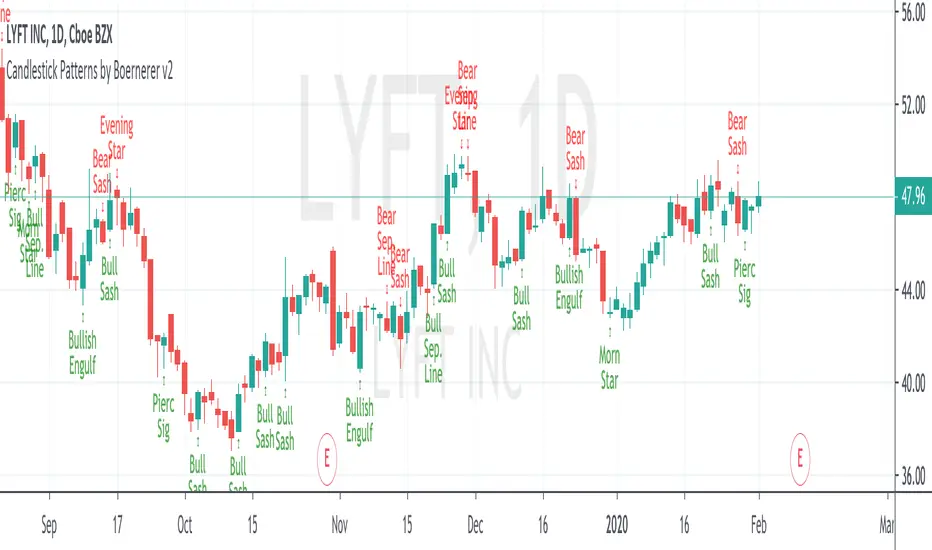
Candlestick Patterns by Boernerer v2New version 2 of my modifications of the original candlestick pattern script by Robert Waddell.
- Added window (= gaps) detection
- Added Bear/Bull Sash
- Added Bear/Bull Counter Attack
- Added Bear/Bull Seperating Line
- Modified candlestick ID code
- Added Lookback period instead of SMA (TLine) for trend detection
Candlestick Patterns + windows Mod by BoernererMy modifications for the candlestick pattern script by Robert Waddell.
Changelog
- Added window (= gaps) detection
- Added Bear/Bull Sash
- Modified candlestick ID code
- Candlesticks will only be displayed if above or below TLine
Originally created by Robert Waddell with special thanks to repo32 for his candlestick ID code, DavidR for EMA code and Chris Moody for barcolor code.
Enjoy and would love if you improve it further!

Find GapsShow a symbol or/and create an alert if there is a gap between candles. Percentage of gaps can be adjusted.

[AN] GapierA colored gap finder.
It colors a gap until it gets closed. It displays an info for the current opened gaps (range).
Allows to change the gap timeframe
Allows you to overlay gaps of other symbol on the current one
There are some assets that really like to fill the gaps. Using this indicator you can have a better understanding on where the price is heading (on the current trend).

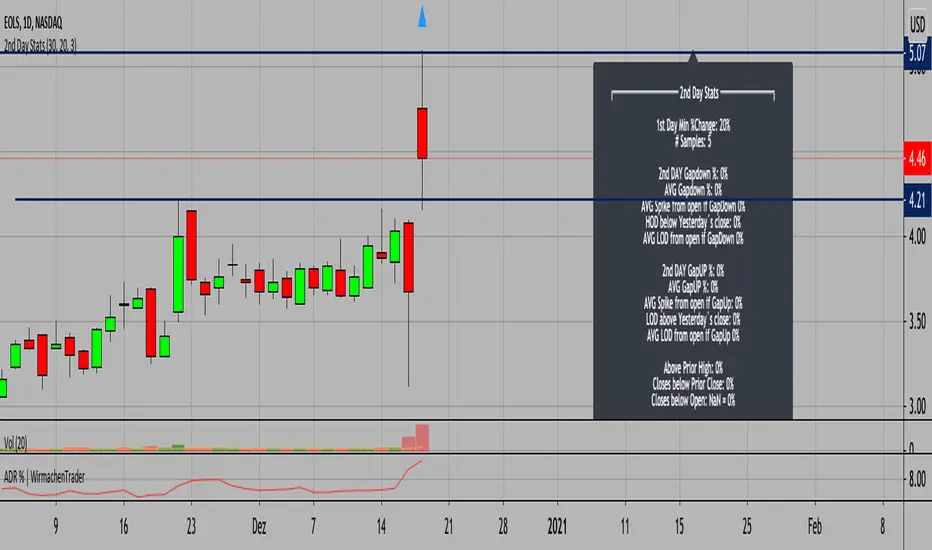
2nd Day Stats / BACKTESTING TOOL//English version below
## Deutsche Version
Was passiert am 2. Tag, nachdem wir X % am ersten Tag zurückgelegt haben? Genau dies lässt sich sehr gut backtesten und die Erkenntnisse im Markt anwenden. Dieses Tool eignet sich besonders für kleinere Aktien (Small-Caps) oder Aktien, die am Tag der Quartalszahlen große Bewegungen zurückgelegt haben. Backtesting war selten so einfach.
## English version
What happens after a strong day 1 move? Use the custom input to test, what happened after a 10% move on day one. Change the day 1 move % and the number of years to backtest. It's that simple. The tool is especially helpful for small-cap traders and for stocks after earnings.
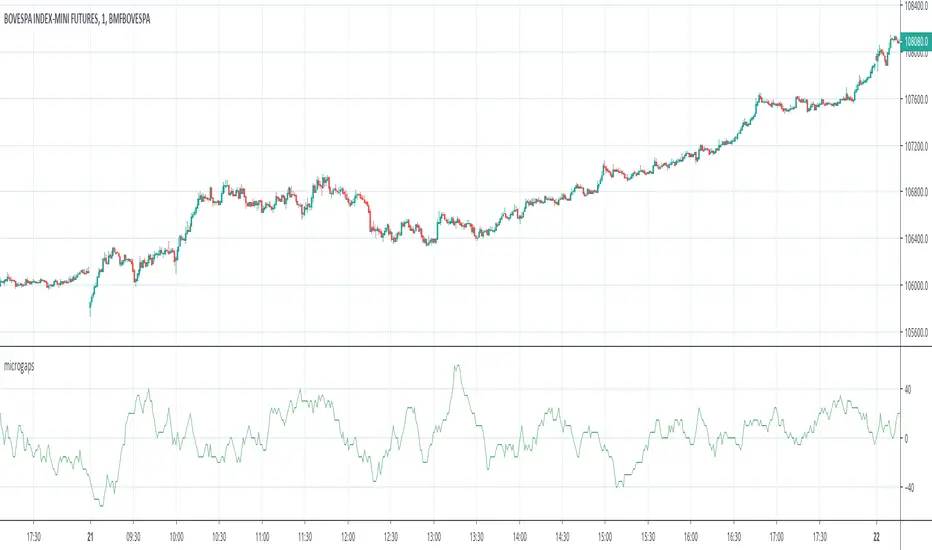
Gap Trader
Plot the most recent 20 gaps based on custom session info.
The session can be customized with a start time and an end time.
The previous open, high, low, close are only from the price during the session specified.
A gap line will stop printing the moment the gap is filled.
For CME futures, the session must be offset by one hour for Central time. I use the official cash close of 16:15 EST (yes, not 16:00) as this is the TRUE close when options go offline. Every day CME futures take a break between 16:15 - 16:30 EST for settlement, and then again from 17:00 - 18:00 EST.
To offset CME futures you must subtract an hour, the official NYSE hours for futures: 0830-1515, this translates to 9:30 AM EST - 4:15 PM EST.
For information about the probability of a previous day's gap being filled by the NYSE close: www.investiquant.com

ATS Master's IndicatorThis master indicator is a collection of multiple useful indicators, which only requires one indicator slot in TradingView.
In this collection you will find the following 15 indicators:
Bollinger Bands (three different types: Fibonacci, Standard, Improved)
Gaps Checker
Large Candles Checker
SPY Checker Lite
Volume Checker Pro
Moving Averages (up to two individual MA indicators)
Exponential Moving Averages (up to two individual EMA indicators)
Double Exponential Moving Averages (up to two individual DEMA indicators)
Tripple Exponential Moving Averages (up to two individual TEMA indicators)
So, using this master indicator you are able to use up to 15 indicators in one.
If you would like to use this master indicator drop me a line and send a request for it.

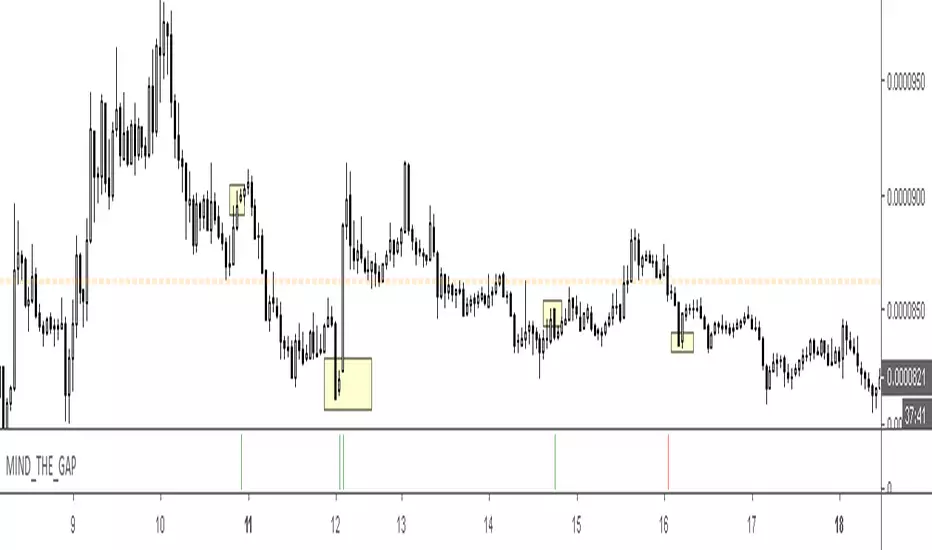
MIND_THE_GAP: Locate gaps on all time frames. Alerts enabled. • Identify gaps on all time frames
• Ability to set gap sensitivity
• Daily gaps overlaid on intra-day time frames
• Horizontal bars indicate gap on the current time frame
• Circles indicate gap on the daily time frame
• Alerts enabled
Gap-O-MaticGap-O-Matic checks whether there is a gap in a user-defined security or symbol and gives you alerts, targets for the gap and tracks the gap until it has been filled. In addition, you can disable or show plots, and change the gap threshhold to pick how big of gaps you want Gap-O-Matic to alert you to and which it should ignore.
A good use case, for example, is to use Gap-O-Matic to monitor a CME/CBOE such as "BTC1!" while trading a bitmex chart. You wont need to check or chart out gap areas. Gap-O-Matic will automatically draw in the gaps on your chart for you.

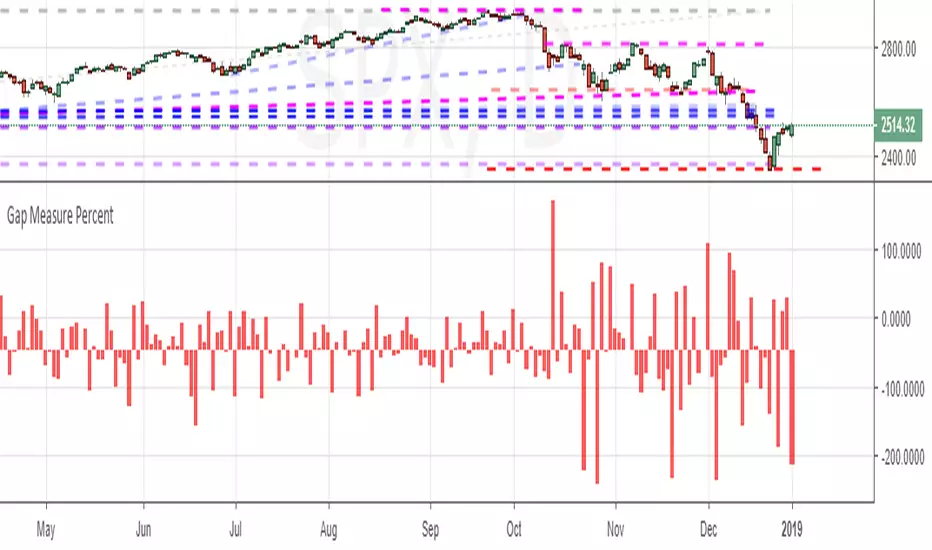
Gap Measure PercentMeasures the gaps between bars - bullish or bearish - as a percent of the underlying's price.
My Simple Gaps with overlay (Bar and Candlestick Charts)updated screenshot with some narrative
this is a bar and candlestick chart gap identification tool
