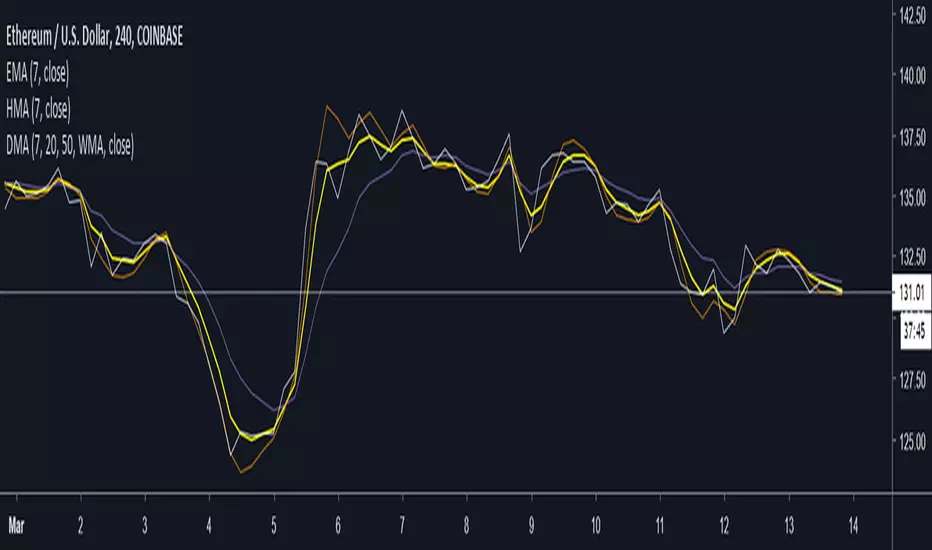
Dickinson Moving Average (DMA)Implementation of the "Dickinson Moving Average" from the r/algotrading post by Nathan Dickinson
Quoted from the author of the Dickinson Moving Average:
"I was experimenting with the “zero lag” code from John Ehlers and the Hull Moving Average and noticed that they seemed to respond in complementary ways when properly set up. With the right starting values, they blend together to make a moving average which responds with one (or maybe even half a bar) of lag. To my eye, it looks to be almost as good as the Jurik Moving Average."
Optional parameter input available to use Exponential Hull Moving Average (EHMA) instead of WMA for the Hull MA is available.
Acknowledgements/Credits:
Nathan Dickinson, Dickinson Moving Average
@RicardoSantos, Function for Hull Moving Average
Exponential Hull Moving Average sourced from:
// Raudys, Aistis & Lenčiauskas, Vaidotas & Malčius, Edmundas. (2013). Moving Averages for Financial Data Smoothing.
// Communications in Computer and Information Science. 403. 34-45. 10.1007/978-3-642-41947-8_4.
@Everget, Jurik Moving Average
Hull
Exponential Hull Moving Average (EHMA)Source for Exponential Hull Moving Average (EHMA) formula:
Raudys, Aistis & Lenčiauskas, Vaidotas & Malčius, Edmundas. (2013). Moving Averages for Financial Data Smoothing. Communications in Computer and Information Science. 403. 34-45. 10.1007/978-3-642-41947-8_4.
The Exponential Hull Moving Average is nearly identical to the Hull MA, but EMA used instead of WMA.
Credit to @RicardoSantos for the existing implementation of the Hull Moving Average in pinescript:

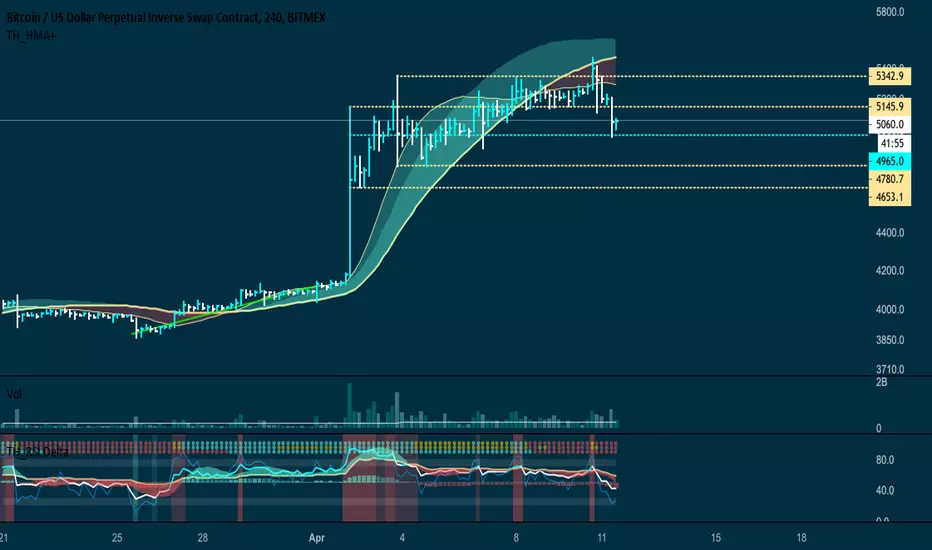
TH_HMA+ HistogramHistogram version of HMA+. This Centered Oscillator show more accurately when trends are reversing thanks to the U-shape reversals and clouds switching Red/Green. Fast MA getting above/under the base implies a establish Bullish/Bearish bias.
There is a flagging circles that will be visible depending how price is under or above the Fast MA which can also provide early indication of trend direction.

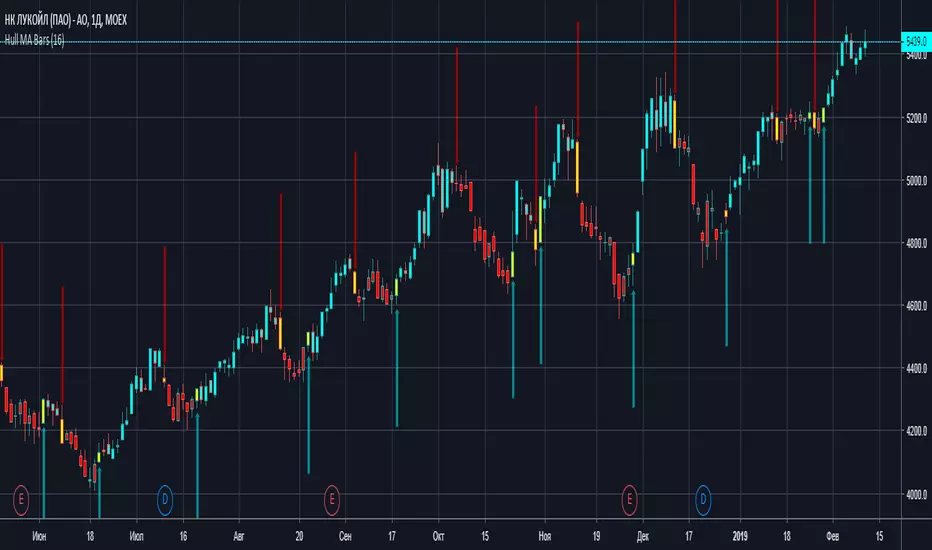
Hull MA BarsThis indicator fill bars with color of HullMA + warning yellow bars, then trend reversing
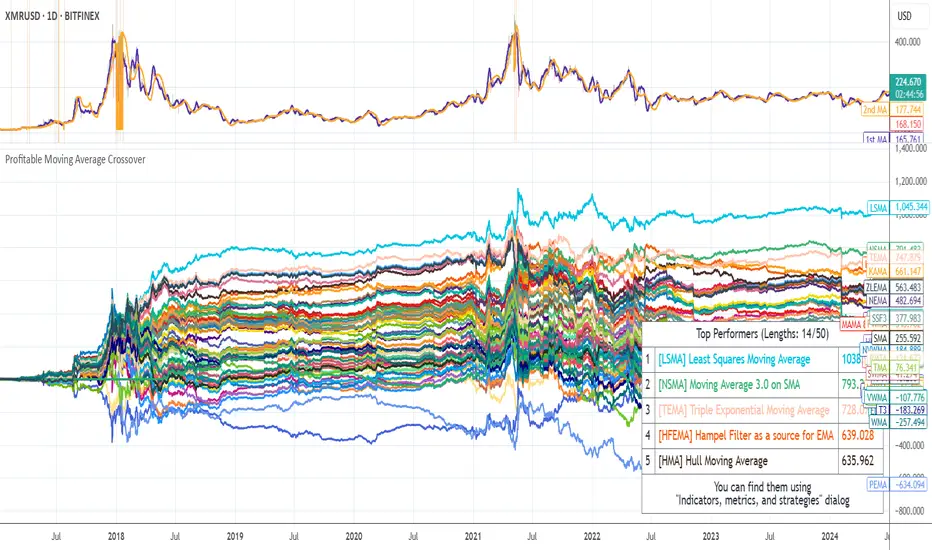
Profitable Moving Average CrossoverHello friends,
I'm glad to introduce a powerful research and optimization tool that takes the classic moving average crossover concept to a new level. Instead of relying on guesswork or fixed MA types, it lets you objectively discover the most profitable moving average pair for any instrument and timeframe.
🛠 How It Works
Moving average crossovers are among the most popular trading systems. A buy signal occurs when a shorter (faster) moving average crosses above a longer (slower) one, and a sell signal when it crosses below. The system's responsiveness — and the number of generated signals — depend on the chosen MA lengths and types.
This script evaluates 61 moving average types (including Jurik, Kaufman, Ehlers, Apirine, and others) and backtests all possible crossover combinations either across the entire chart history or within a custom backtest window . It then plots continuous profit metric lines for each crossover type and displays the top 5 performers in a results table. Each MA type is color-coded, allowing quick visual identification of which systems have historically delivered the strongest results.
🔥 Key Features
Pine Script V6 — optimized for performance and stability
Tests 61 moving average types , from classic to adaptive designs
Custom Backtest Window — analyze the entire history or a specific date range
Continuous profit curves for every crossover type plotted on chart
Top 5 crossover systems displayed in a compact summary table
Color-coded MA identifiers for fast visual comparison
Supports custom parameters for advanced MAs (JMA, ALMA, McGinley Dynamic, Adaptive Laguerre Filter, etc.)
Works seamlessly across all assets and timeframes
NOTE: Results will vary across different tickers and timeframes. Seeing strong performance in one preview does not imply similar profitability elsewhere — this variability is normal due to differing market structures.
NOTE 2: You can experiment with the tool independently or request a full study, in which case I'll share a spreadsheet of all backtest results with you.
👋 Good luck and happy trading!
Платный скрипт
HullMA Strategy--HULL 20 Hisse senedinin hull moving average gibi hızlı bir hareketli ortalamada 20 li paremetrege performansını göstermektedir. Kodu trdingwiewswn alınmıştır.

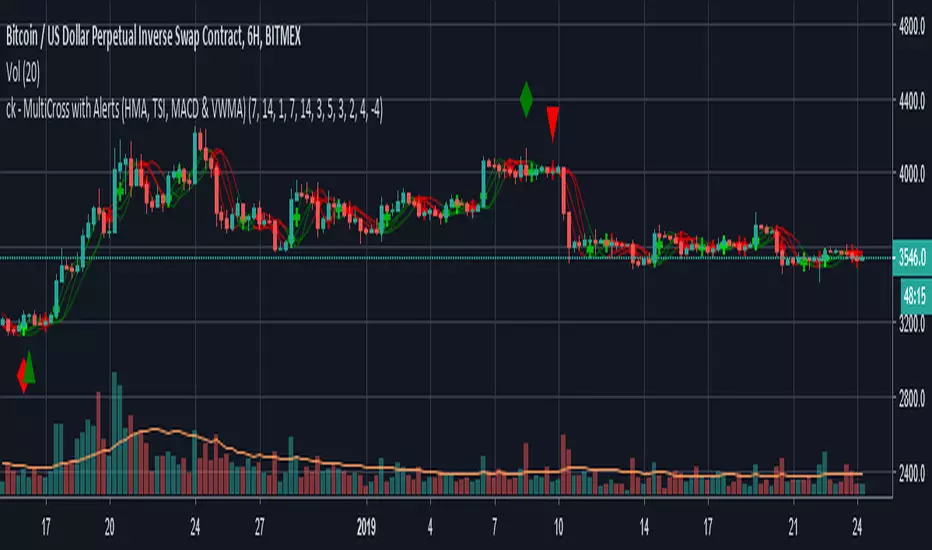
ck - MultiCross with Alerts (HMA, TSI, MACD & VWMA)Hello again everyone!
I hope you enjoy this "Multicross" Indicator.
Feature packed indicator with Alerts, that includes:
Double Hull MAs (fast and slow)
TSI (fast, slow, Long trigger & Short triggers definable)
VWMA
MACD (fast and slow)
Visual output plots line crosses from the indicators and provides visual Long and Short triangles and Alerts for bot users!
Enjoy!
Special thanks to Magnus Söderberg for the idea behind this.
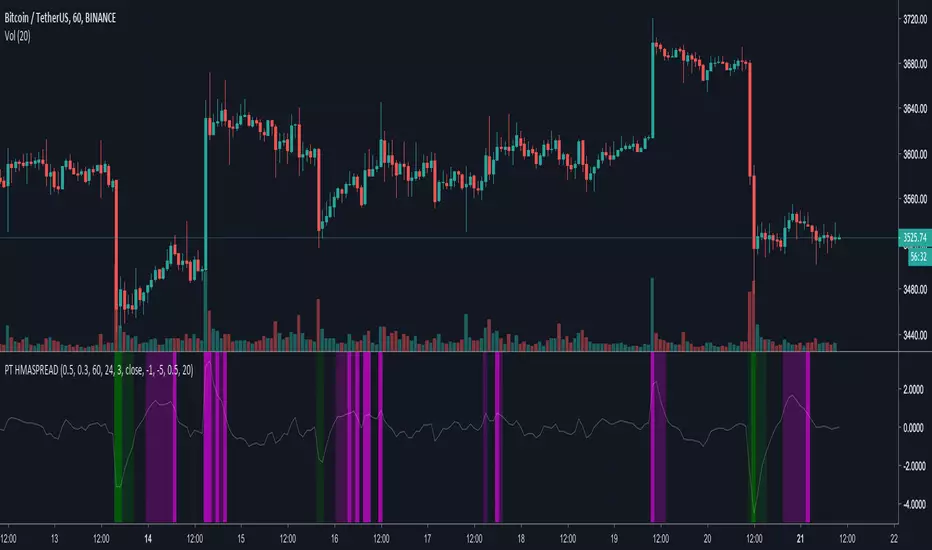
[ProfitTrailer] HMASPREAD Buy/Sell studyProfitTrailer buy/sell study for HMASPREAD strategy.
The script highlights the region where trailing is most likely to succeed.
Hull cloudIntroducing a new indicator - Hull cloud. It bears some resemblance to the Ichimoku cloud , but is basically built with the Hull moving average , using a Fibonacci sequence with the usual seed of 0,1 for the lengths and offset (55, 89, 144, 233, 377, 610). These settings can be changed by the user.
1. Simple Hull MA - Hull MA with default of 89 periods.
2. Cloud positive line - Short period of 233 to make the positive line of the cloud.
3. Cloud negative line - Long period of 610 to make the negative line of the cloud.
By default, cloud is offset (forward) by 55 periods.
4. Lagging span - 144 period Hull MA with negative offset of 89 periods.
5. Forward span - 377 period Hull MA with positive offset of 144 periods.

Directional Indicator Strategy v1.2ADX Trading Strategy , using
ADX, D+ and D-
RSI
Historical Volatility
Hull Moving Averange for the price trend
Stop-loss
The Strategy Report is based on 10.000 USD initial investment without pyramiding, starting on januari the 1st 2018, on a 1D time frame. Taking in account a 0.2% Commission fee per trade.

[ALERTS] MA Cross ElevenThis script is a crossing of eleven different MA, with alerts and SL and TP.
The simplest is what works best.
SMA --> Simple
EMA --> Exponential
WMA --> Weighted
VWMA --> Volume Weighted
SMMA --> Smoothed
DEMA --> Double Exponential
TEMA --> Triple Exponential
HMA --> Hull
TMA --> Triangular
SSMA --> SuperSmoother filter
ZEMA --> Zero Lag Exponential
Using "once per bar close" repaint is 0%, but if you like risk can choose "once per bar", better profit.
Thanks to JustUncleL and his amazing sripts.

[STRATEGY] MA Cross ElevenThis script is a crossing of eleven different MA, with alerts and SL and TP.
The simplest is what works best...
SMA --> Simple
EMA --> Exponential
WMA --> Weighted
VWMA --> Volume Weighted
SMMA --> Smoothed
DEMA --> Double Exponential
TEMA --> Triple Exponential
HMA --> Hull
TMA --> Triangular
SSMA --> SuperSmoother filter
ZEMA --> Zero Lag Exponential
Using "once per bar close" repaint is 0%, but if you like risk can choose "once per bar", better profit.
Thanks to JustUncleL and his amazing sripts.
Enjoy!
www.tradingview.com
"Note: When using non-standard (Renko, Kagi, Line Break, Point and Figure, Heikin Ashi, Spread Charts) types of chart as a basis for strategy, you need to realize that the result will be different. The orders will be executed at the prices of this chart (e.g.for Heikin Ashi it’ll take Heikin Ashi prices (the average ones) not the real market prices). Therefore we highly recommend you to use standard chart type for strategies."


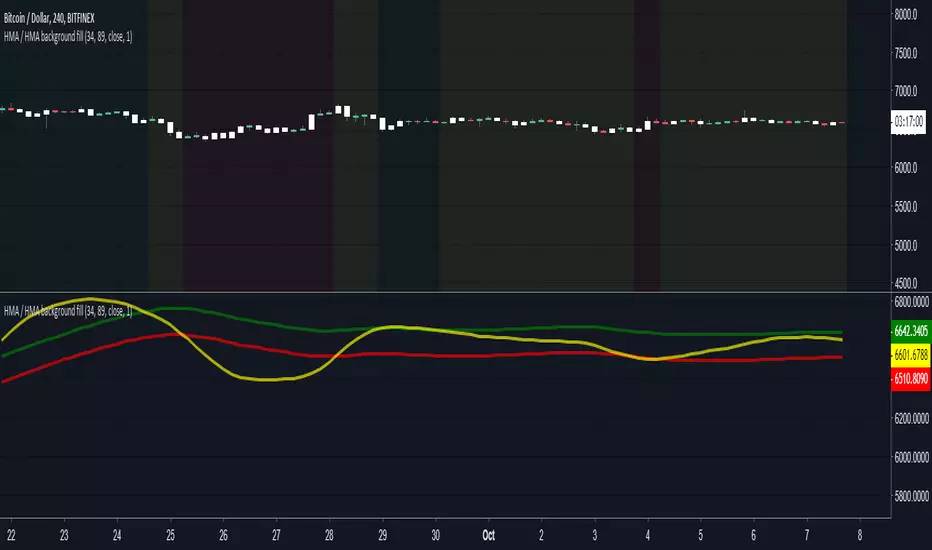
HMA + HMA + Dispersion background fill (ver 2.0)fast HMA • slow HMA • Dispersion Zone| background color's
---
Background colors: Red, Green and Yellow. Default transperent = 5%
• Green background: fast HMA above the dispersion zone
• Red background: fast HMA below the dispersion zone
• Yellow background: fast HMA inside the Dispersion Zone
---
# Alerts only for cross Yellow to Green and Yellow to Red zones.
---
• The dispersion zone is calculated relative to the slow HMA.
Fast - Slow HMA background fillfast HMA • slow HMA | background
---
Background colors: Red and Green. Default transperent = 2%
• Green background: "fastHMA" crossover "slowHMA"
• Red background: "fastHMA" crossdown "slowHMA"

3 HULLs & ICHIMOKU divided by PRICEBasically just another form of moving average, for quick swings, built for testing/use with API cryptobots, simple switch from buy to sell.
Hull MA(2 candles back) times 3 plus Ichimoku divided by price(1 candle back) = value1
Hull MA(3 candles back) times 3 plus Ichimoku divided by price(1 candle back) = value2
if value1>value2 then buy else sell
calculates price from 1 candle back, and calculates signal from 2nd and 3rd candle prices, so no repainting? so best on low timeframes.
for when use in bot, would not need 1 candle lag. Lag is for TV chartists to not have to suffer repainting.
Bots do not repaint. they are not "painting" anything, they simply open or close orders, which cannot be "repainted"
but here on TV chart, when you refresh the browser page, the script recalculates, and signals may be repainted.
hopefully this will not repaint. please test. thankyou

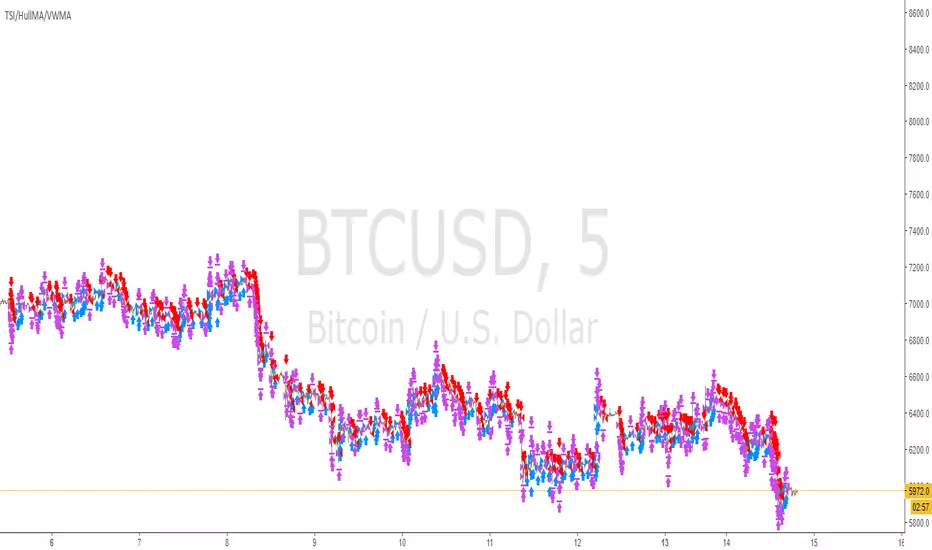
TSI/HullMA/VWMA strategychange the settings to make it profitable.. default settings not apply to any instrument in-particular.. dont be afraid to try different settings to find profitable combo of settings on your chosen crypto/FX/stock etc.. to avoid repaint wait for next candle before confirm signal..
[STUDY]HullMA OCC & SL/TP V3Another Open Close Cross. Now with Hull Moving Average: Alerts, SL TP, ...
Best results at 4h.
Enjoy!

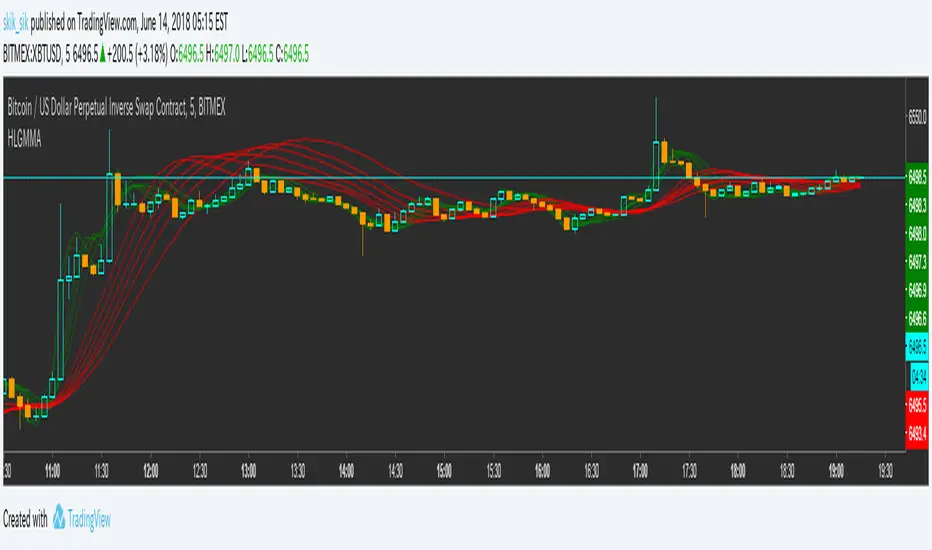
Hull Guppy Multiple Moving Average 名前のとおり
GMMAの説明は自分でお探しくだいさい
As the name implies
Please explain GMMA by yourself
Bollinger Bands %B + RSIBollinger Bands %b and RSI in one, and a experimental RSI cloud based in BB formula.
RSI scale goes from 0.00-1.00 instead of 0 -100.
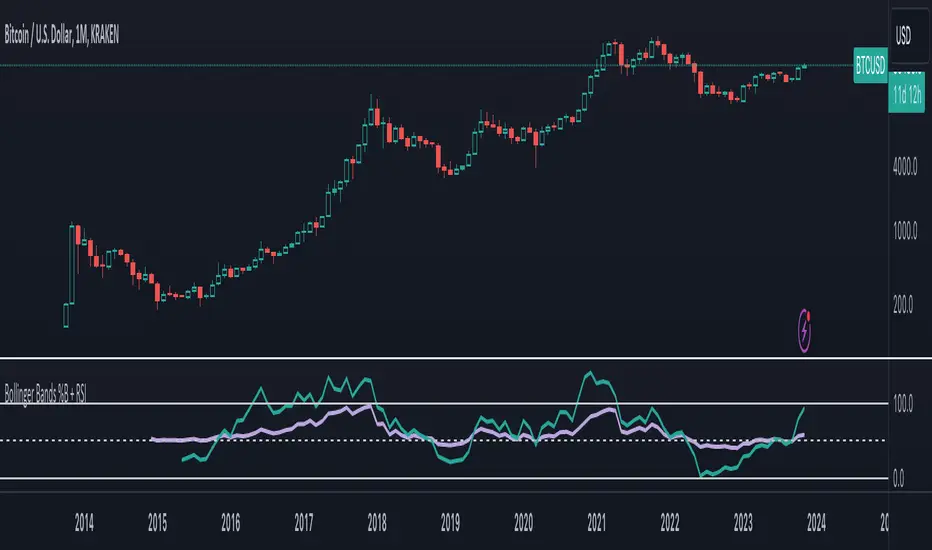
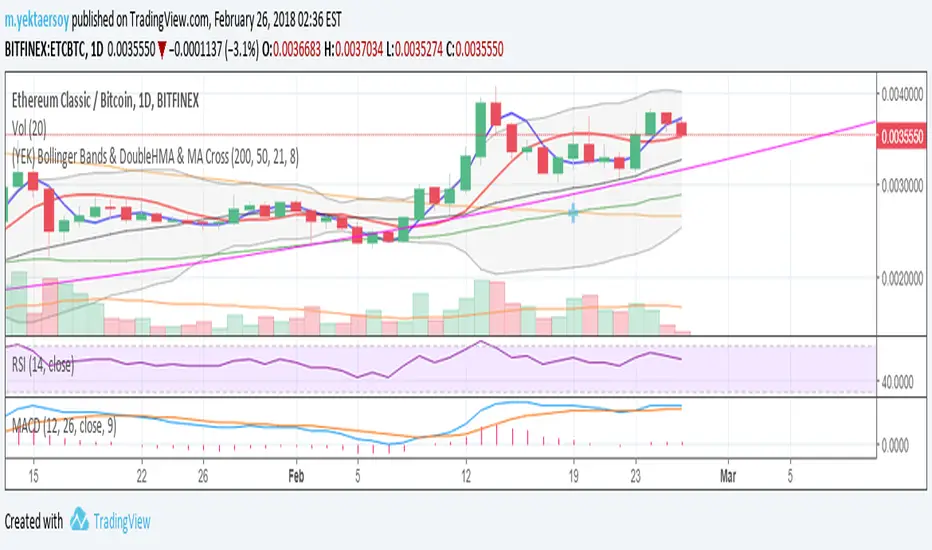
(YEK) Bollinger Bands & DoubleHMA & MA CrossMy favorite indicators ALL-IN-1: Bollinger Bands, Double Hull Moving Average (21,8), Double Moving Average (200,50)