IFVGs [NINE]Overview
The IFVG Indicator is a precision-engineered tool designed to identify and display Inversion Fair Value Gaps (IFVGs), a powerful price action concept rooted in ICT (Inner Circle Trader) methodology. This indicator automatically detects when price closes through an existing Fair Value Gap, causing the zone to "invert" and flip its directional bias, signaling potential areas of institutional interest for future price reactions.
What is an Inversion Fair Value Gap?
A Fair Value Gap (FVG) is a three-candle pattern where a gap exists between the wicks of the first and third candles, representing an imbalance in price delivery. These zones often act as magnets for price to return and "fill" the inefficiency.
An Inversion Fair Value Gap (IFVG) occurs when price doesn't just tap into an FVG, it closes through it with a candle body. This "inversion" transforms the zone:
A Bullish FVG that gets closed through becomes a Bearish IFVG (potential resistance/supply zone)
A Bearish FVG that gets closed through becomes a Bullish IFVG (potential support/demand zone)
IFVGs represent areas where the market has shown its hand — institutional order flow has aggressively moved through a prior inefficiency, and the inverted zone now becomes a point of interest for potential reversals or continuations.
Key Features
Automatic IFVG Detection
The indicator continuously monitors for Fair Value Gaps and automatically converts them to IFVGs when price body closes through the zone. No manual identification required.
Multiple Display Styles
Choose from four distinct visualization modes to match your chart aesthetic:
Level — Clean, minimal single line at the IFVG extreme (top for bullish, bottom for bearish)
Normal — Filled zone with dashed borders and dot label
Minimalist — High/low boundary lines with connecting link
Classic — Filled box with 50% midline only
Full Customization
Independent colors for bullish and bearish IFVGs
Adjustable transparency for zone fills
Optional 50% midline (Consequent Encroachment level)
Flexible label styles: "IFVG" or "+/−" notation
Multiple label sizes: Tiny, Small, Normal, Large
Smart Extension Options
Extend to Current Bar — Zones dynamically extend as price progresses
Extend to Confirmation — Zones end at the bar where inversion occurred
Manual Offset — Fine-tune extension length in bars
Clustered IFVG Filter
Prevents chart clutter by ensuring only one IFVG per direction forms within a 5-bar cooldown period. When a single candle closes through multiple FVGs, only the first IFVG of that directional series is displayed — eliminating redundant signals and keeping your chart clean.
FVG Lookback Control
Limit which FVGs can become IFVGs based on their age. Options include 10, 50, 100, 200, or 300 bars. This filters out old, stale FVGs that may create less relevant inversions.
Session Time Filters
Optional time-based filtering allows you to focus on specific trading sessions:
Configurable session windows (e.g., 9:30 AM - 12:00 PM)
Support for two independent session filters
Multiple timezone options including New York, London, Tokyo, and more
Volume Imbalance Detection
Optionally include Volume Imbalances (VIs) — gaps between candle bodies rather than wicks — expanding the scope of detectable inefficiencies.
Invalidation Tracking
IFVGs are automatically invalidated when price closes back through the zone in the opposite direction, with optional display of invalidated zones.
How to Use
Entry Confirmation
IFVGs serve as areas for trade entries. When price returns to a confirmed IFVG:
Bullish IFVG — Look for long entries as price taps the zone from above
Bearish IFVG — Look for short entries as price taps the zone from below
Settings Reference
Inversion Fair Value Gaps
Show IFVGs? — Master toggle for IFVG display
Style — Level, Normal, Minimalist, or Classic
Transparency % — Zone fill opacity (0-100)
Historical Display — Maximum IFVGs to show per direction
Bullish/Bearish Colors — Independent color selection
Show Invalidated? — Display IFVGs that have been invalidated
Extend IFVGs? — Enable dynamic zone extension
Extension Mode — Current Bar or Confirmation
Manual Offset — Additional bars to extend
High/Low Lines — Show boundary lines (Minimalist style)
50% Midline — Show Consequent Encroachment level
Show Labels? — Display zone labels
Label Style — IFVG or +/− notation
FVG Lookback — Maximum age of FVGs that can invert
Clustered Filter — Prevent multiple same-direction IFVGs in quick succession
Volume Imbalances — Include body gaps in detection
Session Filters
Enable 1st/2nd Time Filter — Activate session filtering
Session Times — Define active trading windows
Timezone — Reference timezone for session calculations
Disclaimer
This indicator is provided for educational and informational purposes only. It is not financial advice, and nothing contained herein constitutes a recommendation, solicitation, or offer to buy or sell any securities, options, or other financial instruments.
Trading involves substantial risk of loss and is not suitable for all investors. Past performance is not indicative of future results. You should carefully consider your investment objectives, level of experience, and risk appetite before making any trading decisions.
The developer of this indicator makes no representations or warranties regarding the accuracy, completeness, or reliability of the information provided. You are solely responsible for your own trading decisions and any profits or losses that may result.
Always conduct your own research and consider seeking advice from a licensed financial professional before trading.
Ifvg

KIMATIX FVG/IFVG/BPRProfessional Fair Value Gap & Imbalance Toolkit
The KIMATIX FVG/IFVG/BPR indicator is a precision tool designed to identify institutional inefficiencies in price:
Fair Value Gaps (FVG), Inverse Fair Value Gaps (IFVG) and Balanced Price Ranges (BPR) — clean, minimal and non-repainting.
This indicator is built for scalpers, intraday traders and smart-money traders who want to trade where price is most likely to react, not where indicators lag.
What this indicator shows
Fair Value Gaps (FVG)
Detects bullish and bearish FVGs using strict 3-candle imbalance logic
Highlights areas where price moved too fast, leaving inefficient structure
Ideal for:
Continuation trades
Pullback entries
Reaction zones after impulse moves
Color-coded
🟢 Bullish FVG
🔴 Bearish FVG
Inverse Fair Value Gaps (IFVG)
Automatically detects when an FVG is invalidated
Marks the same zone as an Inverse FVG
Extremely useful for:
Failed structure setups
Reversal trades
Stop-hunt & liquidity traps
Color-coded
🟡 IFVG (invalidation zone)
Balanced Price Range (BPR)
Detects overlapping bullish & bearish FVGs
Highlights price areas where buying and selling pressure are balanced
These zones often act as:
High-probability reaction areas
Compression zones before expansion
Premium intraday decision levels
Color-coded
🔵 BPR (balanced price range)
Smart, Clean & Non-Repainting
Non-repainting
Only the last 3 active zones are shown → no clutter
Boxes extend forward with a manual cap (user-controlled)
Designed for 1m – 15m execution, works on all markets
Futures, Crypto, FX, Indices, Stocks
How professionals use it
Combine FVGs with:
VWAP
Session highs/lows
Volume Profile (POC / VAH / VAL)
Market structure (BOS / displacement)
Use IFVGs to spot failed smart-money narratives
Use BPRs as decision zones, not blind entries
This indicator does not give buy/sell signals.
It shows you where trades make sense — execution is up to you.
Best use cases
Scalping (1m–3m)
Intraday trading (5m–15m)
Smart-money concepts
Liquidity-based trading
News reactions & stop runs
Learn how to trade it properly
This indicator is part of the KIMATIX Trading Framework.
More education, live examples & full system:
kimatixtrading.com

MBZ Model (Simplified Version) [NINE Θ]Overview
The MBZ Model Simplified is an advanced indicator designed to identify reversal zones through the detection of Median Body Zones (MBZs), Inversion Fair Value Gaps (IFVGs), and SMT Divergences. This indicator combines multiple trading concepts into a unified, streamlined tool for precision entries.
The core premise is simple: when price sweeps liquidity and immediately reverses with conviction, it creates a "Median Body Zone", an area where smart money has likely accumulated or distributed positions. These zones often act as powerful support/resistance levels for future price action.
Key Features
Liquidity Level MBZs — Detects reversal zones formed after liquidity sweeps at swing highs/lows
Type 4 (T4) MBZs — Identifies MBZs formed through Fair Value Gap inversions
Inversion Fair Value Gaps (IFVGs) — Tracks FVGs that flip polarity with directional alignment
Market Structure Levels — Displays minor and major buyside/sellside liquidity levels
SMT Divergences — Multi-symbol divergence detection tied to MBZ formations
HTF Open Levels — Power of Three (PO3) analysis with auto-timeframe pairing
Session Filters — Time-based filtering for precise setup validation
Smart Alerts — Forming and validated alerts for all MBZ types
Components Explained
1. Liquidity Level MBZs
Liquidity MBZs form when price:
Sweeps a swing high or swing low (taking liquidity)
Shows immediate rejection with a directional candle
Closes back through the body midpoint of the sweep candle
Bullish MBZ: Forms after a low sweep → Price reverses up aggressively
Bearish MBZ: Forms after a high sweep → Price reverses down aggressively
The zone is drawn from the sweep extreme to the close of the confirmation candle, creating a potential re-entry area if price returns.
Settings Include:
Direction filter (Both/Bullish/Bearish)
Display options (Box/Levels/Both/Close Level)
Zone transparency and colors
25/75% internal levels
Midline display
Historical display count (prioritizes zones closest to price)
PO3 Open alignment filter
2. Type 4 (T4) MBZs
T4 MBZs are a more refined entry model that combines Fair Value Gap analysis with reversal confirmation:
A Fair Value Gap forms in the market
Price returns to tap the FVG
A two-candle reversal pattern confirms the reaction
This creates a tighter, more precise zone compared to standard Liquidity MBZs.
Additional T4 Features:
Lookback period for FVG detection
Consolidation filter (prevents clustering of T4s within X bars)
Optional requirement for Liquidity MBZ directional alignment
Independent historical display settings
3. Inversion Fair Value Gaps (IFVGs)
IFVGs occur when a Fair Value Gap is violated (price closes through it), flipping its polarity:
A bullish FVG that gets closed below becomes a bearish IFVG
A bearish FVG that gets closed above becomes a bullish IFVG
Directional Alignment Feature:
When enabled (default), IFVGs only form when aligned with the current MBZ direction. This creates a cycle:
MBZ forms → Sets directional bias
IFVGs can now form in that direction
Reference MBZ invalidated - IFVG cycle stops
Waits for new MBZ to establish fresh direction
This prevents counter-trend IFVGs from cluttering your chart.
Settings Include:
Classic (box) or Line display style
Lookback filter for source FVGs
Cluster filter (cooldown between IFVGs)
Volume Imbalance inclusion option
Direction filter
MBZ directional alignment toggle
4. Market Structure Levels
Automatically detects and displays swing structure using a multi-timeframe swing detection algorithm:
Minor Levels: Intermediate-term swing highs and lows
Major Levels: Long-term swing highs and lows
Levels extend until filled (price trades through them) and can be customized with various label styles, colors, and display modes.
5. SMT Divergences
Smart Money Technique (SMT) Divergences detect when correlated instruments make divergent swing highs or lows — a potential sign of manipulation or reversal.
Auto-Detection Pairs:
Index Futures: NQ ↔ ES ↔ YM ↔ RTY
Metals: GC ↔ SI ↔ PL
Energy: CL ↔ RB ↔ NG
Key Feature: SMT lines only appear when there's a nearby MBZ in the corresponding direction, filtering out noise and highlighting only the most relevant divergences.
6. HTF Open Levels (PO3)
Displays higher timeframe open prices for Power of Three analysis:
Auto Timeframe Pairing: Automatically selects optimal HTF based on your chart
Vertical session markers: Shows HTF candle boundaries
Open level lines: Track where the HTF candle opened
Auto Pairing Logic:
Sub-1min → 5min
1-2min → 15min
3-4min → 1H
5-9min → 4H
10-59min → Daily
1-4H → Weekly
Daily → Monthly
7. Session Filters
Filter setups to only appear during specific trading sessions:
Two customizable session windows
Timezone selection (NY, Chicago, LA, London, Paris, Tokyo, Shanghai, Sydney)
Only applies on timeframes ≤ 1 hour
Perfect for traders who only trade specific killzones (London Open, NY AM, etc.)
8. PO3 Open Filters
Both Liquidity MBZs and T4 MBZs have optional PO3 alignment filters:
Aligned: Bullish MBZs below HTF open, Bearish above
Reversed: Bullish MBZs above HTF open, Bearish below
Both: No filtering
This helps align entries with the anticipated Power of Three expansion direction.
How to Use It
Basic Workflow:
Identify Bias: Look for a fresh MBZ (Liquidity or T4) to establish direction
Wait for Retest: Price often returns to test MBZ zones
Confirm with IFVGs: IFVGs forming in the same direction add confluence
Check SMT: SMT divergence near an MBZ increases probability
Enter at Zone: Look for lower timeframe confirmation at MBZ levels
Zone Levels:
Close Level: The confirmation candle's close — often the most reactive level
Midline (50%): Equilibrium of the zone
25%/75% Levels: Internal zone levels for precision entries
Invalidation:
Bullish MBZ invalidates on close below zone bottom
Bearish MBZ invalidates on close above zone top
Use "Delete Invalidated" setting to auto-remove or keep for reference
Alerts
The indicator includes comprehensive alerts:
MBZ Forming: Triggers when pattern is developing (before candle close)
MBZ Validated: Triggers when pattern confirms (after candle close)
Separate toggles for Liquidity MBZs and T4 MBZs
Alert messages include symbol and timeframe for easy identification.
Disclaimer
This indicator is a tool for analysis, not a trading system. Always:
Use proper risk management
Combine with your own analysis
Backtest before live trading
Understand that no indicator guarantees profits
Past performance does not indicate future results. Trade responsibly.

Aurora Reversal Suite: Liquidity & Inversion ModelConcept & Methodology The Aurora Reversal Suite is not a general-purpose indicator; it is a hard-coded algorithmic implementation of a specific institutional reversal model often referred to as the "2022 Mentorship Model" or "Sweep-to-Inversion" setup.
While many scripts display Liquidity Sweeps or Fair Value Gaps individually, this script solves the problem of "confluence fatigue" by algorithmically enforcing a strict order of operations. It does not alert on every sweep; it alerts only when a specific sequence of price action events occurs in a verified order.
The Algorithmic Logic (How it Works) The core value of this script lies in its conditional filtering logic, which automates the following manual verification process:
Event A: Liquidity Sweep
The script first monitors key institutional levels: Previous Day High/Low, Session High/Low (Asia/London/NY), and dynamic Swing Points.
It detects a "Sweep" event when price breaches a level but fails to close beyond it (or closes back inside within a defined lookback period).
Event B: Displacement & Inversion
Unlike standard FVG indicators, this script searches specifically for Inversion FVGs (iFVG) that form immediately following the sweep event.
The script logic requires that the iFVG be created by the displacement leg that reverses the sweep. This binds the "Entry Signal" directly to the "Liquidity Event."
Event C: Algorithmic Filtering (The "Strict" Mode)
To filter out false positives common in choppy markets, the script applies a multi-layer filter before printing a signal:
Volume Qualification: The signal bar's volume must exceed a user-defined multiple of the N-period average volume (default 1.5x) to confirm institutional participation.
SMT Divergence Filter: The script cross-references a correlated asset (e.g., NQ vs. ES or EU vs. DXY). If enabled, a signal is only valid if the correlated asset failed to make a matching high/low at the moment of the sweep (SMT Divergence).
Bias Alignment: The script calculates directional bias using a waterfall logic (Daily > 4H > 1H). Signals counter to this calculated bias are suppressed in "Strict" mode.
Included Features & Components
Automated Market Structure: Real-time labeling of BOS (Break of Structure) and MSS (Market Structure Shift) based on swing point logic.
Session Killzones: Visual boxes for Asia, London, and NY sessions with auto-extending high/low lines to track session liquidity.
Multi-Timeframe Dashboard: A calculated table displaying the trend state of the Daily, 4H, and 1H timeframes to assist with top-down analysis.
Power of 3 (PO3) Overlay: Visualization of higher-timeframe candle geometry on lower-timeframe charts to identify accumulation/distribution phases.
Why This Mashup is Necessary Attempting to trade this specific reversal model using separate indicators results in chart clutter and conflicting signals. By combining the Sweep detection, iFVG creation, and SMT filtering into a single codebase, we can programmatically eliminate "naked" sweeps that have no displacement, providing a cleaner and more objective view of the market structure.
Settings & Customization
Signal Mode: Choose between "Simple" (Price Action only) or "Strict" (Trend + Volume filtered).
SMT Input: Manually define the correlated asset ticker for divergence checks.
Visuals: Fully customizable colors for Bullish/Bearish scenarios to fit light or dark themes.
Disclaimer This script is a tool for market analysis and does not guarantee future results. It is intended to assist traders in identifying high-probability setups based on historical price action concepts.

FVG Tracker Pro (@JP7FX)FVG Tracker Pro (JP7FX)
FVG Tracker Pro monitors single timeframe Fair Value Gaps and tracks their behaviour over time. It shows when an FVG forms, when it closes and which candle completes the mitigation.
Features
• Tracks old FVGs so users can review how price interacted with previous gaps.
• Highlights when an FVG is fully mitigated and identifies the closing candle.
• Alerts for new FVG creation and FVG mitigation.
• Optional bar colours, visibility filters and 50 percent lines.
• Works on any asset and timeframe.
How It Helps
• Allows users to follow the lifecycle of each FVG.
• Reduces manual work by marking creation and mitigation automatically.
• Helps traders who study Smart Money concepts and price inefficiencies.
Alerts
Alert conditions are included for:
• New FVG creation
• Full mitigation of an FVG
Users can tailor alert settings to match their preference.

FVG IFVG DetectorThe FVG IFVG Detector is a market–structure-based indicator designed to automatically detect Fair Value Gaps (FVGs) and Inversion Fair Value Gaps (IFVGs) on any timeframe. It highlights these imbalances as extended zones on the chart, helping traders identify areas where price has moved inefficiently and is likely to revisit.
Below is the detailed breakdown of what the indicator does:
1. Detects Bullish and Bearish Fair Value Gaps (FVGs)
The indicator checks for the standard 3-candle FVG structure:
Bullish FVG
Formed when high of candle (n-2) is below low of candle (n)
Indicates price moved upward too fast, leaving an imbalance below.
Bearish FVG
Formed when low of candle (n-2) is above high of candle (n)
Indicates price moved downward too fast, leaving an imbalance above.
2. Detects IFVG (Inversion Fair Value Gaps)
IFVG forms when an FVG is later retested and price reacts opposite its origin.
Bullish IFVG
A bullish FVG is created
Price returns and taps the upper boundary
The candle closes bullish (close > open)
The zone becomes a support-like inversion area
Bearish IFVG
A bearish FVG is created
Price returns and taps the lower boundary
The candle closes bearish (close < open)
The zone becomes a resistance-like inversion area
3. Draws IFVG Zones Extended to the Right
The indicator plots:
A top line
A bottom line
A filled area between the two lines
The zone extends indefinitely to the right, acting like supply/demand imbalance levels.
This makes it visually clear where price may react again in the future.
4. Separate Maximum Counts for Bullish & Bearish IFVGs
User can define:
How many bullish IFVG zones should be displayed
How many bearish IFVG zones should be displayed
Older zones are automatically removed to keep the chart clean.
5. Clean Visuals — No Labels, No Clutter
The indicator intentionally avoids:
Labels
Markers
Text overlays
Only clean, extended imbalance zones are shown for a professional SMC-style chart.
6. Fully Compatible with Any Timeframe
Works on:
Scalping (M1–M15)
Intraday (M30–H1)
Swing (H4–Daily)
The logic stays the same across all chart speeds.
7. Practical Use Cases for Traders
The indicator helps identify:
Areas where price is likely to return, react, or mitigate
Entries based on retest of imbalance
Potential zones for reversal, continuation, or trend confirmation
8. Advantages for SMC Traders
Automatically highlights hidden inefficiencies
Helps anticipate reversal zones
Filters low-quality imbalances
Provides structure-aligned entries
Reduces chart noise
Improves consistency in finding Smart Money levels

Volumetric Inverse Fair Value Gap (IFVG) [Kodexius]The Volumetric Inverse Fair Value Gap (IFVG) indicator detects and visualizes inverse fair value gaps (IFVGs) zones where previous inefficiencies in price (fair value gaps) are later invalidated or “inverted.”
Unlike traditional FVG indicators, this tool integrates volume-based analysis to quantify the bullish, bearish, and overall strength of each inversion. It visually represents these metrics within a dynamically updating box on the chart, giving traders deeper insight into market reactions when liquidity imbalances are filled and reversed.
Features
Inverse fair value gap detection
The script identifies bullish and bearish fair value gaps, stores them as pending zones, and turns them into inverse fair value gaps when price trades back through the gap in the opposite direction. Each valid inversion becomes an active IFVG zone on the chart.
Sensitivity control with ATR filter and strict mode
A minimum gap size based on ATR is used to filter out small and noisy gaps. Strict mode can be enabled so that any wick contact between the relevant candles prevents the gap from being accepted as a fair value gap. This lets you decide how clean and selective the zones should be.
Show Last N Boxes control
The indicator can keep only the most recent N IFVG zones visible. Older zones are removed from the chart once the number of active objects exceeds the user setting. This prevents clutter on higher timeframes or long histories and keeps attention on the most relevant recent zones.
Ghost box for the original gap
When the ghost option is enabled, the script draws a faint box that marks the original fair value gap from which the inverse zone came. This makes it easy to see where the initial imbalance appeared and how price later inverted that area.
Volumetric bull, bear and strength metrics
For each IFVG, the script estimates how much of the bar volume is associated with buying and how much with selling, then computes bull percentage, bear percentage and a strength score that uses a percentile rank of volume. These values are stored with the IFVG object and drive the visualization inside the zone.
Three band visual layout inside each IFVG
Each active IFVG is drawn as a container with three horizontal sections. The top band represents the bull percentage, the middle band the bear percentage and the bottom band the strength metric. The width of each bar reflects its respective value so you can read the structure of the zone at a glance.
Customizable colors and label text
Colors for bull, bear, strength, the empty background area, the ghost box and label text can be adjusted in the inputs. This allows you to match the indicator to different chart themes or highlight specific aspects such as strength or direction.
Automatic invalidation and cleanup
When price clearly closes beyond the IFVG in a way that breaks the logic of that zone, the script marks it as inactive and deletes all boxes and labels linked to it. Only valid and active IFVGs remain on the chart, which keeps the display clean and focused.
Calculations
1. Detecting Fair Value Gaps (FVGs)
A fair value gap is identified when price action leaves an imbalance between candle wicks. Depending on the mode:
Bullish FVG: When low > high
Bearish FVG: When high < low
Optionally, the strict mode ensures wicks do not touch.
The gap’s significance is filtered using the ATR multiplier input to exclude minor noise.
Once detected, FVGs are stored as pending zones until inverted by opposite movement (price crossing through).
bool bull_cond = strict_mode ? (low > high ) : (close > high )
bool bear_cond = strict_mode ? (high < low ) : (close < low )
float gap_size = 0.0
if bull_cond and close > open
gap_size := low - high
if bear_cond and close < open
gap_size := low - high
2. Creating IFVGs (Inversions)
When price later moves through a previous FVG in the opposite direction, an Inverse FVG (IFVG) is created.
For example:
A previous bearish FVG becomes bullish IFVG if price moves upward through it.
A previous bullish FVG becomes bearish IFVG if price moves downward through it.
The IFVG is initialized with structural boundaries (top, bottom) and timestamp metadata to anchor visualization.
if not p.is_bull_gap and close > p.top
inverted := true
to_bull := true
if p.is_bull_gap and close < p.btm
inverted := true
to_bull := false
3. Volume Metrics (Bull, Bear, Strength)
Each IFVG calculates buy and sell volumes from the current bar’s price spread and total volume.
Bull % = proportion of upward (buy) volume
Bear % = proportion of downward (sell) volume
Strength % = normalized percentile rank of total volume
These are obtained through a custom function that estimates directional volume contribution:
calc_metrics(float o, float h, float l, float c, float v) =>
float rng = h - l
float buy_v = 0.0
if rng == 0
buy_v := v * 0.5
else
if c >= o
buy_v := v * ((math.abs(c - o) + (math.min(o, c) - l)) / rng)
else
buy_v := v * ((h - math.max(o, c)) / rng)
float sell_v = v - buy_v
float total = buy_v + sell_v
float p_bull = total > 0 ? buy_v / total : 0
float p_bear = total > 0 ? sell_v / total : 0
float p_str = ta.percentrank(v, 100) / 100.0

KVS-Ultimate FVG & iFVG System [MTF + Distance Filter]Description: This indicator identifies Fair Value Gaps (FVG) and Inversion FVGs (iFVG) across multiple timeframes (MTF) with an advanced visualization system. Unlike standard FVG indicators, this script solves the "chart clutter" problem with a unique Distance Filter and offers a customizable Split Label System.
Key Features:
1. Unique Distance Filter (Clean Screen Mode):
When enabled, the script only shows the closest FVGs to the current price within a user-defined limit.
Keeps your chart clean while focusing on relevant price action levels.
2. Split Label System (Tabular Design):
Completely customizable label positioning, sizing, and coloring.
Separate controls for Normal FVGs and iFVGs.
Smart Label Logic: If you hide the FVG box, its label automatically hides. If an FVG breaks and becomes an iFVG (or fades), the label logic switches automatically to the iFVG settings.
3. Strict Mode Filtering:
Enabled: Checks if the candle closing price effectively breaks the previous structure (High/Low of the 1st candle), ensuring high-quality gaps.
Disabled: Detects all gaps between wicks (Standard calculation).
4. Multi-Timeframe (MTF) Support:
Monitor FVGs from up to 5 different timeframes simultaneously on a single chart.
5. Dynamic Interaction:
Choose how the script reacts when an FVG is broken: Turn it into an iFVG (Inversion) or simply fade the color (Ghost/Fade mode).
How to Use:
Use the "Distance Filter" checkbox in settings to clean up old/far blocks.
Adjust "TF1" to "TF5" to set up your multi-timeframe analysis.
Customize the Label Panel to align text perfectly with your chart style.
Disclaimer: This tool is for educational purposes and support for technical analysis.

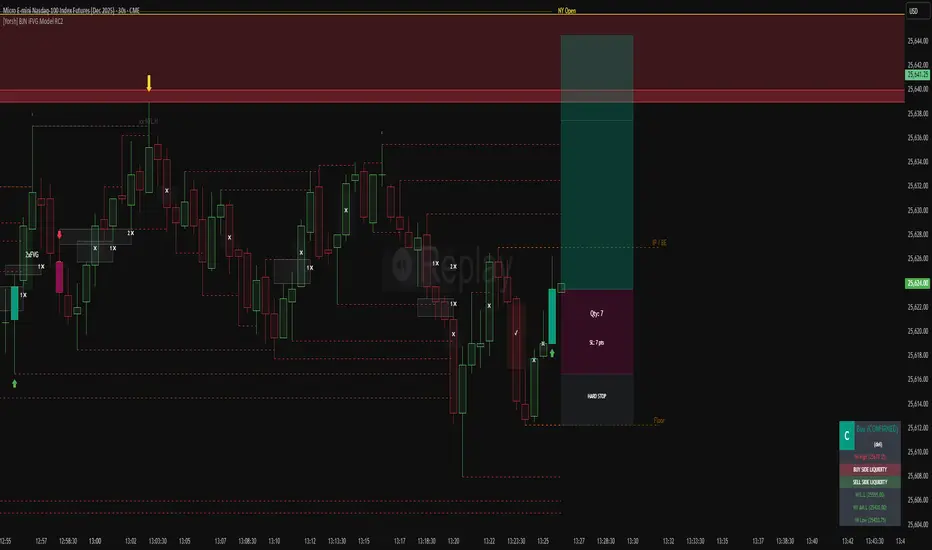
[Yorsh] BJN iFVG Model RC1 BJN iFVG Model - Mechanical Trading System
Description:
The BJN iFVG Model is not just an indicator; it is a full-scale, semi-automated trading architecture designed to mechanically execute the specific "BJN" Inverted FVG strategy.
Designed for precision traders operating on Lower Timeframes (1m to 5m), this script eliminates the cognitive load of manual analysis. It automates every single step of the mechanical model—from Higher Timeframe narrative building to tick-perfect structural validation and risk calculation.
This tool transforms your chart into a professional trading cockpit, split into three intelligent engines:
1. The Matrix (Context Engine)
Before looking for an entry, you must understand the narrative. The Matrix handles the heavy lifting of multi-timeframe analysis without cluttering your chart:
Real-Time Delivery State: Automatically detects if price is reacting from valid HTF PD Arrays (1H, 4H, Daily) to confirm a "Delivery" state.
Liquidity Sweeps: Tracks Fractals across three dimensions (1H, 15m, and Micro-Structure) to identify liquidity raids instantly.
Advanced SMT Divergence: A built-in, multi-mode SMT engine scans for correlation breaks (Pivot SMT, Adjacent Wick SMT, and FVG SMT) between NQ/ES (or custom tickers) in real-time.
Time & Macro Tracking: Automatically visualizes Killzones and highlights high-probability Macro windows.
2. The Executioner (Entry Engine)
Once the context is set, the Executioner handles the specific Inverted FVG (iFVG) entry model with strict mechanical rules:
Structural Integrity: Automatically identifies the Invalidation Point (IP), Floor/Ceiling, and Break-Even levels for every setup.
Hazard Detection: The script proactively scans the "Trading Leg" for opposing unmitigated FVGs (Hazards). If the path isn't clean, the trade is flagged or invalidated.
Composite Logic: Intelligently merges "noisy" price action into Composite FVGs to reduce false signals.
Integrated Position Sizer: When a trade is confirmed, a visual box appears showing your precise Entry, Stop Loss, Hard Stop, and Take Profit levels, along with a calculated Contract Quantity based on your risk tolerance.
3. The Ranking System (Quality Control)
Not all trades are created equal. This system grades every single confirmed setup in real-time based on confluence factors:
Grades: Ranges from A++ (Perfect Confluence) to C (Low Probability).
Confluence Check: Checks for Delivery, Sweeps (HTF/LTF), SMT, and Macro alignment at the exact moment of the trigger.
Live Status Panel: A dashboard on your chart displays the current live trade status (Armed, Triggered, Confirmed) and its Rank, so you never miss a beat.
Optimization & Performance
Trading on the 1-minute timeframe requires speed. This script has been rigorously optimized for high-frequency environments:
Smart Garbage Collection: The script manages its own memory, cleaning up old data arrays to prevent lag, ensuring the chart remains fluid even after days of data accumulation.
Tunnel Vision: Calculations are strictly focused on the relevant trading leg, ignoring historical noise to maximize execution speed.
Zero-Repaint: All historical analysis is strictly non-repainting to ensure backtesting reliability.
How to Use
Timeframes: Optimized for 1m, 2m, 3m, 4m, 5m execution.
Alerts: Configure the robust alert system to notify you only when setups meet your standards (e.g., "Alert only on Rank B+ or higher").
Strategy: Wait for the Status Panel to show a "CONFIRMED" signal. Use the on-screen Position Sizer to execute the trade with the displayed risk parameters.
Stop analyzing; start executing. Welcome to mechanical trading.
----------------------------------------------------------------------------------------------------------------
RISK DISCLAIMER:
The content, tools, and signals generated by this script are strictly for educational and informational purposes only. This script does not constitute financial advice, investment recommendations, or a solicitation to buy or sell any securities, futures, or other financial instruments.
Trading financial markets involves a high degree of risk and is not suitable for all investors. The "Position Sizer" and "Trade Setups" displayed are hypothetical simulations designed to demonstrate the mechanics of the BJN methodology; they do not guarantee future performance.
Use this tool at your own risk. The author assumes no responsibility or liability for any trading losses or damages incurred in connection with the use of this script. Always consult with a qualified financial advisor and practice proper risk management.
Inversion Fair Value Gap Model [PJ Trades]GENERAL OVERVIEW:
The Inversion Fair Value Gap Model indicator is a complete rule-based system designed to identify trade setups using the Inversion Fair Value Gap strategy taught by PJ Trades. It automates the strategy’s workflow by detecting liquidity sweeps, confirming V-shape recoveries, identifying valid Inversion Fair Value Gaps, validating higher-timeframe Fair Value Gap taps, and checking for a clear opposite Draw On Liquidity. These factors are evaluated together to produce a signal rating of A, A+, or A++, based on how many of these criteria the setup satisfies. When a long or short setup is confirmed, the indicator automatically plots an entry, stop-loss, break-even, and two take-profit levels.
A dashboard that updates in real-time displays the current directional bias, liquidity sweep activity, Inversion Fair Value Gap confirmation state, V Shape Recovery state, higher-timeframe Fair Value Gap context, opposite Draw on Liquidity, SMT divergence, and other key information relevant to the trading model. The indicator also includes optional trade statistics on the dashboard that tracks the recent win rates for A, A+, and A++ setups, as well as separate long and short win rates.
This indicator was developed by Flux Charts, in collaboration with PJ Trades.
What is the theory behind the indicator?:
The Inversion Fair Value Gap model is built on the idea that when the market pushes above a high or below a low, it often does so to sweep liquidity. If that move quickly fails and price reverses, it shows the sweep was a grab for orders and not a continuation. That quick rejection is the V Shape Recovery behavior. An Inversion Fair Value Gap forms when a Fair Value Gap that once supported the original move gets invalidated afterward. That invalidation confirms the shift in direction and becomes the new reference point for trades. The Inversion Fair Value Gap model uses this sequence because it highlights when the market has taken liquidity, rejected continuation, and started delivering in the opposite direction.
INVERSION FAIR VALUE GAP MODEL FEATURES:
The Inversion Fair Value Gap Model indicator includes 15 main features:
Sessions
Key Levels & Swing Levels
Liquidity Levels
Liquidity Sweeps
V Shape Recoveries
Higher-Timeframe Fair Value Gaps
Inversion Fair Value Gaps
Macros
Bias
Signals
New Day Opening Gap
New Week Opening Gap
SMT Divergences
Dashboard
Alerts
SESSIONS:
The Inversion Fair Value Gap Model indicator includes five trading sessions (times in EST):
Asia: 20:00 - 00:00
London: 02:00 - 05:00
NY AM: 09:30 - 12:15
NY Lunch: 12:15 - 13:30
NY PM: 13:30 - 16:00
Session highs and lows are automatically tracked and used within the indicator’s signal logic.
🔹Session Zones:
Each session has a zone that outlines its active time window. These zones can be toggled on or off independently. When active, they visually separate each part of the trading day. Users can adjust the color and opacity of each session box. Users can also enable session labels, which place a label above each session zone showing its corresponding session name.
🔹Session Time:
Users can toggle on ‘Time’ which will display each session’s time window next to its session title.
🔹Session Highs/Lows:
Every session can display its own high and low as horizontal lines. Users can customize the line style for session highs/lows, choosing between solid, dashed, or dotted. The color of the lines will match the same color used for the session box. Users can adjust the color of the labels as well, which is applied to all session high/low labels.
When price has moved above a session high, or below a session low, the label will not be displayed anymore.
🔹Extend Levels:
When enabled, each session’s high and low levels can be extended forward by a set number of bars.
Please Note: Disabling a session under the main Sessions section only hides its visuals (boxes, lines, or labels). It does not impact signal detection or logic.
KEY LEVELS:
The Inversion Fair Value Gap Model indicator includes 11 key market levels that outline important structural price areas across daily, weekly, and monthly timeframes. These levels include the Daily Open, Previous Day High/Low, Weekly Open, Previous Week High/Low, Monthly Open, Previous Month High/Low, Midnight Open, and 08:30 Open. The levels can be enabled or disabled and customized in color and line style. All of the levels except the Midnight Open and 08:30 Open are used for the indicator’s signal logic.
🔹Daily Open
The Daily Open marks where the current trading day began.
🔹Previous Day High/Low
The Previous Day High (PDH) marks the highest price reached during the previous regular trading session. It shows where buyers pushed price to its highest point before the market closed.
The Previous Day Low (PDL) marks the lowest price reached during the previous regular trading session. It shows where selling pressure reached its lowest point before buyers stepped in.
When price pushes above the PDH or below the PDL, the level is removed from the chart.
🔹Weekly Open
The Weekly Open marks the first price of the current trading week.
🔹Previous Week High/Low
The Previous Week High (PWH) marks the highest price reached during the previous trading week. It shows where buying pressure reached its peak before the weekly close.
The Previous Week Low (PWL) marks the lowest price reached during the previous trading week. It shows where sellers pushed price to its lowest point before buyers regained control.
When price pushes above the PWH or below the PWL, the level is removed from the chart.
🔹Monthly Open
The Monthly Open marks the opening price of the current month.
🔹Previous Month High/Low
The Previous Month High (PMH) marks the highest price reached during the previous calendar month. It represents the point at which buyers achieved the strongest push before the monthly close.
The Previous Month Low (PML) marks the lowest price reached during the previous calendar month. It shows where selling pressure was strongest before buyers stepped back in.
When price pushes above the PMH or below the PML, the level is removed from the chart.
🔹Midnight Open
The Midnight Open marks the first price of the trading day at 00:00 EST.
🔹08:30 Open
The 08:30 Open marks the opening price at 08:30 EST.
🔹Customization Options:
Users can fully customize the appearance of all key levels, including the following:
Labels
Label Size
Line Style
Line Colors
Labels:
Users can toggle on ‘Show Labels’ to display labels for each toggled-on level that price hasn’t pushed above/below. Users can also adjust the size of labels, choosing between auto, tiny, small, normal, large, or huge.
Line Style:
Users can select a line style, choosing between solid, dashed, or dotted, which is applied to all toggled-on key levels.
Line Color:
Users can choose different colors for each of the following key levels:
Daily Open, Previous Day High, Previous Day Low
Weekly Open, Previous Week High, Previous Week Low,
Monthly Open, Previous Month High, Previous Month Low
Midnight Open
08:30 Open
🔹Extend Levels:
When enabled, each key level is extended forward by a set number of bars.
Please Note: Disabling a level in the “Key Levels” section only hides its visuals and does not affect the indicator’s signals.
🔹Swing Levels
The indicator automatically plots Swing Highs and Swing Lows which are used in the indicator’s signal generation logic.
A swing high forms when a candle’s high is greater than the highs of the bars immediately before and after it.
A swing low forms when a candle’s low is lower than the lows of the bars immediately before and after it.
🔹Swing Level Colors
Users can customize the color of Active Levels and Swept Levels.
Active Levels are levels that price has not pushed above or below
Swept Levels are levels that price pushed above or below.
🔹Swing Levels – Show Nearest
This setting determines how many swing highs/lows are displayed on the chart. The indicator will display the nearest X highs to price and the nearest X lows to price.
For example, if ‘Show Nearest’ is set to 2, the nearest 2 swing highs and nearest 2 swing lows to price will be plotted on the chart.
LIQUIDITY LEVELS:
The Inversion Fair Value Gap Model indicator automatically identifies and plots liquidity at key structural points in the market. These include swing highs and swing lows, session highs and lows, and major higher timeframe reference points as explained in the SESSIONS and KEY LEVELS sections above. All of these areas are treated as potential pools of resting orders and are used throughout the indicator’s signal logic.
🔹What is Buyside Liquidity?:
Buyside Liquidity (BSL) represents price levels where many buy stop orders are sitting, usually from traders holding short positions. When price moves into these areas, those stop-loss orders get triggered and short sellers are forced to buy back their positions. These zones often form above key highs such as the previous day, week, or month. Understanding BSL is important because when price reaches these levels, the sudden wave of buy orders can create sharp reactions or reversals as liquidity is taken from the market.
🔹What is Sellside Liquidity?:
Sellside Liquidity (SSL) represents price levels where many sell stop orders are waiting, usually from traders holding long positions. When price drops into these areas, those stop-loss orders are triggered and long traders are forced to sell their positions. These zones often form below key lows such as the previous day, week, or month. Understanding SSL is important because when price reaches these levels, the surge of sell orders can cause sharp reactions or reversals as liquidity is taken from the market.
🔹 Which Liquidity Levels Are Used
The indicator tracks liquidity at the following areas:
Asia Session High/Low
London High/Low
NY AM High/Low
NY Lunch High/Low
NY PM High/Low
Previous Day High and Low
Previous Week High and Low
Previous Month High and Low
Daily Open
Weekly Open
Monthly Open
Swing Highs/Lows
🔹 How Liquidity Levels Are Used
All tracked levels across sessions, swing points, and higher timeframes serve as potential liquidity targets. When price trades above one of these highs, the indicator looks for short setups if other confluences align. When price trades below lows, the indicator looks for long setups if other confluences align.
LIQUIDITY SWEEPS:
The indicator automatically detects Buyside Liquidity and Sellside Liquidity sweeps using the liquidity levels mentioned in the previous section.
🔹What is a Liquidity Sweep?
Liquidity sweeps occur when price trades beyond a key high or low and activates resting buy-stop or sell-stop orders in that area. It’s how the market gathers the liquidity needed for larger participants to enter positions.
Traders often place stop-loss orders around obvious highs and lows, such as the previous day’s, week’s, or month’s levels. When price pushes through one of these areas, it triggers the stops placed there and generates a burst of volume. This can lead to quick movements in price as those orders are executed.
🔹Sellside Liquidity Sweep
These occur when price dips below a Sellside Liquidity (SSL) level, taking out the stop-loss orders placed by long traders below that low. When this happens, the indicator records the sweep and begins monitoring for potential long setups as the next step in the IFVG trading strategy. Long trades are only eligible after a SSL sweep.
🔹Buyside Liquidity Sweep
These occur when price dips above a Buyside Liquidity (BSL) level, taking out the stop-loss orders placed by short seller traders above that high. When this happens, the indicator records the sweep and begins monitoring for potential short setups as the next step in the trading strategy. Short trades are only eligible after a BSL sweep.
🔹How to Use Liquidity Sweeps
Liquidity sweeps are not direct trade signals. They are best used as context when forming a directional bias. A sweep shows that the market has removed liquidity from one side, which can hint at where the next move may develop.
For example:
When BSL is swept, it often signals that buy stops have been triggered and the market may be preparing to move lower. Traders may then begin looking for short opportunities.
When SSL is swept, it often signals that sell stops have been triggered and the market may be preparing to move higher. Traders may then begin looking for long opportunities.
V SHAPE RECOVERIES:
🔹 What Is a V Shape Recovery?
A V shape recovery is a sharp, immediate reversal that happens right after price sweeps BSL or SSL. It indicates that price quickly moved back in the opposite direction after trading through the level. This behavior signals a shift in momentum and is a required confirmation in the indicator for signal generation. The indicator will not look for long trades after a SSL sweep unless a V shape recovery occurs. It will not look for short trades after a BSL sweep unless a V shape recovery occurs. Without this behavior, the indicator assumes that price may still be delivering in the direction of the sweep, so no valid setups can form.
🔹 Why V Shape Recoveries Matter
V shape recoveries help confirm that the liquidity the sweep did not immediately continue in the same direction. They separate false breaks from true continuation. A sweep without recovery often means price may keep trending, so the indicator does not generate signals in those cases. A sweep with a V shape recovery confirms rejection and sets the foundation for valid Inversion Fair Value Gap formation. This makes the V shape recovery one of the most important sequence steps in the Inversion Fair Value Gap Model.
🔹 How the Indicator Detects V Shape Recoveries
V shape recoveries can be visually intuitive when looking at a chart, but they are difficult to define consistently programmatically. To ensure reliable and repeatable detection, the indicator uses a rules-based method that evaluates candle size, candle direction, and the strength of the move immediately following the liquidity sweep. This approach removes subjectivity and allows the indicator to confirm V shape behavior the same way every time.
The indicator does not plot any visual elements specifically for V shape recoveries. Instead, the presence of a V shape recovery is implied through the signals themselves. Every valid long or short signal that appears after a liquidity sweep requires a confirmed V shape recovery. This means that if a signal is generated following a sweep, a V shape recovery has occurred.
🔹 V Shape Recovery After a Sellside Sweep (SSL Sweep)
After price trades below a sellside liquidity level, long positions are liquidated. If buyers quickly step in and force price upward with strong momentum, this forms a V shape recovery. This signals that the sweep below the low was rejected and that buyers have reclaimed control. When this occurs, the indicator begins monitoring for long setups.
🔹 V Shape Recovery After a Buyside Sweep (BSL Sweep)
After price pushes above a buyside liquidity level, many short positions are stopped out. If sellers immediately step in and drive price back down with strong movement, this forms a V shape recovery. This behavior reflects a quick change in candle direction immediately following the sweep. When this occurs, the indicator begins monitoring for short setups.
🔹Failed V Shape Recoveries
These examples show failed V shape recoveries, where price did not reverse decisively after the BSL or SSL sweep. The lack of strong response from buyers or sellers indicates that momentum did not shift. Thus, the indicator will not detect valid long/short setups using these liquidity sweeps.
HIGHER-TIMEFRAME FAIR VALUE GAPS:
Higher-timeframe Fair Value Gaps (HTF FVGs) provide important context in the Inversion Fair Value Gap Model because they show where significant imbalance occurred on larger market structures. The indicator automatically detects HTF FVGs and uses them as part of the signal rating system.
🔹 What Is a Fair Value Gap?
A Fair Value Gap (FVG) is an area where the market’s perception of fair value suddenly changes. On your chart, it appears as a three-candle pattern: a large candle in the middle, with smaller candles on each side that don’t fully overlap it.
A bullish FVG forms when a bullish candle is between two smaller bullish/bearish candles, where the first and third candles’ wicks don’t overlap each other at all.
A bearish FVG forms when a bearish candle is between two smaller bullish/bearish candles, where the first and third candles’ wicks don’t overlap each other at all.
This creates an imbalance because price moved so quickly that one side of the auction did not trade.
Examples:
🔹 What Makes an FVG “Higher-Timeframe”?
In this indicator, HTF FVGs are Fair Value Gaps detected on timeframes higher than the chart’s current timeframe. For example, on a 5-minute chart, a 1-hour FVG would be considered a HTF FVG. The indicator automatically plots and checks whether price interacts with these HTF FVGs during a liquidity sweep and incorporates this into the signal rating (A, A+, A++).
🔹 How the Indicator Uses Higher-Timeframe FVGs
The indicator automatically scans up to three user-selected higher timeframes for valid bullish and bearish FVGs and tracks price’s behavior around them in the background. When any of these higher timeframes are enabled, their FVGs are used directly within the signal logic.
During a liquidity sweep, the indicator checks whether price taps into any enabled HTF FVG. A tap occurs when price trades inside the boundaries of a higher-timeframe FVG during or immediately after the sweep.
A bullish HTF FVG tap during a sellside sweep supports a long setup.
A bearish HTF FVG tap during a buyside sweep supports a short setup.
When an HTF FVG tap aligns with the direction of the setup, the signal’s rating is increased. This can increase a setup’s rating from A to A+ or from A+ to A++.
🔹 Higher-Timeframe FVG Customization
Users can select up to three higher timeframes for HTF FVG detection. When a higher timeframe is enabled, its FVGs are used in the model’s signal logic. Users can also choose whether to display these HTF FVGs visually on the chart, by enabling the ‘Plot HTF FVGs’ setting.
Each enabled HTF FVG can be customized with the following options:
Bullish and Bearish Colors: Users can set different fill colors for bullish and bearish HTF FVGs for each selected timeframe.
Midline: When enabled, a midline is drawn through the center of each HTF FVG. Users can customize the midline’s line style, choosing between solid, dashed, or dotted and also customize the midline’s color.
Labels: When enabled, each plotted HTF FVG displays a label that shows its originating timeframe (for example, 1H, 4H).
Plot HTF FVGs: When disabled, the HTF FVG zones are hidden from the chart while the logic remains active in the background for signals.
Show Nearest:
This setting controls how many HTF FVGs are displayed based on proximity to current price. Users can choose to show the nearest X bullish HTF FVGs and the nearest X bearish HTF FVGs. This filter is applied across all enabled higher timeframes and does not limit by timeframe individually.
🔹When are Higher Timeframe Fair Value Gaps mitigated?
A Higher Timeframe Fair Value Gap is considered mitigated when a candle from the chart’s timeframe closes above the gap for a bearish FVG or below the gap for a bullish FVG.
INVERSION FAIR VALUE GAPS:
Inversion Fair Value Gaps (IFVGs) are a core requirement of the Inversion Fair Value Gap Model. Every long and short signal generated by the indicator requires a valid IFVG, just like liquidity sweeps and V shape recoveries. Without a confirmed IFVG, the model will not produce a setup.
🔹 What Is an Inversion Fair Value Gap?
An Inversion Fair Value Gap is a Fair Value Gap that becomes invalidated by a candle close in the opposite direction. This “flip” confirms that the original imbalance failed and that the market has shifted.
A bullish IFVG forms when a bearish FVG is invalidated by a candle closing above it.
A bearish IFVG forms when a bullish FVG is invalidated by a candle closing below it.
In the indicator, IFVGs are not used as retracement areas. Signals are generated immediately when a valid IFVG forms, not after price returns to the gap. The IFVG itself is the confirmation event that finalizes a setup sequence after a liquidity sweep and V shape recovery.
🔹 How the Indicator Plots IFVGs
The indicator only plots IFVGs that are used in long or short setups. Not every possible IFVG is shown on the chart. Only the IFVG involved in a confirmed signal is displayed. Users can disable IFVG plots entirely if they prefer a minimal view. This hides the visual gaps but does not affect the signal logic.
🔹 Customization Options
Users can customize how IFVGs appear on the chart:
Color Settings: Choose separate fill colors for bullish IFVGs and bearish IFVGs.
Midline: Toggle an optional midline inside the IFVG and choose between a solid, dashed, or dotted line.
Midline Color: Adjust the color of the IFVG Midline.
MACROS:
Macros are short, predefined time windows, where price is more likely to seek liquidity or rebalance imbalances. These periods often create sharp movements or shifts in delivery, giving additional context to setups. In the Inversion Fair Value Gap Model, macros are used as a confluence factor. When a long or short signal forms during a macro time window, the setup’s rating can increase from A to A+ or from A+ to A++.
Macros are not required for a signal to form, but they increase the signal’s rating when the setup aligns with macro timing.
🔹 How the Indicator Uses Macros
The indicator allows users to enable up to five macros. Each macro has its own start and end time, which the user can customize. These time windows are used directly in the signal logic. If a valid IFVG setup forms while price is inside any of the enabled macro windows, the indicator increases the signal’s rating.
Users may visually disable macros on the chart without affecting signal logic. Disabling visuals hides the macro zones, labels, and lines, but the underlying macro logic continues to function in the background for signals.
The indicator’s default macros use the following time periods (in EST):
09:50 - 10:10
10:50 - 11:10
11:50 - 12:10
12:50 - 13:10
13:50 - 14:10
🔹 Macro Settings
Each macro displays a shaded zone representing the active time window. This zone can be toggled on or off. Users can customize:
The color of each macro zone
The opacity of each zone
Whether the zones display at all (‘Show Zones’)
These visuals help identify whether price is currently inside a macro window.
🔹 Macro Labels:
Users can enable macro labels, which place a text label showing the macro’s title and its time window. The label color is global (applies to all macros), and the label size can be adjusted. Individual macros cannot have unique label colors.
🔹 Macro Start/End Lines
For additional clarity, the indicator draws two vertical markers for each macro:
One at the start of the macro
One at the end of the macro
A horizontal macro line is then drawn between the highs of these two candles to highlight the full duration of the macro window. Users can customize:
The line styles (solid, dashed, dotted) of the Macro Line and Start/End Lines
BIAS:
Bias determines which direction the indicator is allowed to generate signals. A bullish bias means only long setups can be confirmed. A bearish bias means only short setups can be confirmed. The bias acts as the final directional filter after a liquidity sweep, V shape recovery, and IFVG have all been validated. Even if all model conditions are met, the indicator will only confirm the setup if the direction aligns with the active bias.
Users are able to manually set a bias or use an automatic bias filter, which is explained below.
🔹 Manual Bias
Users can manually choose the directional bias at any time and choose between Bullish, Bearish, or Both.
When set to Bullish, the indicator will only confirm long setups, regardless of market structure.
When set to Bearish, only short setups are allowed.
When set to Both, the indicator can confirm both long and short setups if all requirements are met.
🔹 Automatic Bias
Automatic bias is fully rules-based and determined by how the previous session interacted with major draw-on-liquidity (DOL) levels. These levels include 1-hour highs and lows, 4-hour highs and lows, previous session highs and lows (such as Asia or London), and the previous day’s high and low. The indicator evaluates whether the previous session consolidated, manipulated liquidity, or manipulated and reversed before closing. Based on this behavior, the indicator establishes a directional bias for the current session.
◇ Previous Session Consolidation:
If the previous session did not sweep any major liquidity levels and price remained inside its range, the session is classified as consolidation.
After the current session sweeps a key low, the bias becomes bullish.
After the current session sweeps a key high, the bias becomes bearish.
The bias is determined live based on which side the current session manipulates first.
◇ Previous Session Manipulation (No Reversal):
If the previous session swept a major high-timeframe level but did not reverse before the session closed, the model assigns a reversal-based bias at the start of the current session.
If the previous session swept a low, the current session bias is bullish.
If the previous session swept a high, the current session bias is bearish.
Here, bias is determined immediately because the previous session’s manipulation defines the directional framework for the current session.
◇ Previous Session Manipulation + Reversal:
If the previous session swept a DOL level and also reversed away from it within the same session, the model assigns a continuation-based bias at the start of the current session.
If the previous session swept a low and reversed upward, the bias for the current session is bullish.
If the previous session swept a high and reversed downward, the bias is bearish.
🔹 How the Indicator Uses Bias in Practice
After the indicator validates the liquidity sweep, V shape recovery, and IFVG, it checks the active bias before confirming a signal.
If bias is bullish, only long setups are allowed.
If bias is bearish, only short setups are allowed.
If bias is Both, setups of either direction may form.
The bias does not influence the detection of liquidity sweeps, V shape recoveries, or IFVGs. It only determines whether those validated components are allowed to produce a final signal. Automatic bias updates based on session behavior, while manual bias remains fixed until the user changes it.
SIGNALS:
Signals are the final output of the Inversion Fair Value Gap Model indicator. A signal is only generated when all model conditions are satisfied in a clear, rules-based sequence.
A signal consists of:
An Entry
A Stop-Loss (SL)
A Breakeven (BE) level
Two Take-Profit levels (TP1 and TP2)
These components are plotted immediately once the final requirement (the IFVG confirmation) is met and the directional filter (bias) allows the setup.
Signals can be rated A, A+, or A++, based on whether certain confluences were present during the setup’s formation.
🔹 What All Signals Have in Common
Each signal type (A, A+, A++) requires the same four mandatory conditions. If any of these four are missing, the indicator will not print a signal.
◇ Required Component #1 – Valid Directional Bias
The bias determines whether the indicator can confirm a long or short setup.
Bullish bias → only long setups allowed
Bearish bias → only short setups allowed
Both → long or short setups allowed
Automatic bias → bias determined by session-based liquidity logic explained above
◇ Required Component #2 – Liquidity Sweep
The indicator must detect one of the following:
Sellside Liquidity Sweep (SSL Sweep) for potential long setups
Buyside Liquidity Sweep (BSL Sweep) for potential short setups
◇ Required Component #3 – V Shape Recovery
After a liquidity sweep, the indicator evaluates whether price produced a valid V shape recovery.
◇ Required Component #4 – Inversion Fair Value Gap (IFVG)
An IFVG must form in the direction of the potential setup.
A bullish IFVG forms when a bearish FVG is invalidated by a candle closing above that gap
A bearish IFVG forms when a bullish FVG is invalidated by a candle closing below that gap
The IFVG must occur after the V Shape Recovery and Liquidity Sweep. The IFVG confirmation is the final structural requirement. Once it forms, the setup is considered structurally complete.
🔹 A Signals
An A-rated signal contains exactly the four required components:
Valid Bias
Liquidity Sweep
V Shape Recovery
IFVG
An A signals represent the foundational implementation of the IFVG Model.
🔹 A+ Signals
An A+ signal includes the full A-signal structure plus ONE of the following:
Higher-Timeframe FVG Tap
Multi-Liquidity Sweep
Inside a Macro Window
◇ Higher-Timeframe FVG Tap
During a liquidity sweep, the indicator checks whether price taps into any enabled HTF FVG. A tap occurs when price trades inside the boundaries of a higher-timeframe FVG during or immediately after the sweep.
A bullish HTF FVG tap during a sellside sweep supports a long setup.
A bearish HTF FVG tap during a buyside sweep supports a short setup.
◇ Multi-Liquidity Sweep
A Multi-Liquidity Sweep occurs when price sweeps two liquidity levels of the same type in the same directional push.
Sweeping two lows in one move: Multi-Sellside Liquidity Sweep (long setups).
Sweeping two highs in one move → Multi-Buyside Liquidity Sweep (short setups).
◇ Inside a Macro Window
The final IFVG confirmation must occur inside a macro time window defined by the user.
If exactly one of these additional confluences is present, the signal rating is A+.
🔹 A++ Signals (Two Additional Confluences)
An A++ signal contains the full A signal structure plus TWO of the three confluences listed above.
HTF FVG tap + Multi-Liquidity Sweep
HTF FVG tap + Inside a Macro Window
Multi-Liquidity Sweep + Inside a Macro Window
If two confluences are present, the rating becomes A++. If all three are present, the setup is still rated a A++ (there is no A+++).
🔹 Signal Plots
When a valid long/short setup is detected, a signal with its rating appears with the following:
Entry: At the close of the candle that inverted a FVG
Stop-Loss: At the nearest swing high for short setups or nearest swing low for long setups
Breakeven Level: At the nearest swing high for long setups or the nearest swing low for short setups
Take-Profit 1: At the second nearest swing high for long setups or the second nearest swing low for short setups.
Take-Profit 2: At the third nearest swing high for long setups or the third nearest swing low for short setups.
After a signal reaches either TP2 or SL, the levels for Entry, SL, BE, TP1, and TP2 are removed from the chart. If another signal appears before the prior signal reaches either TP2 or SL, the levels are also removed.
Users can hover over any signal label to view a short summary of the exact criteria that were met for that setup. This includes whether a HTF FVG tap occurred, whether a multi-liquidity sweep was detected, whether the setup formed inside a macro window, and which liquidity level was swept prior to the V shape recovery.
🔹 Long Setup – A Rating
A long A-rated setup forms when all four core requirements of the IFVG Model occur without any additional confluences. First, price must sweep a Sellside Liquidity level. Immediately after the sweep, price must form a valid V shape recovery. Once the recovery completes, a bullish IFVG must form by invalidating a bearish Fair Value Gap with a candle close above it.
For a confirmed long signal, the indicator marks:
Entry: At the candle close that invalidates the bearish FVG and creates the IFVG
Stop Loss: At the nearest swing low
Breakeven: Midpoint between entry and stop-loss
Take Profit 1: At the second nearest swing high
Take Profit 2: At the third nearest swing high
In this example, price sweeps a swing low, has a V Shape recovery, and forms a bullish IFVG:
🔹 Short Setup – A Rating
A short A-rated setup forms when all four core requirements of the IFVG Model occur without any additional confluences. Price must first sweep a Buyside Liquidity level. Immediately after the sweep, price must form a valid V shape recovery. Once the recovery completes, a bearish IFVG must form by invalidating a bullish Fair Value Gap with a candle close below it.
For a confirmed short signal, the indicator marks:
Entry: At the candle close that invalidates the bullish FVG and creates the IFVG
Stop Loss: At the nearest swing high
Breakeven: Midpoint between entry and stop-loss
Take Profit 1: At the second nearest swing low
Take Profit 2: At the third nearest swing low
In this example, price sweeps a swing high, has a V shape recovery, and forms a bearish IFVG:
🔹 Long Setup – A+ Rating
A long A+ setup forms when the four core requirements of the IFVG Model occur and exactly one additional confluence is present. Price must sweep a Sellside Liquidity level, form a valid V shape recovery, and create a bullish IFVG by invalidating a bearish FVG. One of the following must also occur: a bullish HTF FVG tap during the liquidity sweep, a multi-sellside liquidity sweep, or the IFVG confirmation forms inside a macro window.
For a confirmed long A+ signal, the indicator marks:
Entry: At the candle close that creates the bullish IFVG
Stop Loss: At the nearest swing low
Breakeven: Midpoint between entry and stop-loss
Take Profit 1: At the second nearest swing high
Take Profit 2: At the third nearest swing high
In this example, price sweeps the NY AM Session Low, taps a 30-minute HTF FVG during the sweep, has a V shape recovery, and forms a bullish IFVG:
🔹 Short Setup – A+ Rating
A short A+ setup forms when the four core requirements of the IFVG Model occur and exactly one additional confluence is present. Price must sweep a Buyside Liquidity level, form a valid V shape recovery, and create a bearish IFVG by invalidating a bullish FVG. One of the following must also occur: a bearish HTF FVG tap, a multi-buyside liquidity sweep, or the IFVG confirmation forms inside a macro window.
For a confirmed short A+ signal, the indicator marks:
Entry: At the candle close that creates the bearish IFVG
Stop Loss: At the nearest swing high
Breakeven: Midpoint between entry and stop-loss
Take Profit 1: At the second nearest swing low
Take Profit 2: At the third nearest swing low
In this example, price sweeps a swing high, has a V shape recovery, and forms a bearish IFVG inside of the 13:50-14:10 macro:
🔹 Long Setup – A++ Rating
A long A++ setup forms when the four core requirements of the IFVG Model occur and at least two additional confluences are present. Price must sweep a Sellside Liquidity level, form a valid V shape recovery, and create a bullish IFVG. The setup must also include any two or three of the following: a bullish HTF FVG tap, a multi-sellside liquidity sweep, or the IFVG confirmation forming inside a macro window.
For a confirmed long A++ signal, the indicator marks:
Entry: At the candle close that creates the bullish IFVG
Stop Loss: At the nearest swing low
Breakeven: Midpoint between entry and stop-loss
Take Profit 1: At the second nearest swing high
Take Profit 2: At the third nearest swing high
In this example, price sweeps two swing lows, has a V shape recovery, taps a bullish 30-minute HTF FVG during the liquidity sweep, and forms a bullish IFVG inside of the 10:50-11:10 macro:
🔹 Short Setup – A++ Rating
A short A++ setup forms when the four core requirements of the IFVG Model occur and at least two additional confluences are present. Price must sweep a Buyside Liquidity level, form a valid V shape recovery, and create a bearish IFVG. The setup must also include any two or three of the following: a bearish HTF FVG tap, a multi-buyside liquidity sweep, or the IFVG confirmation forming inside a macro window.
For a confirmed short A++ signal, the indicator marks:
Entry: At the candle close that creates the bearish IFVG
Stop Loss: At the nearest swing high
Breakeven: Midpoint between entry and stop-loss
Take Profit 1: At the second nearest swing low
Take Profit 2: At the third nearest swing low
In this example, price sweeps a swing high, has a V shape recovery, taps a bearish 30-minute HTF FVG during the liquidity sweep, and forms a bearish IFVG inside of the 09:50-10:10 macro:
🔹Signal Settings
◇ Liquidity Levels Used:
Users can select which type of liquidity levels the indicator uses for identifying liquidity sweeps:
Swing Points: Only uses Swing Highs/Lows
Session Highs/Lows: Only uses Session Highs/Lows
Both: Uses both Swing Highs/Lows and Session Highs/Lows
◇ Bias:
This setting determines which signal directions are allowed.
Manual Bias: Users can manually choose the directional bias, picking between Bullish, Bearish, or Both.
Automatic Bias: The indicator automatically determines a directional bias based on the criteria mentioned in the previous Bias section.
◇ IFVG Sensitivity:
This setting determines the minimum gap size required for an FVG to qualify as an Inversion FVG.
Higher values: only larger FVGs become IFVGs
Lower values: smaller gaps are allowed
◇ Use First Presented IFVG:
This setting determines whether the indicator limits signals to only the first IFVG created within the manipulation leg.
What Is the First Presented IFVG?
It is the earliest FVG formed inside the displacement that causes the liquidity sweep.
For a bearish manipulation leg (price moving downward into the sweep), the first presented IFVG is the first FVG created at the start of that downward move:
For a bullish manipulation leg (price moving upward into the sweep), the first presented IFVG is the first FVG created at the start of that upward move:
When this setting is enabled, the indicator will only confirm signals when the IFVG used is derived from this first presented FVG. IFVGs that form later in the manipulation leg are not used for signal generation.
◇ Only Take Trades:
This setting allows users to restrict signals to a defined time window.
If a complete setup occurs inside the time window, it is allowed and plotted
If it occurs outside the window, the signal will not appear
For example, if you only wanted to see long/short signals between 9:30 AM and 12:00 PM, you would enable this setting and set the time window from 09:30 - 12:00.
◇ Minimum R:R
This setting allows users to require a minimum risk-to-reward ratio before a signal is confirmed and plotted on the chart. The risk-to-reward ratio is calculated using the distance from the Entry to the Stop-Loss (risk) and the distance from the Entry to TP2 (reward). The indicator compares these distances and determines whether the setup meets or exceeds the minimum R:R value selected by the user.
If the calculated R:R is equal to or greater than the chosen threshold, the signal will be displayed.
If the calculated R:R is lower than the threshold, the signal will not appear on the chart.
🔹 Signal Rating Minimum
Users can restrict which signal ratings appear:
A: shows all signals
A+: shows only A+ and A++
A++: shows only A++ setups
🔹 Signal Styling and Customization
The indicator provides full control over how signal labels and levels appear on your chart. Users can customize long signals, short signals, all plotted lines, and the visibility of every individual element.
◇ Long Signal Styling
Users can customize:
Long Signal Label Color
Long Signal Text Color
Long Signal Label Size
◇ Short Signal Styling
Users can customize:
Short Signal Label Color
Short Signal Text Color
Short Signal Label Size
◇ Entry, Stop Loss, Breakeven, and Take Profit Lines
Each line type can be enabled or disabled individually:
Entry Line
Stop Loss Line
Breakeven Line
Take Profit 1 & 2 Lines
Users can also set custom colors for each line so every level is easy to track during live price movement.
◇ Show Price Labels
Price labels can be toggled on or off individually for each level. Users can choose whether to show or hide the price for:
Entry
Stop loss
Breakeven
Take Profit 1 & 2
NEW DAY OPENING GAP:
The New Day Opening Gap (NDOG) highlights the price difference between the previous day’s closing candle and the first candle of the new trading day. The indicator tracks this gap automatically each day and makes it available as optional context for users.
🔹 What Is the New Day Opening Gap?
A New Day Opening Gap forms when the trading day opens at a price different from the previous day’s final closing price.
If the new day opens above the prior day’s close → Bullish NDOG
If the new day opens below the prior day’s close → Bearish NDOG
This gap acts as a short-term draw on liquidity because the market may revisit the gap to rebalance price delivery. While the NDOG is not a required component for IFVG signals.
🔹 How the Indicator Uses the New Day Opening Gap
When enabled, the indicator plots the gap as a rectangular zone spanning from the previous day’s close to the new day’s open. The zone remains active until it is fully filled by price or until the next day’s opening gap forms. Once price trades through the entire gap, or once a new NDOG replaces it the following day, the zone becomes inactive and is removed from the chart. The indicator does not use the NDOG for signal generation. It is strictly a visual tool that helps traders identify areas where price may retrace or seek liquidity during the session.
🔹 Customization Options
Users have full control over how the New Day Opening Gap displays on the chart:
Show New Day Opening Gap: Toggle the NDOG zone on or off
Bullish NDOG Color: Customize the fill color for gaps formed above the prior close
Bearish NDOG Color: Customize the fill color for gaps formed below the prior close
NEW WEEK OPENING GAP:
The New Week Opening Gap (NWOG) highlights the price difference between the previous week’s final closing candle and the first candle of the new trading week. The indicator tracks this gap automatically each week and provides it as optional context for users.
🔹 What Is the New Week Opening Gap?
A New Week Opening Gap forms when the new trading week opens at a price different from the previous week’s closing price.
If the new week opens above the prior week’s close → Bullish NWOG
If the new week opens below the prior week’s close → Bearish NWOG
This gap often serves as a medium-term draw on liquidity because price may return to rebalance the weekly displacement. The NWOG is not a required component for IFVG signals.
🔹 How the Indicator Uses the New Week Opening Gap
When enabled, the indicator plots the gap as a rectangular zone spanning from the previous week’s close to the new week’s open. The zone remains active until it is fully filled by price or until the next week’s opening gap forms. Once price trades through the entire gap, or once a new NWOG replaces it the following week, the zone becomes inactive and is removed from the chart. The indicator does not use the NWOG for signal generation. It is purely a visual reference to help traders identify areas where price may rebalance or seek liquidity during the week.
🔹 Customization Options
Users have full control over how the New Week Opening Gap displays on the chart:
Show New Week Opening Gap: Toggle the NWOG zone on or off
Bullish NWOG Color: Set the fill color for gaps formed above the prior weekly close
Bearish NWOG Color: Set the fill color for gaps formed below the prior weekly close
SMT DIVERGENCES:
The indicator automatically marks SMT Divergences that occur between the current selected chart ticker and a second user-selected ticker.
A SMT Divergence forms when the prices of the currently selected chart ticker and the user-selected ticker don’t follow each other. For example, if the current chart’s ticker symbol is SEED_ALEXDRAYM_SHORTINTEREST2:NQ and the user-selected ticker is $ES. If SEED_ALEXDRAYM_SHORTINTEREST2:NQ does not sweep the low of the NY AM Session, but NYSE:ES sweeps that same exact session’s low during the same candle, then a SMT Divergence is detected.
In the images below, SEED_ALEXDRAYM_SHORTINTEREST2:NQ and NYSE:ES form a low at 12:20 AM on November 12th. At 12:35 AM, the 12:20 AM low is taken out on $NQ. However, on NYSE:ES , price failed to take out this exact low at 12:35 AM. Thus, an SMT Divergence is detected, and a line is drawn between the two lows on $NQ.
NYSE:ES Chart:
SEED_ALEXDRAYM_SHORTINTEREST2:NQ Chart:
🔹 SMT Divergence Settings
The indicator includes settings that allow users to control how SMT Divergences are detected and displayed.
◇ Length
Length controls how sensitive the pivot detection is when finding highs and lows for SMT.
Lower Length: confirms swings with fewer bars, so more swings qualify.
Higher Length: requires more bars to confirm a swing, so fewer swings qualify.
◇ Divergence Length
The Divergence Length setting defines how many bars apart the two swing points may be for them to count as part of the same SMT Divergence.
Higher Values: The two instruments can form their swing highs or lows farther apart in time. As long as both swings occur within this wider bar window, the indicator compares them for divergence.
Lower Values: The two swing points must occur very close to each other.
◇ Show Last
This setting limits how many recent SMT Divergences are displayed on the chart. For example, setting Show Last to 1 will only show the most recent SMT Divergence, while higher values allow more historical SMT Divergences to remain visible on the chart.
◇ Divergence Ticker
Users can change the ticker used for detections. Since SMT Divergences occur by comparing two tickers, the inputted ticker within the settings will always be compared to the current selected ticker on your chart.
DASHBOARD:
The dashboard provides a live summary of all major components of the Inversion Fair Value Gap Model. It updates every candle and displays the current state of each requirement used in the setup logic.
🔹 Real-Time Model Components
The state of each component is displayed with the following:
✔️ = condition is satisfied
❌ = condition is not satisfied
🐂 / 🐻 = current directional bias (bullish or bearish)
The dashboard actively tracks the following:
◇ Bias (🐂 Bullish, 🐻 Bearish, or Both)
Shows the current bias with a bull or bear emoji. If using automatic bias, the dashboard updates as soon as the session logic determines a direction.
◇ Liquidity Sweep
Displays ✔️ once a valid BSL Sweep (for shorts) or SSL Sweep (for longs) is detected.
Shows ❌ when no sweep is present.
◇ V Shape Recovery
Displays ✔️ when a confirmed V shape recovery forms after the sweep.
Shows ❌ until a valid V shape appears.
◇ Inversion Fair Value Gap (IFVG)
Shows ✔️ once a bullish or bearish IFVG forms in the correct direction.
Shows ❌ when no IFVG has yet confirmed.
◇ Higher-Timeframe FVG Interaction
Displays ✔️ when price is currently inside any enabled HTF FVG or taps a HTF FVG during a liquidity sweep.
Displays ❌ when price is not inside a HTF imbalance.
◇ Clear Opposite Draw on Liquidity (DOL)
Shows ✔️ when a clear opposite-side draw is present in the model logic.
Shows ❌ if no clear opposite draw is detected.
◇ SMT Divergence
Shows ✔️ for 20 candles immediately after an SMT Divergence forms.
After 20 candles, it returns to ❌ unless a new SMT Divergence is detected.
🔹 Signal Information Display
When a valid long or short signal appears, the dashboard expands to show the full details of the setup, including:
Signal Rating
Entry Price
Stop-Loss Price
Breakeven Price
Take Profit 1 Price
Take Profit 2 Price
🔹 Trade Statistics Module
Users can enable a built-in statistics panel to view historical performance of signals across all ratings. The trade stats include:
A Signal Win Rate
A+ Signal Win Rate
A++ Signal Win Rate
Long Signal Win Rate
Short Signal Win Rate
Total Number of Trades Used in the Calculations
A trade is counted as a win if price reaches breakeven before stop-loss. A trade is counted as a loss if price hits stop-loss before breakeven.
🔹 Dashboard Customization
The dashboard includes several options to control its appearance and position:
Show Dashboard: Toggle the entire dashboard on or off
Dashboard Size: Choose the size of the dashboard
Dashboard Position: Choose the location of the dashboard on the chart
Trade Stats Text Color: Customize the color of the 2nd column outputs under the Trade Stats section in the dashboard
◇ Component Toggles
Users can enable or disable the display of any model component based on preference. Each of these items can be shown or hidden independently:
Setup Rating
Entry
Stop-Loss
Breakeven
Take Profit 1
Take Profit 2
Bias
Liquidity Sweep
Higher-Timeframe FVG Interaction
V Shape Recovery
Inversion FVG
Clear Opposite Draw on Liquidity
Trade Stats
These toggles only affect visual display. Disabling any of them does not affect the underlying indicator’s logic.
ALERTS:
The Inversion Fair Value Gap Model includes full alert functionality using AnyAlert(), allowing users to receive notifications in real time for all major model components and signal events.
Users can enable or disable each alert type in the “Alerts” section of the settings. After selecting which alerts they want active, they can create a single TradingView alert using the AnyAlert() condition. This will automatically trigger alerts for all enabled events as soon as they occur on the chart.
Available Alerts:
Long Signal
Short Signal
Breakeven Hit (BE)
Take Profit 1 Hit (TP1)
Take Profit 2 Hit (TP2)
Stop-Loss Hit (SL)
Liquidity Sweep Detected
SMT Divergence Detected
How to Receive Alerts:
Open the TradingView alert creation window.
Select the IFVG Model indicator as the alert condition.
Choose AnyAlert() from the condition dropdown.
Create the alert.
IMPORTANT NOTES:
TradingView has limitations when running features on multiple timeframes such as the HTF FVGs, which can result in the following restriction:
Computation Error:
The computation of using MTF features is very intensive on TradingView. This can sometimes cause calculation timeouts. When this occurs, simply force the recalculation by modifying one indicator’s settings or by removing the indicator and adding it to your chart again.
UNIQUENESS:
This indicator is unique because it organizes every part of the Inversion Fair Value Gap Model into one structured, rules based system. It detects liquidity sweeps, confirms V shape recoveries, identifies valid IFVGs, checks higher timeframe FVG taps, reads macro timing, and applies a session based directional bias. All of these components are evaluated in a fixed sequence so users always know exactly why a signal appears. Every part of the logic is customizable, including which liquidity types are used, which IFVGs qualify for signals, which time windows allow trades, the minimum risk to reward for a setup, and all visual elements on the chart. The tool also includes optional SMT Divergence detection, daily and weekly opening gaps, a live dashboard that shows the state of each model requirement, and optional signal performance statistics.

ILM & IFVG StrategyPlease feel free to adjust in any way possible. Let me know if you can create something better from this initial coding.
//═══════════════════════════════════════════════════════════════════════
// Inverted Liquidity Model (ILM) – Strategy
//═══════════════════════════════════════════════════════════════════════
//
// The **Inverted Liquidity Model (ILM)** is a liquidity-based algorithm
// built to capture high-probability reversals after:
//
// • A liquidity sweep (SSL/BSL taken)
// • Rejection back inside the range
// • A Fair Value Gap (FVG) forms
// • That FVG becomes invalidated → becomes an IFVG entry zone
//
// ILM combines:
// • LTF BOS / CHOCH structure confirmation
// • HTF structure (expansion) filtering
// • Premium / Discount filter (17:00 CST session midline)
// • Optional ATR volatility filter
// • Optional trading session restrictions
// • Optional partial profit-taking + runners
//
// When all conditions align, the strategy enters:
// ✔ Long after sweep of SSL + valid long IFVG + trend confirmation
// ✔ Short after sweep of BSL + valid short IFVG + trend confirmation
//
// Stops are placed at the sweep wick.
// Full target is set at the next structural high/low.
// Optional partial TP sends a runner to full target.
//
// Visual tools (labels, sweep lines, IFVG boxes, midline) assist
// with review and forward testing.
//
//───────────────────────────────────────────────────────────────────────
// USER CONFIGURABLE FEATURES
//───────────────────────────────────────────────────────────────────────
//
// • **Liquidity & Structure**
// - pivotLen → swing length for pivots / liquidity
// - htfOn → toggle higher-timeframe pivots
// - htfTF → timeframe for HTF structure/liquidity
// - useStructureFilter → enforce LTF BOS/CHOCH trend
// - useHtfExpansionFilter → enforce HTF trend
// - showStructureLabels → show BOS/CHOCH labels
// - showHtfStructureLabels → show HTF BOS/CHOCH labels
//
// • **Premium / Discount Midline**
// - usePremiumDiscountFilter → only long in discount / short in premium
// - pdSession → session used for midline (default 17:00 CST)
// - showPdMidLine → show 50% midline
//
// • **FVG / IFVG Detection**
// - useBodyGapFVG → FVG uses candle bodies instead of wicks
// - useDisplacementFVG → require displacement bar
// - dispAtrMult → minimum ATR threshold for displacement
// - showIFVG → draw IFVG boxes
//
// • **ATR / Volatility / Sessions**
// - useRangeFilter → require minimum ATR%
// - atrLen → ATR period
// - minAtrPerc → minimum ATR% of price
// - useSessionFilter → restrict trading hours
// - sessionTimes → allowed trading session
//
// • **Sweep Visualization**
// - showSweepLines → draw sweep lines at SSL/BSL sweeps
// - sweepLineWidth → thickness of sweep lines
//
// • **Exits: Partial Targets & Runners**
// - usePartialTargets → enable partial TP logic
// - tp1QtyPercent → percent closed at TP1
// - tp1FractionOfPath → TP1 relative to path to full target
//
// • **Formatting / Visibility**
// - labelFontSizeInput → tiny / small / normal / large / huge
// - showEntries → entry markers
// - showTargets → target lines
//
//═══════════════════════════════════════════════════════════════════════
// END OF STRATEGY DESCRIPTION
//═══════════════════════════════════════════════════════════════════════


SMC FVG/IFVG (Multi-TF x 4) [ZAUTEC]SMC FVG/IFVG (Multi-TF x 4): Multi-Timeframe Fair Value Gap with Inversed FVG Detection
This powerful Pine Script indicator is designed to help traders identify, track, and manage Fair Value Gaps (FVGs) and their respective Inversed Fair Value Gaps (IFVGs) across up to four different timeframes simultaneously.
Key Features
Multi-Timeframe Analysis (4x): Analyze and display FVGs from four distinct timeframes alongside your current chart, offering a comprehensive view of market imbalances across various scales.
Fair Value Gap (FVG) Detection: Automatically identifies classic three-candle FVGs (market inefficiencies).
Customizable FVG Length: Set how many bars the FVG boxes should initially extend for.
Minimum Gap Size: Filter out minor, insignificant gaps using a tick-based minimum size threshold.
Optional Box Extension: Dynamically extend FVG boxes to the current bar index or use a fixed extension for a cleaner chart.
Inversed FVG (IFVG) Logic: Detects a high-probability reversal pattern where a previously filled FVG zone is immediately followed by the formation of a new, opposite FVG within or adjacent to the same area. This confirms the old FVG has "flipped roles" (e.g., from support to resistance).
Lookback Period: Defines how long the indicator searches for a corresponding FVG breach to confirm the IFVG.
IFVG Minimum Size: Customizable minimum size threshold for the IFVG.
Dynamic Box Management:
Automatic Fill Deletion: FVGs are automatically removed from the chart when price action fully trades through the gap, signifying the imbalance has been "filled."
IFVG Tracking: IFVGs are tracked and removed from the chart after the configurable lookback period.
Full Customization: Control the visibility, colors, border styles (solid, dashed, dotted), and width for FVG, Bearish FVG, Bullish FVG, and IFVG boxes independently for each of the four timeframes.
How to Use
Select Timeframes: Choose up to four desired timeframes in the settings (e.g., "15" for 15-minute, "4H" for 4-hour, "D" for Daily). Leave the field empty to use the chart's current timeframe.
Toggle Visibility: Use the Show FVG and Show IFVG toggles to focus on the imbalances you wish to see.
Adjust Extension: Set Extend Boxes to bar index to true to keep all open FVG boxes drawn all the way to the current live price bar.
Interpret the Gaps:
FVG (Bullish/Bearish): Potential areas for price to return to and find support/resistance.
IFVG (Inverse FVG): Stronger signals that a previous zone of imbalance has been violated and is likely to act as a significant flip zone for future price movements.
This indicator is an essential tool for traders utilizing concepts like ICT (Inner Circle Trader) and SMC (Smart Money Concepts), providing a clear visual representation of market structure and liquidity voids.

My setup [Pro] (fadi)My Setup is a powerful TradingView indicator that visualizes your trading strategy, helping you find high-probability setups with precision and discipline. It combines Higher Timeframe (HTF) context with Lower Timeframe (LTF) entries on a single chart, streamlining your trading process.
What It Does
Tracks your chosen timeframe and its paired higher timeframe for custom trade setups, so you don’t have to stay glued to the screen.
Plots clear Entry, Stop Loss, and Take Profit levels when your conditions align.
Customizes to your strategy with HTF triggers (e.g., sweeps, liquidity grabs) and LTF entries (e.g., Order Blocks, FVGs, Breakers).
Ensures discipline by only showing setups that meet all your rules, eliminating emotional trading and FOMO.
Backtest your edge by visualizing past setups to refine entries, stops, and confluences.
How It Works
Set Your HTF Trigger: Choose a market event like a sweep of a high/low, pivot point, or liquidity grab on the paired higher timeframe (e.g., 1H for a 5m chart).
Define Your LTF Entry: Select your entry model from a range of institutional concepts, such as Order Block, Fair Value Gap (FVG), Inverted FVG (iFVG), Breaker Block, Unicorn Model, and more, on the chart’s timeframe.
Add Confluence Filters: Stack conditions like requiring an FVG + Breaker for higher-probability setups.
See It on Your Chart: When a setup forms, it’s instantly plotted with Entry, Stop Loss, and Take Profit levels based on your Risk-to-Reward ratio.
Key Features
Multi-Timeframe Sync: Pair your chart’s timeframe (e.g., 5m) with a higher timeframe (e.g., 1H) for seamless analysis.
Institutional Tools: Supports a comprehensive suite of ICT concepts, including Order Blocks, FVGs, iFVGs, Breakers, Unicorn Model, and additional entry models.
Custom Risk Management: Set your Stop Loss and Take Profit levels with fixed R:R or measured moves using large range of entry and stop levels.
Session Filtering: Limit setups to specific trading sessions (e.g., London, New York) with timezone support.
Visual Clarity: Displays HTF candles and key levels on your chart for context, with customizable colors and styles.
Alerts: Get notified the moment a valid setup appears, even on live candles.
Who It’s For
Traders who want to systematize their ICT-based strategy on a single chart.
Those seeking to trade with discipline and avoid impulsive decisions.
Anyone looking to backtest and optimize their setups with clear, visual feedback.
Busy traders who need a tool to track their chart while they focus on life.
Why Choose My Setup ?
Save Time: Let the indicator track your chart and its paired timeframe.
Trade Confidently: Only take A+ setups that match your exact rules.
Learn and Improve: Analyze historical setups to refine your strategy.
Disclaimer of Warranties and Limitation of Liability for [My Setup ]
Please read this disclaimer carefully before using the [My Setup ] indicator (hereafter referred to as "the Software").
1. No Financial Advice
The Software is provided for educational and informational purposes only. The data, calculations, and signals generated by the Software are not, and should not be interpreted as, financial advice, investment advice, trading advice, or a recommendation or solicitation to buy, sell, or hold any security or financial instrument.
2. Assumption of Risk You acknowledge that trading and investing are inherently risky activities that carry a high potential for significant financial loss. All actions you take in the market, including but not limited to trade execution and risk management, are your sole responsibility. You agree to use the Software at your own sole risk. The creator shall not be held responsible or liable for any financial losses or damages you may incur as a result of using the Software.
3. No Warranty; "AS IS" Provision
The Software is provided "AS IS" and "AS AVAILABLE", without any warranties of any kind, either express or implied. The creator disclaims all warranties, including, but not limited to, implied warranties of merchantability, fitness for a particular purpose, accuracy, timeliness, completeness, and non-infringement.
The creator does not warrant that the Software will be error-free, uninterrupted, secure, or free of bugs, viruses, or other harmful components. You acknowledge that software is never wholly free from defects, and you are responsible for implementing your own procedures for data accuracy and security.
4. Limitation of Liability
TO THE MAXIMUM EXTENT PERMITTED BY APPLICABLE LAW, IN NO EVENT SHALL THE CREATOR, FADI ZEIDAN, BE LIABLE FOR ANY CLAIM, DAMAGES, OR OTHER LIABILITY, WHETHER IN AN ACTION OF CONTRACT, TORT, OR OTHERWISE, ARISING FROM, OUT OF, OR IN CONNECTION WITH THE SOFTWARE OR THE USE OR OTHER DEALINGS IN THE SOFTWARE.
This limitation of liability applies to any and all damages, including but not limited to:
Direct, indirect, incidental, special, consequential, or exemplary damages.
Loss of profits, revenue, data, or use.
Financial losses resulting from trading decisions made based on the Software.
Damages arising from software defects, interruptions, or inaccuracies.
5. Indemnification
You agree to indemnify, defend, and hold harmless the creator, Fadi Zeidan, from and against any and all claims, liabilities, damages, losses, or expenses, including reasonable attorneys' fees and costs, arising out of or in any way connected with your access to or use of the Software.
6. Acknowledgment and Agreement
By accessing, installing, or using the [My Setup ] indicator, you acknowledge that you have read, understood, and agree to be bound by the terms of this disclaimer. If you do not agree with these terms, you must not use the Software.
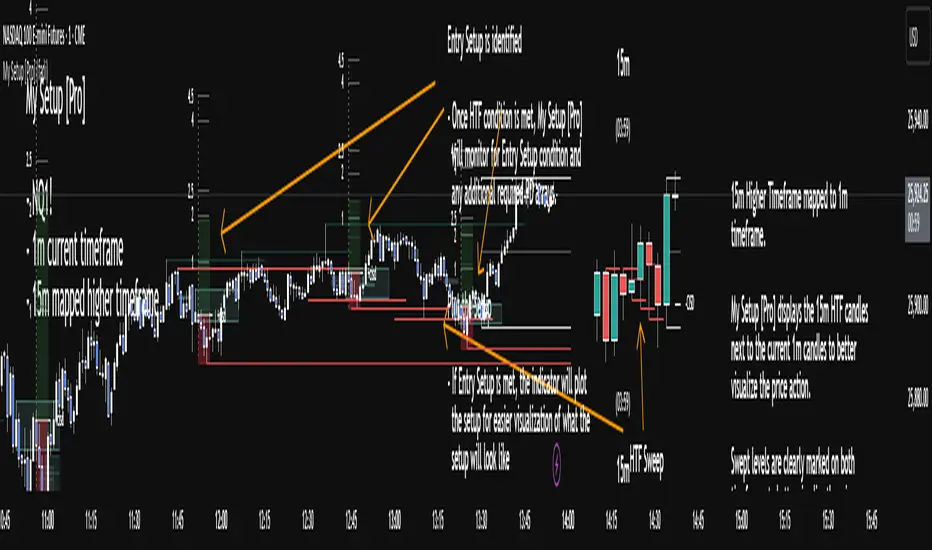
Killzones SMT + IFVG detectorKillzones SMT + IFVG Detector
Summary
This strategy implements a specific intraday workflow inspired by ICT-style concepts.
It combines:
Killzone session levels (recording untouched highs/lows)
SMT divergence between NQ and ES (exclusive sweep logic)
IFVG confirmation (3-bar imbalance + width filter + inversion guard)
and an optional smart exit engine
The components are not simply mashed together: they interact in sequence.
A setup only confirms if all conditions line up (time window → untouched level sweep → divergence → valid IFVG → confirmation candle → risk filter).
Workflow
Killzones & session levels
Tracks highs/lows inside default killzones (19:00–23:00, 01:00–04:00, 08:30–10:00, 11:00–12:00, 12:30–15:00, chart timezone).
Stores untouched levels forward; sweeps trigger candidate signals.
SMT divergence (exclusive sweep)
Bullish SMT : one index sweeps its low while the other remains above its session low.
Bearish SMT : one index sweeps its high while the other remains below its session high.
Detection supports “Sweep (Cross)” or “Exact Tick.”
Session IDs are tracked so once a side has fired, later re-touches can’t re-trigger .
IFVG confirmation
Locks the first valid 3-bar IFVG after SMT.
Confirmation requires a candle close beyond the IFVG boundary in the direction of the close.
IFVGs must meet a minimum width filter (default 1.0 point).
Inversion guard: ignores IFVGs already inverted before SMT.
Optional “re-lock” keeps tracking the latest IFVG until confirmation/expiry.
Smart exit engine
Initial stop from opposite wick (+ buffer).
Fixed TP (default 40 points).
Dynamic stop escalation at progress thresholds (BE → 50% → 80% of target).
Safety gates
Weekend lockout (Fri 16:40 → Sun 18:00).
Same-bar sweep of high & low cancels setups.
Max initial stop filter skips oversized setups.
Optional cooldown bars.
Alerts
SMT Bullish/Bearish : divergence detected this bar.
Confirm Long/Short : IFVG confirmation triggered.
Default Strategy Properties (used in screenshots/backtests)
Initial capital: $25,000
Order size: 1 contract
Commission: $1.25 per contract per side
Slippage: 2 ticks
Backtest window: Jun 16, 2025 – Sep 14, 2025
These settings are intentionally conservative. If you change them, your results will differ.
How to use
Apply on an NQ or ES futures chart (1–5 min).
Choose your killzones and detection mode.
Select confirmation symbol (NQ, ES, or “Sweeper”).
Enable/disable IFVG re-lock.
Review signals and use alerts for automation if desired.
Limitations
Strict filters reduce trade count; extend backtest window for more samples.
Works best on NQ/ES; not validated elsewhere.
Past performance is not indicative of future results.
This is an educational tool ; not financial advice.

CHart_This FVGThis script will work on any time frame, and auto plots the classic ICT "fair value gaps", or imbalances, that result from a three candle formation wherein the middle candle body extends beyond the highs and lows of the end candles, leaving no overlap of the first and last candle wicks. Bullish imbalances are green, and bearish are red. Plotted zones will automatically close once a candle closure fully violates the imbalance zone with a close beyond its borders.
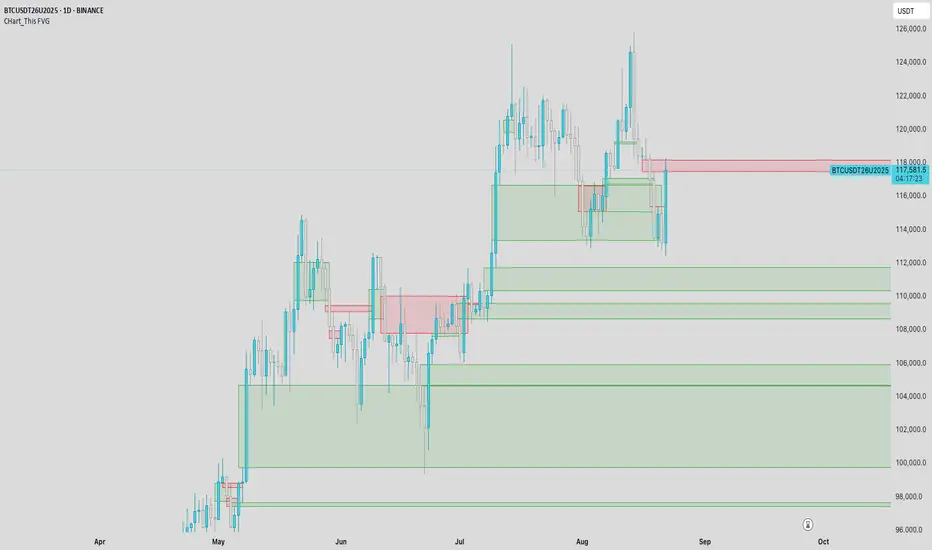
IFVG by Toño# IFVG by Toño - Pine Script Indicator
## Overview
This Pine Script indicator identifies and visualizes **Fair Value Gaps (FVG)** and **Inverted Fair Value Gaps (IFVG)** on trading charts. It provides advanced analysis of price inefficiencies and their subsequent inversions when mitigated.
## Key Features
### 1. Fair Value Gap (FVG) Detection
- **Bullish FVG**: Detected when `low > high ` (gap between current low and high of 2 bars ago)
- **Bearish FVG**: Detected when `high < low ` (gap between current high and low of 2 bars ago)
- Visual representation using colored rectangles (green for bullish, red for bearish)
### 2. Inverted Fair Value Gap (IFVG) Creation
- **IFVG Formation**: When a FVG gets mitigated (price fills the gap with candle body), an IFVG is created
- **Color Inversion**: The IFVG takes the opposite color of the original FVG
- Mitigated bullish FVG → Creates red (bearish) IFVG
- Mitigated bearish FVG → Creates green (bullish) IFVG
- **Mitigation Logic**: Uses only candle body (not wicks) to determine when a FVG is filled
### 3. Customizable Display Options
- **Show Normal FVG**: Toggle visibility of regular Fair Value Gaps
- **Show IFVG**: Toggle visibility of Inverted Fair Value Gaps
- **Smart FVG Display**: Even when "Show Normal FVG" is disabled, FVGs that are part of IFVGs remain visible
- **Extension Control**: Option to extend FVGs until they are mitigated
### 4. IFVG Extension Methods
- **Full Cross Method**: IFVG remains active until price completely crosses through it (including wicks)
- **Number of Bars Method**: IFVG remains active for a specified number of bars (1-100)
### 5. Visual Mitigation Signals
- **Cross Markers**: Shows X-shaped markers when IFVGs are mitigated
- Green cross above bar: Bearish IFVG mitigated
- Red cross below bar: Bullish IFVG mitigated
### 6. Comprehensive Alert System
- **IFVG Formation Alerts**: Notifications when new IFVGs are created
- **IFVG Mitigation Alerts**: Notifications when IFVGs are filled/mitigated
- **Separate Controls**: Individual toggles for bullish and bearish IFVG alerts
## How It Works
### Step-by-Step Process:
1. **FVG Detection**: Script continuously scans for 3-bar patterns that create price gaps
2. **FVG Tracking**: Each FVG is stored with its coordinates, type, and status
3. **Mitigation Monitoring**: Script watches for candle bodies that fill the FVG
4. **IFVG Creation**: Upon mitigation, creates an IFVG with opposite polarity at the same location
5. **IFVG Management**: Tracks and extends IFVGs according to chosen method
6. **Visual Updates**: Dynamically updates colors and visibility based on user settings
## Use Cases
- **Support/Resistance Analysis**: IFVGs often act as strong support/resistance levels
- **Market Structure Understanding**: Helps identify how market inefficiencies get filled and reversed
- **Entry/Exit Timing**: Can be used to time entries around IFVG formations or mitigations
- **Confluence Analysis**: Combine with other technical analysis tools for stronger signals
## Configuration Parameters
- **Colors**: Customizable colors for bullish/bearish FVGs and IFVGs
- **Extension**: Choose how long to display gaps on the chart
- **Alerts**: Full control over notification preferences
- **Visual Clarity**: Options to show/hide different gap types for cleaner charts
## Technical Specifications
- **Pine Script Version**: 5
- **Overlay**: True (displays directly on price chart)
- **Max Boxes**: 500 (supports up to 500 simultaneous gaps)
- **Performance**: Optimized array management for smooth operation
This indicator is particularly valuable for traders who use **Smart Money Concepts (SMC)** and **Inner Circle Trader (ICT)** methodologies, as it provides clear visualization of how institutional order flow creates and fills market inefficiencies.

IFVG ExtendedThis indicator identifies and visualizes "Imbalance Fair Value Gaps" (IFVGs) on a price chart. It highlights these gaps, tracks their evolution, and signals when they are "filled" or "invalidated" by price action. The script is quite advanced, using custom types, arrays, and dynamic drawing.
1. Types and Variables
Custom Types:
lab: Stores label information (x, y, direction).
fvg: Stores Fair Value Gap data, including its boundaries, direction, state, labels, and other properties.
Arrays:
Four arrays track bullish and bearish FVGs, and their "invalidated" (filled) versions.
Signals:
Boolean variables to store if a bullish or bearish signal is triggered.
2. User Inputs and Parameters
Display Settings:
How many recent FVGs to show, signal preference (close or wick), ATR multiplier for gap size filtering, and colors for bullish/bearish/midline.
3. Chart Data
Price Data:
Open, high, low, close, and ATR (Average True Range) are stored for use in calculations.
4. Functions
label_maker:
Draws an up or down arrow label at a given point, colored for bullish or bearish.
fvg_manage:
Checks if any FVGs in the array have been "invalidated" (i.e., price has crossed their boundary). If so, moves them to the invalidated array.
inv_manage:
Manages invalidated FVGs, checking if a signal should be fired (i.e., price has reacted to the gap). Also removes old FVGs.
send_it:
Draws the FVGs and their labels on the chart, using boxes and lines for visualization.
5. Main Logic and Visualization
FVG Detection:
On each bar, checks for new bullish or bearish FVGs based on price action and ATR filter.
Adds new FVGs to the appropriate array.
FVG Management:
Updates the arrays, moves invalidated FVGs, and checks for signals.
Drawing:
On the last bar, clears all previous drawings and redraws the current FVGs and their labels.
6. Alerts
Alert Conditions:
Sets up alerts for when a bullish or bearish IFVG signal is triggered, so users can be notified.
Summary
In short:
This script automatically finds and tracks "Imbalance Fair Value Gaps" on your chart, highlights them, and alerts you when price interacts with them in a significant way. It uses advanced Pine Script features to manage and visualize these zones dynamically, helping traders spot potential reversal or continuation points based on gap theory

iFVG (BPR)
This indicator detects Fair Value Gaps (FVGs) and Inversion Zones (iFVGs) based concept from the ICT methodology.
An iFVG forms when a bullish and a bearish FVG overlap, creating a double imbalance zone. These are high-reaction points often targeted by smart money.
🔷 What It Detects
Bullish FVG: When the high of Candle 1 is lower than the low of Candle 3
Bearish FVG: When the low of Candle 1 is higher than the high of Candle 3
iFVG (or BPR): When a bullish and bearish FVG overlap, forming a double imbalance zone
🔷Mitigation Logic
An FVG or BPR becomes an iFVG when price closes against its original bias Once this happens, the zone is reclassified as a potential support or resistance (iFVG)
If price later mitigates the iFVG, all visual elements are automatically removed to keep the chart clean
🔷Visual Output
Standard FVGs: Customizable lines between Candle 1 and Candle 3
iFVGs (mitigated BPRs): Adjustable and highlighted rectangles to show the full zone
Mitigation Type: FVG or iFVG zones disappear when 50% of the zone is reached
🔷Custom Settings
Show Last Zones: Set how many recent zones to display on the chart (max 100)
Mitigation Type: Based on the percentage of zone coverage
Color & Style: Customize the appearance of FVG and iFVG zones
🔷 Use Case
This indicator is designed for real-time institutional analysis, helping traders identify:
Recent imbalances (FVGs)
Confluence zones (iFVGs = BPRs)
High-reaction points in the market
Ideal when combined with market structure, liquidity levels, and Kill Zones
Best used in combination with market structure, liquidity zones, and Kill Zone timing .

[T] FVG Size MarkerThis scripts marks the size of the FVG on the chart. As well as lets you place custom text based on gap size. Custom text lets you overlay contract size risk based on the gap size.

Time-Based Fair Value Gaps (FVG) with Inversions (iFVG)Overview
The Time-Based Fair Value Gaps (FVG) with Inversions (iFVG) (ICT/SMT) indicator is a specialized tool designed for traders using Inner Circle Trader (ICT) methodologies. Inspired by LuxAlgo's Fair Value Gap indicator, this script introduces significant enhancements by integrating ICT principles, focusing on precise time-based FVG detection, inversion tracking, and retest signals tailored for institutional trading strategies. Unlike LuxAlgo’s general FVG approach, this indicator filters FVGs within customizable 10-minute windows aligned with ICT’s macro timeframes and incorporates ICT-specific concepts like mitigation, liquidity grabs, and session-based gap prioritization.
This tool is optimized for 1–5 minute charts, though probably best for 1 minute charts, identifying bullish and bearish FVGs, tracking their mitigation into inverted FVGs (iFVGs) as key support/resistance zones, and generating retest signals with customizable “Close” or “Wick” confirmation. Features like ATR-based filtering, optional FVG labels, mitigation removal, and session-specific FVG detection (e.g., first FVG in AM/PM sessions) make it a powerful tool for ICT traders.
Originality and Improvements
While inspired by LuxAlgo’s FVG indicator (credit to LuxAlgo for their foundational work), this script significantly extends the original concept by:
1. Time-Based FVG Detection: Unlike LuxAlgo’s continuous FVG identification, this script filters FVGs within user-defined 10-minute windows each hour (:00–:10, :10–:20, etc.), aligning with ICT’s emphasis on specific periods of institutional activity, such as hourly opens/closes or kill zones (e.g., New York 7:00–11:00 AM EST). This ensures FVGs are relevant to high-probability ICT setups.
2. Session-Specific First FVG Option: A unique feature allows traders to display only the first FVG in ICT-defined AM (9:30–10:00 AM EST) or PM (1:30–2:00 PM EST) sessions, reflecting ICT’s focus on initial market imbalances during key liquidity events.
3. ICT-Driven Mitigation and Inversion Logic: The script tracks FVG mitigation (when price closes through a gap) and converts mitigated FVGs into iFVGs, which serve as ICT-style support/resistance zones. This aligns with ICT’s view that mitigated gaps become critical reversal points, unlike LuxAlgo’s simpler gap display.
4. Customizable Retest Signals: Retest signals for iFVGs are configurable for “Close” (conservative, requiring candle body confirmation) or “Wick” (faster, using highs/lows), catering to ICT traders’ need for precise entry timing during liquidity grabs or Judas swings.
5. ATR Filtering and Mitigation Removal: An optional ATR filter ensures only significant FVGs are displayed, reducing noise, while mitigation removal declutters the chart by removing filled gaps, aligning with ICT’s principle that mitigated gaps lose relevance unless inverted.
6. Timezone and Timeframe Safeguards: A timezone offset setting aligns FVG detection with EST for ICT’s New York-centric strategies, and a timeframe warning alerts users to avoid ≥1-hour charts, ensuring accuracy in time-based filtering.
These enhancements make the script a distinct tool that builds on LuxAlgo’s foundation while offering ICT traders a tailored, high-precision solution.
How It Works
FVG Detection
FVGs are identified when a candle’s low is higher than the high of two candles prior (bullish FVG) or a candle’s high is lower than the low of two candles prior (bearish FVG). Detection is restricted to:
• User-selected 10-minute windows (e.g., :00–:10, :50–:60) to capture ICT-relevant periods like hourly transitions.
• AM/PM session first FVGs (if enabled), focusing on 9:30–10:00 AM or 1:30–2:00 PM EST for key market opens.
An optional ATR filter (default: 0.25× ATR) ensures only gaps larger than the threshold are displayed, prioritizing significant imbalances.
Mitigation and Inversion
When price closes through an FVG (e.g., below a bullish FVG’s bottom), the FVG is mitigated and becomes an iFVG, plotted as a support/resistance zone. iFVGs are critical in ICT for identifying reversal points where institutional orders accumulate.
Retest Signals
The script generates signals when price retests an iFVG:
• Close: Triggers when the candle body confirms the retest (conservative, lower noise).
• Wick: Triggers when the candle’s high/low touches the iFVG (faster, higher sensitivity). Signals are visualized with triangular markers (▲ for bullish, ▼ for bearish) and can trigger alerts.
Visualization
• FVGs: Displayed as colored boxes (green for bullish, red for bearish) with optional “Bull FVG”/“Bear FVG” labels.
• iFVGs: Shown as extended boxes with dashed midlines, limited to the user-defined number of recent zones (default: 5).
• Mitigation Removal: Mitigated FVGs/iFVGs are removed (if enabled) to keep the chart clean.
How to Use
Recommended Settings
• Timeframe: Use 1–5 minute charts for precision, avoiding ≥1-hour timeframes (a warning label appears if misconfigured).
• Time Windows: Enable :00–:10 and :50–:60 for hourly open/close FVGs, or use the “Show only 1st presented FVG” option for AM/PM session focus.
• ATR Filter: Keep enabled (multiplier 0.25–0.5) for significant gaps; disable on 1-minute charts for more FVGs during volatility.
• Signal Preference: Use “Close” for conservative entries, “Wick” for aggressive setups.
• Timezone Offset: Set to -5 for EST (or -4 for EDT) to align with ICT’s New York session.
Trading Strategy
1. Macro Timeframes: Focus on New York (7:00–11:00 AM EST) or London (2:00–5:00 AM EST) kill zones for high institutional activity.
2. FVG Entries: Trade bullish FVGs as support in uptrends or bearish FVGs as resistance in downtrends, especially in :00–:10 or :50–:60 windows.
3. iFVG Retests: Enter on retest signals (▲/▼) during liquidity grabs or Judas swings, using “Close” for confirmation or “Wick” for speed.
4. Session FVGs: Use the “Show only 1st presented FVG” option to target the first gap in AM/PM sessions, often tied to ICT’s market maker algorithms.
5. Risk Management: Combine with ICT concepts like order blocks or breaker blocks for confluence, and set stops beyond FVG/iFVG boundaries.
Alerts
Set alerts for:
• “Bullish FVG Detected”/“Bearish FVG Detected”: New FVGs in selected windows.
• “Bullish Signal”/“Bearish Signal”: iFVG retest confirmations.
Settings Description
• Show Last (1–100, default: 5): Number of recent iFVGs to display. Lower values reduce clutter.
• Show only 1st presented FVG : Limits FVGs to the first in 9:30–10:00 AM or 1:30–2:00 PM EST sessions (overrides time window checkboxes).
• Time Window Checkboxes: Enable/disable FVG detection in 10-minute windows (:00–:10, :10–:20, etc.). All enabled by default.
• Signal Preference: “Close” (default) or “Wick” for iFVG retest signals.
• Use ATR Filter: Enables ATR-based size filtering (default: true).
• ATR Multiplier (0–∞, default: 0.25): Sets FVG size threshold (higher values = larger gaps).
• Remove Mitigated FVGs: Removes filled FVGs/iFVGs (default: true).
• Show FVG Labels: Displays “Bull FVG”/“Bear FVG” labels (default: true).
• Timezone Offset (-12 to 12, default: -5): Aligns time windows with EST.
• Colors: Customize bullish (green), bearish (red), and midline (gray) colors.
Why Use This Indicator?
This indicator empowers ICT traders with a tool that goes beyond generic FVG detection, offering precise, time-filtered gaps and inversion tracking aligned with institutional trading principles. By focusing on ICT’s macro timeframes, session-specific imbalances, and customizable signal logic, it provides a clear edge for scalping, swing trading, or reversal setups in high-liquidity markets.

Smarter Money Concepts - MTF IFVGs [PhenLabs]📊 Smarter Money Concepts - MTF IFVG
Version: PineScript™ v6
📌 Description
This multi-timeframe indicator identifies Inverse Fair Value Gaps (IFVGs) and their inversions across simultaneous chart intervals, helping traders spot liquidity voids and potential reversal zones. By analyzing price action through the lens of institutional order flow patterns, it solves the problem of manual gap tracking across timeframes while incorporating volatility-adjusted parameters and psychological level analysis for higher-probability setups.
🚀 Points of Innovation
• Multi-Timeframe Engine - Simultaneous analysis of 3 higher timeframes
• Adaptive Parameters - Auto-adjusts to market volatility conditions
• Quality Scoring System - Ranks gaps using RVI strength and size metrics
• Inversion Tracking - Monitors failed gaps for counter-trend signals
• Render Optimization - Prevents chart clutter with smart gap management
🔧 Core Components
FVG Detection Logic: Identifies gaps using customizable price source (Close/Wick)
Inversion Tracker: Manages failed gaps and generates counter signals
Multi-Timeframe Engine: Processes 3 independent higher timeframe analyses
Dashboard System: Real-time display of active gaps across all timeframes
🔥 Key Features
• Volatility-adjusted gap size filters (ATR-based)
• Customizable timeframe confluence analysis
• Color-coded quality scoring
• Non-repainting inversion signals
• Mobile-optimized visual rendering
🎨 Visualization
• Colored Boxes: Translucent zones show active gaps (green/bullish, red/bearish)
• Midline Plot: Dashed gray line marks gap midpoint for price targets
• Inversion Markers: Intense colors show failed gaps (dark red/bullish failure, bright green/bearish failure)
• HTF Differentiation: Higher timeframe gaps shown in blue/teal hues
📖 Usage Guidelines
Multi-Timeframe Settings
• Higher Timeframe 1
Default: 30 | Range: Any > Chart TF | Controls primary confluence timeframe
• Show All Timeframes
Default: True | Toggles multi-TF gap displays
Gap Settings
• Source
Default: Close | Options: | Determines gap measurement method
• RVI Period
Default: 14 | Range: 1-50 | Sets momentum confirmation sensitivity
• RVI Value
Default 0.1 | 0 to see all IFVGs | Increase min RVI to see the most powerful IFVGs
✅ Best Use Cases
• Identifying confluence across timeframes
• Spotting institutional order blocks
• High-probability reversal trading
• Trend continuation confirmation
• Volatility breakout setups
⚠️ Limitations
• Repaints historical gap zones
• Requires understanding of FVG concepts
• Higher timeframe data latency
• Quality scores rely on RVI/ATR settings
💡 What Makes This Unique
First FVG indicator with true multi-timeframe processing
Adaptive parameters that auto-adjust to volatility
Quantifiable quality scoring system
Professional-grade dashboard with HTF tracking
🔬 How It Works
Gap Detection: Identifies FVGs using price relationships and RVI confirmation
Inversion Tracking: Monitors price breaches to flag failed gaps
Quality Assessment: Scores gaps based on size, momentum, and location
Adaptive Filtering: Adjusts parameters using ATR-based volatility analysis
Multi-TF Synthesis: Correlates gaps across user-selected timeframes
Visual Rendering: Displays only relevant, active gaps to prevent clutter
💡 Note:
Start with default settings and gradually adjust parameters after observing market interactions. Focus on gaps with quality scores above 7 that align with higher timeframe trends. Combine with price action at psychological levels for highest-probability setups. Remember that higher timeframe gaps generally carry more significance than current chart gaps.

[TehThomas] - ICT Inversion Fair value Gap (IFVG) The Inversion Fair Value Gap (IFVG) indicator is a powerful tool designed for traders who utilize ICT (Inner Circle Trader) strategies. It focuses on identifying and displaying Inversion Fair Value Gaps, which are critical zones that emerge when traditional Fair Value Gaps (FVGs) are invalidated by price action. These gaps represent key areas where price often reacts, making them essential for identifying potential reversals, trend continuations, and liquidity zones.
What Are Inversion Fair Value Gaps?
Inversion Fair Value Gaps occur when price revisits a traditional FVG and breaks through it, effectively flipping its role in the market. For example:
A bullish FVG that is invalidated becomes a bearish zone, often acting as resistance.
A bearish FVG that is invalidated transforms into a bullish zone, serving as support.
These gaps are significant because they often align with institutional trading activity. They highlight areas where large orders have been executed or where liquidity has been targeted. Understanding these gaps provides traders with a deeper insight into market structure and helps them anticipate future price movements with greater accuracy.
Why This Strategy Works
The IFVG concept is rooted in ICT principles, which emphasize liquidity dynamics, market inefficiencies, and institutional order flow. Traditional FVGs represent imbalances in price action caused by gaps between candles. When these gaps are invalidated, they become inversion zones that can act as magnets for price. These zones frequently serve as high-probability areas for price reversals or trend continuations.
This strategy works because it aligns with how institutional traders operate. Inversion gaps often mark areas of interest for "smart money," making them reliable indicators of potential market turning points. By focusing on these zones, traders can align their strategies with institutional behavior and improve their overall trading edge.
How the Indicator Works
This indicator simplifies the process of identifying and tracking IFVGs by automating their detection and visualization on the chart. It scans the chart in real-time to identify bullish and bearish FVGs that meet user-defined thresholds for inversion. Once identified, these gaps are dynamically displayed on the chart with distinct colors for bullish and bearish zones.
The indicator also tracks whether these gaps are mitigated or broken by price action. When an IFVG is broken, it extends the zone for a user-defined number of bars to visualize its potential role as a new support or resistance level. Additionally, alerts can be enabled to notify traders when new IFVGs form or when existing ones are broken, ensuring timely decision-making in fast-moving markets.
Key Features
Automatic Detection: The indicator automatically identifies bullish and bearish IFVGs based on user-defined thresholds.
Dynamic Visualization: It displays IFVGs directly on the chart with customizable colors for easy differentiation.
Real-Time Updates: The status of each IFVG is updated dynamically based on price action.
Zone Extensions: Broken IFVGs are extended to visualize their potential as support or resistance levels.
Alerts: Notifications can be set up to alert traders when key events occur, such as the formation or breaking of an IFVG.
These features make the tool highly efficient and reduce the need for manual analysis, allowing traders to focus on execution rather than tedious chart work.
Benefits of Using This Indicator
The IFVG indicator offers several advantages that make it an indispensable tool for ICT traders. By automating the detection of inversion gaps, it saves time and reduces errors in analysis. The clearly defined zones improve risk management by providing precise entry points, stop-loss levels, and profit targets based on market structure.
This tool is also highly versatile and adapts seamlessly across different timeframes. Whether you’re scalping lower timeframes or swing trading higher ones, it provides actionable insights tailored to your trading style. Furthermore, by aligning your strategy with institutional logic, you gain a significant edge in anticipating market movements.
Practical Applications
This indicator can be used across various trading styles:
Scalping: Identify quick reversal points on lower timeframes using real-time alerts.
Day Trading: Use inversion gaps as key levels for intraday support/resistance or trend continuation setups.
Swing Trading: Analyse higher timeframes to identify major inversion zones that could act as critical turning points in larger trends.
By integrating this tool into your trading routine, you can streamline your analysis process and focus on executing high-probability setups.
Conclusion
The Inversion Fair Value Gap (IFVG) indicator is more than just a technical analysis tool—it’s a strategic ally for traders looking to refine their edge in the markets. By automating the detection and tracking of inversion gaps based on ICT principles, it simplifies complex market analysis while maintaining accuracy and depth. Whether you’re new to ICT strategies or an experienced trader seeking greater precision, this indicator will elevate your trading game by aligning your approach with institutional behavior.
If you’re serious about improving your trading results while saving time and effort, this tool is an essential addition to your toolkit. It provides clarity in chaotic markets, enhances precision in trade execution, and ensures you never miss critical opportunities in your trading journey.
__________________________________________
Thanks for your support!
If you found this idea helpful or learned something new, drop a like 👍 and leave a comment, I’d love to hear your thoughts! 🚀
Make sure to follow me for more price action insights, free indicators, and trading strategies. Let’s grow and trade smarter together! 📈
