Psychological levels (Bank levels) PsychoLevels v2 - TartigradiaPsychological levels (Bank levels) plots "round" price levels above and below current price, by truncating after the nth leftmost digits, based on neuroscience research of how humans intuitively calculate in logarithms.
Psychological levels, also called bank levels, are "round" price numbers around which price often experience resistance or support, because traders and investors tend to set orders around these round numbers.
Calculation here is fully automatic and dynamic, contrary to other similar scripts, this one uses a mathematical calculation that extracts the 1, 2 or 3 leftmost digits and calculate the previous and next level by incrementing/decrementing these digits. This means it works for any symbol under any price range.
This approach is based on neuroscience research, which found that human brains intuitively approximate numbers on a logarithmic scale, adults and children alike, and similarly to macaques, for more info see Numerical Cognition , Weber-Fechner Law , Zipf law.
For example, if price is at 0.0421, the next major price level is 0.05 and medium one is 0.043. For another asset currently priced at 19354, the next and previous major price levels are 20000 and 10000 respectively, and the next/previous medium levels are 20000 and 19000, and the next/previous weak levels are 19400 and 19300.
Usage:
* By default, strong upper level is in green, strong lower level is in red, medium upper level is in blue, medium lower level is in yellow, and weak levels aren't displayed but can be. Half levels are also displayed, in a darker color. Strong levels are increments of the first leftmost digit (eg, 10000 to 20000), medium levels are increments of the second leftmost digit (eg, 19000 to 20000), and weak levels of the third leftmost digit (eg, 19100 to 19200). Instead of plotting all the psychological levels all at once as a grid, which makes the chart unintelligible, here the levels adapt dynamically around the current price, so that they show the upper/lower levels relatively to the current price.
* A simple moving average is implemented, so that "half-levels" are also displayed when relevant (eg, medium level can also display 19500 instead of only 19000 or 20000). This can be disabled by setting smoothing to 1.
* By default, the script runs on the daily timeframe, whatever the current chart's timeframe is. This is to reduce the variability in levels, to make it less noisy than intraday price movement, but this can be changed in the settings.
* The step can be adjusted to increase the gap between levels, eg, if you want to display one every 2 levels then input step = 2 (eg, 22000, 24000, 26000, etc), or if you want to display quarter levels, input 0.25 (eg, 22000, 22250, 22500, etc). The default values should fit most use cases and cover most psychological levels.
I made this script mainly to train with PineScript, but I found it surprisingly accurate to define levels that are respected by price movements. So I guess it can be useful for new traders and experienced traders alike, as it's easy to forget that psychological levels can often be as strong if not stronger than technical levels. It can also be used to quickly screen other minor assets for trading opportunities. For example, a hybrid strategy would be to manually define levels on BTCUSD but using this script to automatically define levels in crypto altcoins and quickly screen them for a trade opportunity that can be greater than with BTCUSD but with the same trend.
Changes compared to v1:
* Deduplicated redundant calculations and hence faster script.
* Added half-step levels, which allows to more easily see breakouts (because the levels are still on-screen).
* All steps are now configuration on the GUI.
* Revamped color scheme.
* And major reasons to post as a separate v2 script rather than updating: because we can't update the original description nor screenshot. I have now read more about the House Rules and saw other scriptmakers, so I am trying to write better descriptions like wizards do, by explaining not only how the script works but what the underlying financial concept is to a neophyte audience.
Level

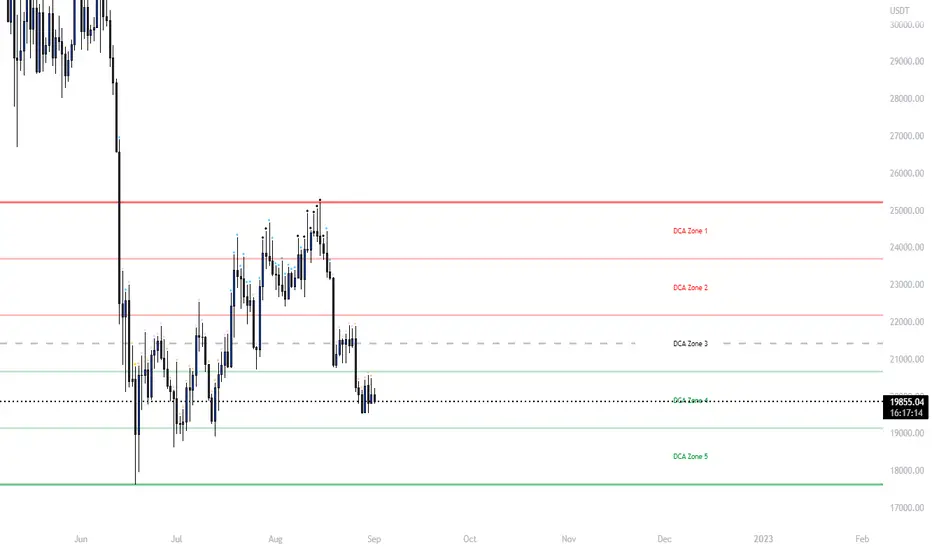
Ultimate Grid Tool + Alerts (DCA & Limit Orders) [enzedengineer]Overview
The "Ultimate Grid Tool + Alerts" script works much like a grid bot from automated trading services such as 3Commas making it a good free alternative with some extra utility.
How it works
The user is prompted to set up a grid by manually defining a lower and upper range and then by selecting how many grid segments they want (max 20). The script will automatically create equally spaced grids within this defined range. The script has built in alerts which are intended to be used in conjunction with a third-party application to execute buy and sell orders on an exchange.
The script has two alert functionalities to choose between:
Limit orders (like traditional grid bots) or;
DCA zones (time-based)
DCA zones:
This is the default selection. Each zone has its own alert condition which is triggered if the price closes within that zone. The frequency of the alert is determined by the user's chart resolution, therefore you can have the alert trigger every day, or 4 hours, or 30 minutes and so on. This allows for flexibility, for example, you could go from DCA'ing at $20 per day at higher prices to $100 per day as the price drops into the lower end of your grid range.
Limit orders:
This mode is selected by checking the "Limit Order" box. As mentioned earlier, this mode works like traditional grid bots with each grid line representing a limit order. The alert condition is met when ta.cross(close, gridline) = true.
Buy and Sell:
This mode is selected by checking the "Buy and Sell" box. This is a visual modification only which changes the colour of the grids to help plan the user's trading. Please note, there is no buying or selling logic within the script itself - this should be built into the alert message to be used with a third-party application for exchange order execution.
Use case: The author of this script has been using it with the default settings to DCA into Bitcoin in the current bear market. Using a chart resolution of 15 minutes the script purchases x-amount of Bitcoin every 15 minutes (Alertatron executes the exchange orders). This method provides a well blended average price and takes away the internal conundrum of "should I buy some today". No matter what, the bot will make a purchase within at least 15 minutes of the ultimate Bitcoin bottom and arguably this gives a psychological edge and reduces FOMO (fear of missing out).
Previous Days RangesPrevious Days Ranges
Simply plots out market ranges of previous days price action, of which are the following:
Previous Day High
Previous Day Low
Previous Day Extended High
Previous Day Extended Low
Supports adjustments of timeframes, for different time zones, and style.

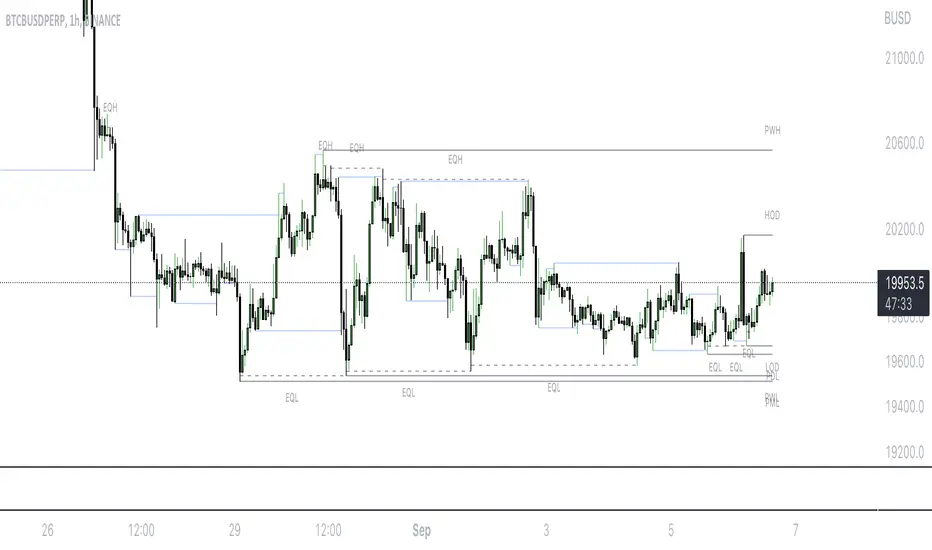
Mark LevelsMark Levels is marking liquidity pools by drawing lines on their pivots and labelling them so that you can instantly detect them on your realtime chart
It supports:
- marking previous and current day lows and highs
- marking previous and current week lows and highs
- marking previous and current month lows and highs
- marking equal lows and highs
technically it re-builds them on the last bar or as soon as new realtime bar is updated. it looks with 1k bars back to find higher timeframe ranges and find lows and highs there
Adjustments:
- changing the line style of the group
- changing the lines color and the labels on the groups
- currently pools are split on 2 groups Period Liquidity and Equal Pivots Liquidity.
Unraided Liquidity and S/R PivotsThis indicator is designed to show key pivot points, also known as levels, which could provide good trade entries.
Utilising liquidity concepts, untested pivot levels can be a good place to enter a trade after the pivot is tested, liquidity is taken and the direction reverses.
Alternatively, utilising the option of viewing already tested levels, you can easily see the key support and resistance areas that price is likely to have a strong reaction to, whether it wants to go toward or bounce away from these levels.
The indicator does not give buy and sell signals, it is up to you to use the levels to form your trading plan.
Oorah.

Auto Round levels by Script051This indicator is designed to show psychological levels/round levels.
The difference between this version and the others is that :
It will automatically show round levels for each symbol you select without having to enter "tick value" manually.
Settings
Gap : If the value is equal to zero, the round levels will be found automatically, but if you change the value, the gap between the lines will be adjusted based on the value you specified.
X2 and /2 : doubles or halves the distance between round lines
Number of lines : Specifies the number of lines to be displayed

Grid Settings & MMThis script is designed to help you plan your grid trading or when averaging your position in the spot market.
The script has a small error (due to the simplification of the code), it does not take into account the size of the commission.
You can set any values on all parameters on any timeframe, except for the number of orders in the grid (from 2 to 5).
The usage algorithm is quite simple:
1. Connect the script
2. Install a Fibo grid on the chart - optional (settings at the bottom of the description)
3.On the selected pair, determine the HighPrice & LowPrice levels and insert their values
4.Evaluate grid data (levels, estimated profit ’%’, possible profit ‘$’...)
And it's all)
Block of variables for calculating grid and MM parameters
Variables used regularly
--- HighPrice and LowPrice - constant update when changing pairs
--- Deposit - deposit amount - periodically set the actual amount
Variables that do not require permanent changes
--- Grids - set the planned number of grids, default 5
--- Steps - the planned number of orders in the grid, by default 5
--- C_Order - coefficient of increasing the size of orders in the base coin, by default 1.2
--- C_Price - trading levels offset coefficient, default 1.1
--- FirstLevel - location of the first buy level, default 0.5
--- Back_HL - number of candles back, default 150
*** For C_Order and C_Price variables, the value 1 means the same order size and the same distance between buy levels.
The fibo grid is used for visualization, you can do without it, ! it is not tied to the script code !
You can calculate the levels of the Fibo grid using the formula:
(level price - minimum price) / (maximum price - minimum price)
For default values, grid levels are as follows:
1 ... 0.5
2...0.359
3 ... 0.211
4...0.0564
5...-0.1043
Short description:
in the upper right corner
--- indicator of the price movement for the last 150 candles, in % !!! there is no task here to "catch" the peak values - only a relative estimate.
in the upper left corner
--- total amount of the deposit
--- the planned number of grids
--- “cost” of one grid
--- the size of the estimated profit depending on the specified HighPrice & LowPrice
in the lower left corner
--- Buy - price levels for buy orders
--- Amount - the number of purchased coins in the corresponding order
--- Sell - levels of profit taking by the sum of market orders in the grid
--- $$$ - the sum of all orders in the grid, taking into account the last active order
--- TP - profit amount by the amount of orders in the grid

HarmonicDB█ OVERVIEW
This library was to showcase database for specifications of Harmonic Patterns using arrays.
█ CREDITS
Scott M Carney, author of Harmonic Trading : Volume Three
animal_db(x)
TODO: export animal_db
Parameters:
x : TODO: float value is set to default if not necessary
Returns: TODO:

Pivot Points Standard Higher Timeframe█ OVERVIEW
This indicator was intended as educational purpose only and alternative way to write pine script in version 5 for Pivot Points Standard.
█ CREDITS
Credits to TradingView for original built-in source code.
█ FEATURES
Display price or percentage.
Change color for labels and lines.
█ USAGE EXAMPLES

CRYPTO MARKET SESSION ANALYZER INDICATORCrypto Market Session Analyzer is an easy-to-use yet powerful analysis tool that helps the trader visualize and analyze price movements over three different trading sessions:
1) European Session
2) US session
3) Asian session
Automatically tracks the corresponding levels for each market session.
This indicator can be used on all timeframes equal to or less than 15 minutes.
Although this is a simple indicator to use, some care must be taken when using it. The trader must be careful to set the correct times for each session according to his UTC timezone. By default the indicator uses UTC. If your console is set to UTC + 2 for example, you will need to take this into account and align the times correctly. You can adjust the time for each session from the user interface. Following the example, if the opening of the UE session is set to 9 and UTC of your console is set to UTC + 2, the script will proceed to create the level at opening time 11.
HOW IT WORK
The indicator automatically draws a horizontal line at the open and a horizontal line at the close of each session. The indicator clears past support and resistance every 24 hours to provide a clean and easy-to-read chart, updating new levels session after session.
Blue indicates the EU session.
Orange indicates the US session.
Purple indicates the Asian session.

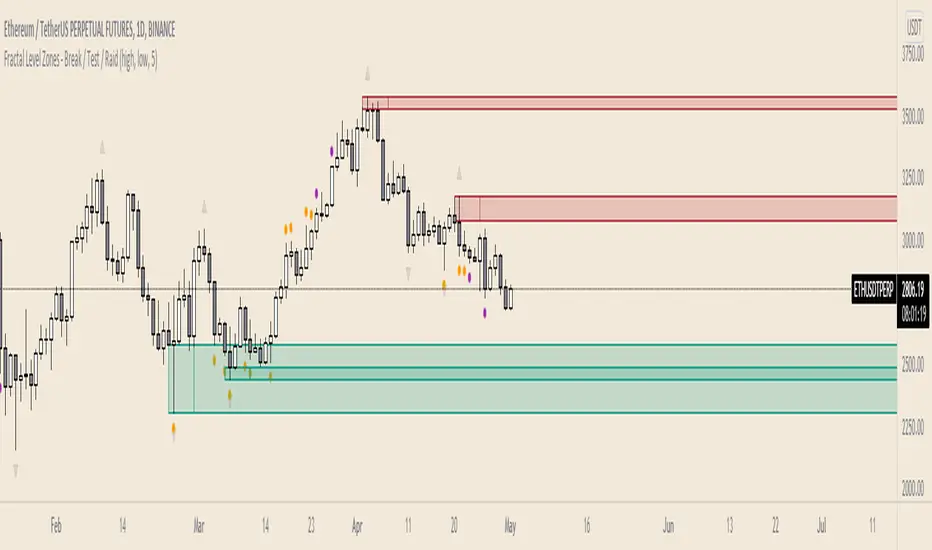
Fractal Level Zones - Break / Test / RaidFractal Level Zones - Break / Test / Raid
An experimental script that marks out the last two unbroken fractal high and low zones. The aim of the script is to focus on the type of candles that form and close in a zone. They can either tap into the zone or break them.
There are a number of outcomes:
- Break
- Break and retest
- Reversal
- Raid
When a zone is broken, the next untested fractal zone is printed.
How to use:
The indicator is to be used on higher time frames (M,W,D/4H). Monitor the type of candles that in form a zone (Daily TF recommended)
Default icon colours
Orange - Test of Zone
Purple - Break of fractal (can also be a raid)
Alert function included
Indicator in Use
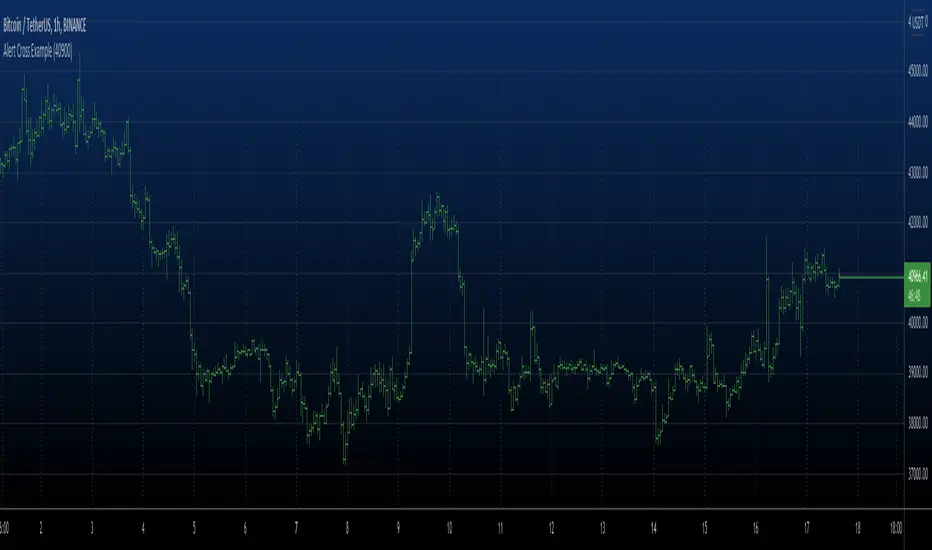
Alert Cross Example Alert example with set level.
Set level price in the input dialog and it will send
cross alerts
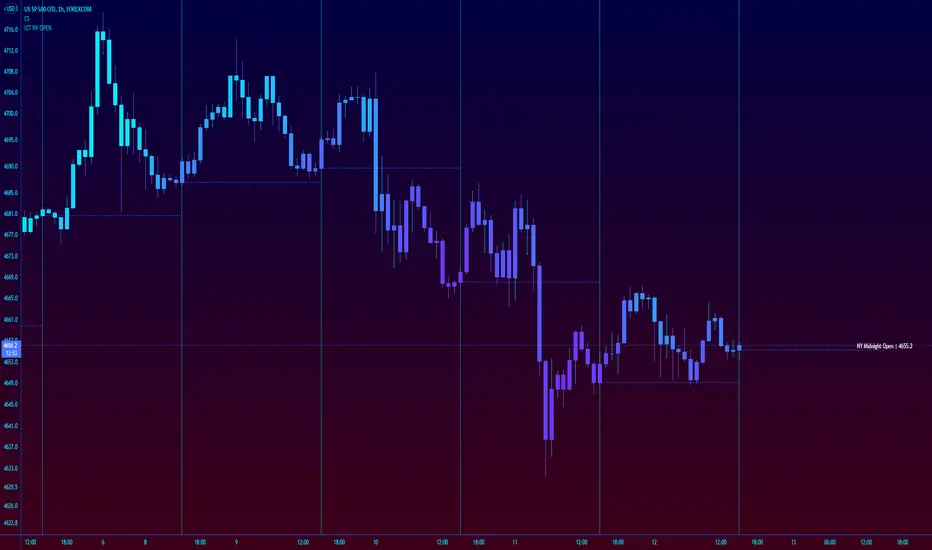
ICT New York NY Midnight Open and DividerThis simple indicator plots out ICT's New York midnight open price and a vertical divider at that time.
12am NY time is a key level to watch for daytrading and intraday scalping, often providing entry levels and orderblocks.
The session time may need to be adjusted for different exchanges, but the default is for most of forex.
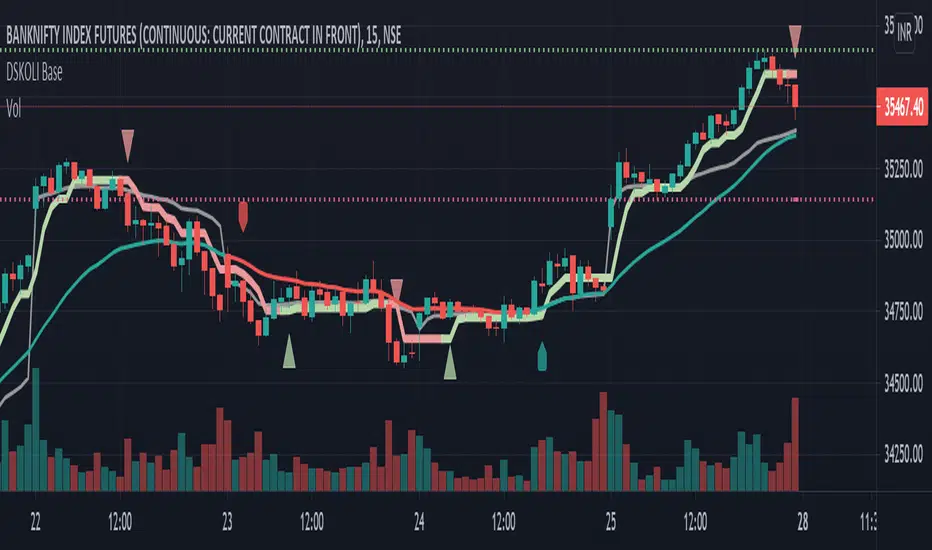
DSKOLI BaseThis helps to determine bullish or bearish trend of any chart on any time-frame and good to have for Intraday watch.
Details -
a. Label-Up/Down shows the recent price movement is getting bullish or bearish from zero/neutral base by comparing to previous few candles.
b. EMA line helps to know the price movement of candles are above or below the EMA and its coloured with red and green which even further helps to determine its existing trend.
c. A plot Trend line which is quite close to candles with red and green line and arrow is calculated from few candles' high and low values with some mathematical formulas which along EMA adds more value for trend identification.
d. Recent High/Low automatically plots support and resistance lines on basis of previous swing high or low. An alert is added for any these levels breakout or breakdown.
Note or Disclaimer:
1. This may be considered only for Watching as Learning and informational purpose.
2. Take advice from financial advisor before entering, holding, converting or exiting from any order or trade.
3. Always keep your acceptable stop-loss in all your transactions while trading or investing.
DSKOLI or TradingView reserves all right and don't hold any responsibilities for any loss/losses as well as accuracy of levels or price movement.
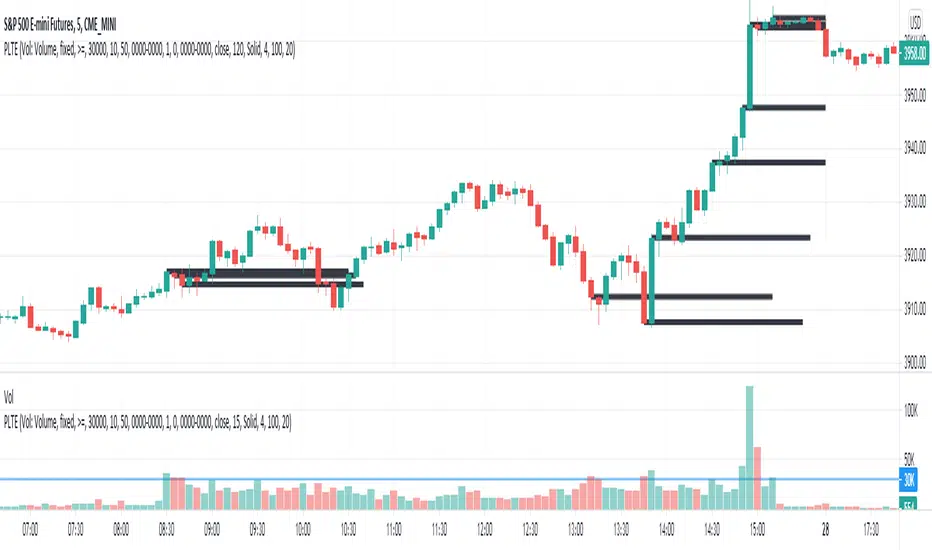
Plot Level on Threshold ExceedThis script plots a line for X minutes, when the given reference source (which could be another indicator like volume, etc), exceeds the fixed value threshold.
There is a line limit in TV, so only the most recent 40 lines are plotted

Silen's Pseudo VPVR / Pseudo Volume Profile Custom RangeDisclamer: This indicator does not use actual Volume data and doesn't display any Volume data. It creates a pseudo Volume Profile by counting the high-low-2 values of candles and simulates something that is similar to a Volume Profile without using any Volume data.
Core facts:
Creates a pseudo Volume Profile by counting values of candles and sorting them into a Profile.
Works for charts that don't provide any Volume Information.
Can display up to 5 different Value Levels.
Value level colors are (from largest to smallest level): Red, Orange, Yellow, Green, Blue.
The Value levels can be used as Support and Resistance indicators.
The Custom Range of the Volume Profile can be adjusted from 10 to 1500 bars.
Much faster than the other custom pseudo VPVRs out there.
Shortcomings:
As the chart progresses with bars the line positions will distort to the left side. Refreshing the tradingview page or switching to another time interval fixes this. I might fix this issue in the future.
Does not use actual Volume nor display actual Volume.
Note: For those who wondered what happened to my first version of this indicator: It got taken down by Tradingview because it was misleading as to using the words "Volume Profile" and "Visible Range". I fully support their decision and I hope I could clear any misunderstandings! Give their team a heads up for the hard work they're doing in keeping this place clean and well organized!
Enjoy! :)

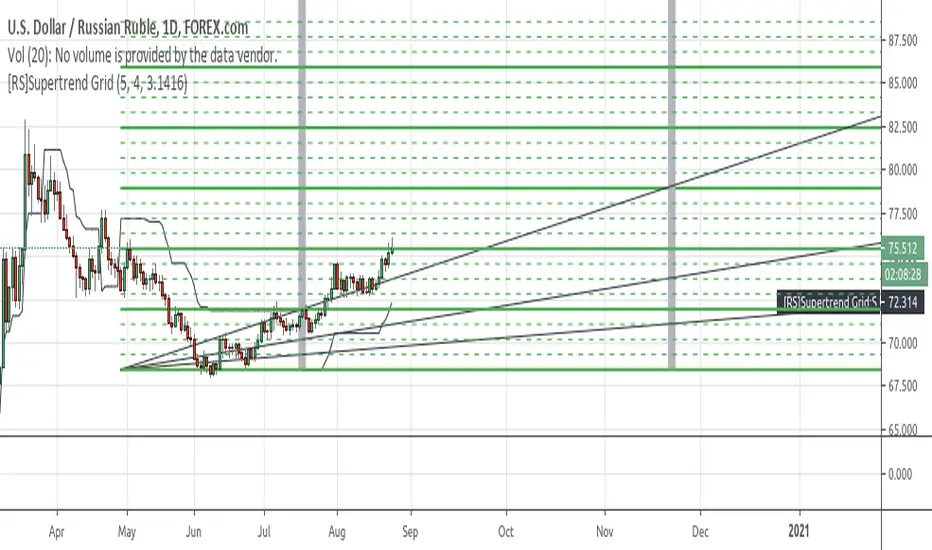
[RS]Supertrend GridDynamic grid system based on supertrend.
note: the input nlines/nfractions are not locked so if values too high might start overlapping line objects.
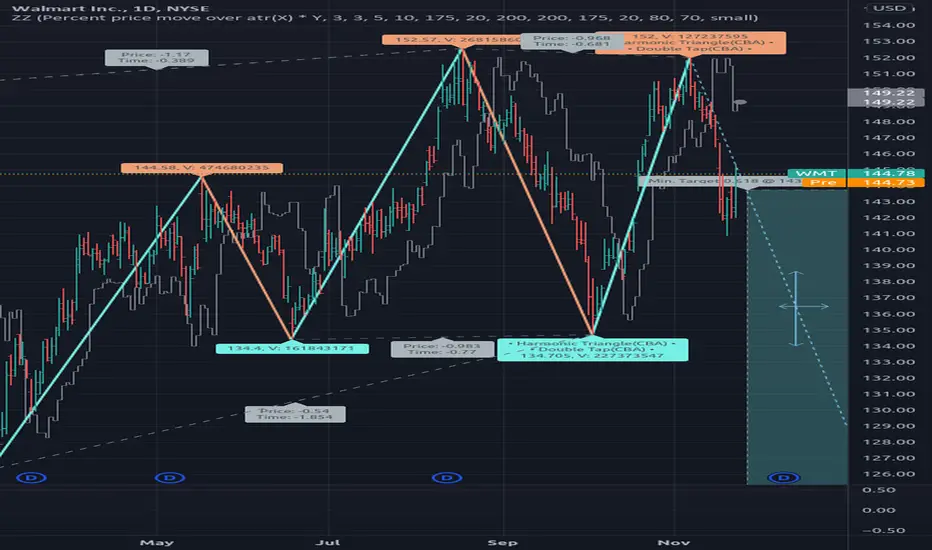
[RS]ZigZag Multiple Methods - Forecast - patterns - labelsexperimental:
zigzag indicator with all the zigzag methods that im aware of(that matter atleast), theres something for all tastes there :P
this will be the basis for zigzag tools i make in the future.
note: some zigzags REPAINT.
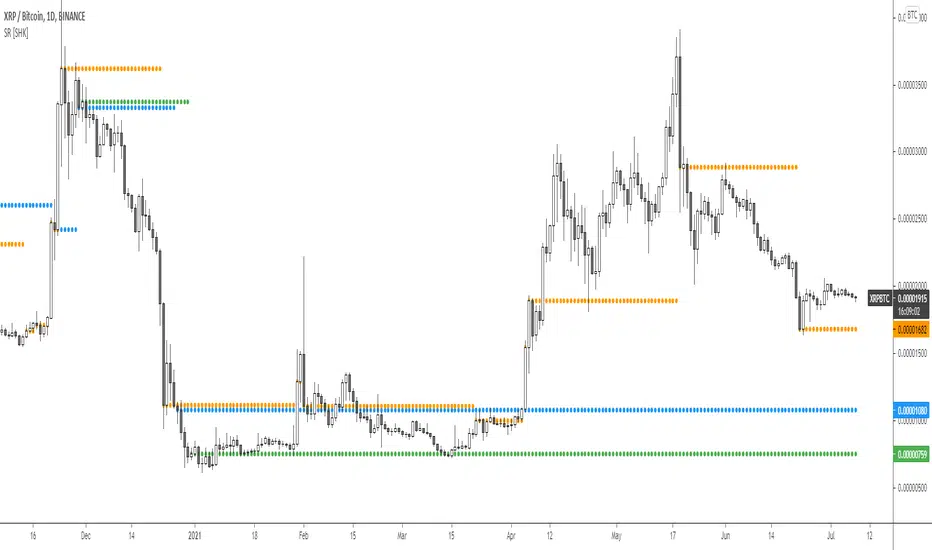
Support and Resistance MTF levels [SHK]A new way of drawing multi timeframe support and resistance !
This tool doesn't get the last high and lows, otherwise it tries to detect highly liquid levels with pending orders .
Share your opinion and result.
Enjoy!
Hidden Supports & Resistances + Round LevelsIf you search the internet, you won't find much about these types of resistance and support levels. Hidden levels are SnR levels calculated based on some psychological patterns and sometimes it's unbelievable that the chart responds to these levels.
So use the indicator and check the idea.

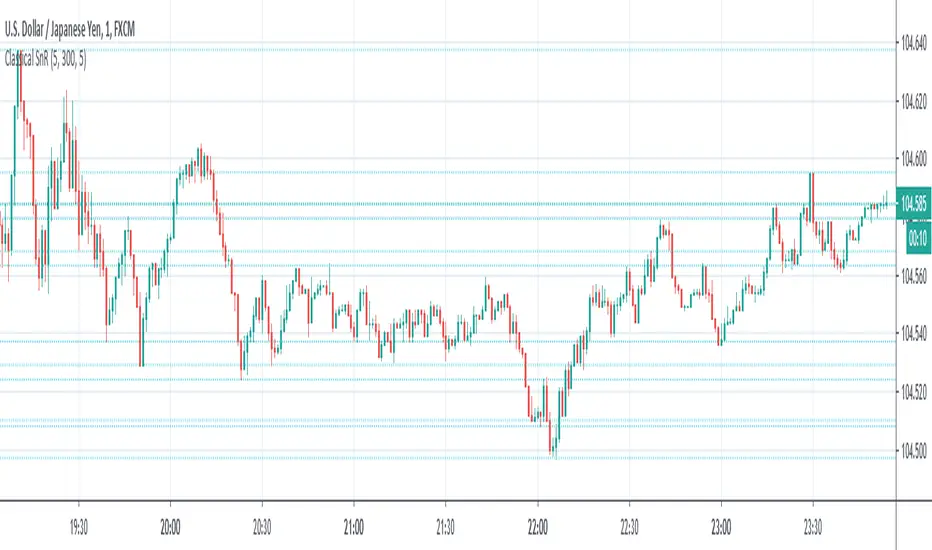
Classical Supports & ResistancesThis indicator shows classical resistance and support levels which retraced the chart lately. Notice that the condensed lines laying close together are showing an area of support and/or resistance.
But after all, it was a tedious work creating this indicator because like I've already said, pine script is a very odd and weak language which does not have many ordinary features like useful loops, simple line drawing and even reasonable variable casting!
So I was forced to use its built-in pivothigh() and pivotlow() functions without any handy documentation. I assume that even these functions don't work as expected, and because of that, I embedded "Sensitivity" and "Lookback Time" options in the indicator as a workaround.
Feel free to use it and send me your comments/solutions.
Levels - [Silver-Wong]Draw a line on the right with indicator of what is set :
- EMA
- WMA
- MA
- Ichimoku Tenkan
- Ichimoku Kijun
In all inportant EMAs and timeframes
- MA/EMA/WMA 13, 20, 50, 100, 200
- 1H, 4H, 12H, Daily, Weekly
