PRIME 2.0PRIME 2.0 — Precision Entry Tool
PRIME 2.0 is a smart price action-based indicator designed for intraday traders who want to catch high-probability moves during the London session. It uses a combination of market structure shifts (CHOCH – Change of Character) and session-based timing to identify potential entries.
🔍 Key Features:
Session-Based Logic: Activates after the London market opens, filtering noise from other sessions.
CHOCH Detection: Spots shifts in market structure by identifying crossover and crossunder of candle highs/lows.
Visual Entry Points: Plots real-time entry points based on structure change.
🧠 Who Is It For?
Scalpers and day traders
Traders who follow Smart Money Concepts (SMC)
Anyone looking to improve entry precision without clutter
⚠️ Disclaimer:
This indicator does not generate buy/sell signals or exit points. It is meant to be used as a tool within a broader trading strategy. Combine it with your own risk management and market knowledge for best results
Liquidity

Liquidity Stress Index SOFR - IORBLiquidity Stress Index (SOFR - IORB)
This indicator tracks the spread between the Secured Overnight Financing Rate (SOFR) and the Interest on Reserve Balances (IORB) set by the Federal Reserve.
A persistently positive spread may indicate funding stress or liquidity shortages in the repo market, as it suggests overnight lending rates exceed the risk-free rate banks earn at the Fed.
Useful for monitoring monetary policy transmission or market/liquidity stress.

OverUnder Yield Spread🗺️ OverUnder is a structural regime visualizer , engineered to diagnose the shape, tone, and trajectory of the yield curve. Rather than signaling trades directly, it informs traders of the world they’re operating in. Yield curve steepening or flattening, normalizing or inverting — each regime reflects a macro pressure zone that impacts duration demand, liquidity conditions, and systemic risk appetite. OverUnder abstracts that complexity into a color-coded compression map, helping traders orient themselves before making risk decisions. Whether you’re in bonds, currencies, crypto, or equities, the regime matters — and OverUnder makes it visible.
🧠 Core Logic
Built to show the slope and intent of a selected rate pair, the OverUnder Yield Spread defaults to 🇺🇸US10Y-US2Y, but can just as easily compare global sovereign curves or even dislocated monetary systems. This value is continuously monitored and passed through a debounce filter to determine whether the curve is:
• Inverted, or
• Steepening
If the curve is flattening below zero: the world is bracing for contraction. Policy lags. Risk appetite deteriorates. Duration gets bid, but only as protection. Stocks and speculative assets suffer, regardless of positioning.
📍 Curve Regimes in Bull and Bear Contexts
• Flattening occurs when the short and long ends compress . In a bull regime, flattening may reflect long-end demand or fading growth expectations. In a bear regime, flattening often precedes or confirms central bank tightening.
• Steepening indicates expanding spread . In a bull context, this may signal healthy risk appetite or early expansion. In a bear or crisis context, it may reflect aggressive front-end cuts and dislocation between short- and long-term expectations.
• If the curve is steepening above zero: the world is rotating into early expansion. Risk assets behave constructively. Bond traders position for normalization. Equities and crypto begin trending higher on rising forward expectations.
🖐️ Dynamically Colored Spread Line Reflects 1 of 4 Regime States
• 🟢 Normal / Steepening — early expansion or reflation
• 🔵 Normal / Flattening — late-cycle or neutral slowdown
• 🟠 Inverted / Steepening — policy reversal or soft landing attempt
• 🔴 Inverted / Flattening — hard contraction, credit stress, policy lag
🍋 The Lemon Label
At every bar, an anchored label floats directly on the spread line. It displays the active regime (in plain English) and the precise spread in percent (or basis points, depending on resolution). Colored lemon yellow, neither green nor red, the label is always legible — a design choice to de-emphasize bias and center the data .
🎨 Fill Zones
These bands offer spatial, persistent views of macro compression or inversion depth.
• Blue fill appears above the zero line in normal (non-inverted) conditions
• Red fill appears below the zero line during inversion
🧪 Sample Reading: 1W chart of TLT
OverUnder reveals a multi-year arc of structural inversion and regime transition. From mid-2021 through late 2023, the spread remains decisively inverted, signaling persistent flattening and credit stress as bond prices trended sharply lower. This prolonged inversion aligns with a high-volatility phase in TLT, marked by lower highs and an accelerating downtrend, confirming policy lag and macro tightening conditions.
As of early 2025, the spread has crossed back above the zero baseline into a “Normal / Steepening” regime (annotated at +0.56%), suggesting a macro inflection point. Price action remains subdued, but the shift in yield structure may foreshadow a change in trend context — particularly if follow-through in steepening persists.
🎭 Different Traders Respond Differently:
• Bond traders monitor slope change to anticipate policy pivots or recession signals.
• Equity traders use regime shifts to time rotations, from growth into defense, or from contraction into reflation.
• Currency traders interpret curve steepening as yield compression or divergence depending on region.
• Crypto traders treat inversion as a liquidity vacuum — and steepening as an early-phase risk unlock.
🛡️ Can It Compare Different Bond Markets?
Yes — with caveats. The indicator can be used to compare distinct sovereign yield instruments, for example:
• 🇫🇷FR10Y vs 🇩🇪DE10Y - France vs Germany
• 🇯🇵JP10Y vs 🇺🇸US10Y - BoJ vs Fed policy curves
However:
🙈 This no longer visualizes the domestic yield curve, but rather the differential between rate expectations across regions
🙉 The interpretation of “inversion” changes — it reflects spread compression across nations , not within a domestic yield structure
🙊 Color regimes should then be viewed as relative rate positioning , not absolute curve health
🙋🏻 Example: OverUnder compares French vs German 10Y yields
1. 🇫🇷 Change the long-duration ticker to FR10Y
2. 🇩🇪 Set the short-duration ticker to DE10Y
3. 🤔 Interpret the result as: “How much higher is France’s long-term borrowing cost vs Germany’s?”
You’ll see steepening when the spread rises (France decoupling), flattening when the spread compresses (convergence), and inversions when Germany yields rise above France’s — historically rare and meaningful.
🧐 Suggested Use
OverUnder is not a signal engine — it’s a context map. Its value comes from situating any trade idea within the prevailing yield regime. Use it before entries, not after them.
• On the 1W timeframe, OverUnder excels as a macro overlay. Yield regime shifts unfold over quarters, not days. Weekly structure smooths out rate volatility and reveals the true curvature of policy response and liquidity pressure. Use this view to orient your portfolio, define directional bias, or confirm long-duration trend turns in assets like TLT, SPX, or BTC.
• On the 1D timeframe, the indicator becomes tactically useful — especially when aligning breakout setups or trend continuations with steepening or flattening transitions. Daily views can also identify early-stage regime cracks that may not yet be visible on the weekly.
• Avoid sub-daily use unless you’re anchoring a thesis already built on higher timeframe structure. The yield curve is a macro construct — it doesn’t oscillate cleanly at intraday speeds. Shorter views may offer clarity during event-driven spikes (like FOMC reactions), but they do not replace weekly context.
Ultimately, OverUnder helps you decide: What kind of world am I trading in? Use it to confirm macro context, avoid fighting the curve, and lean into trades aligned with the broader pressure regime.

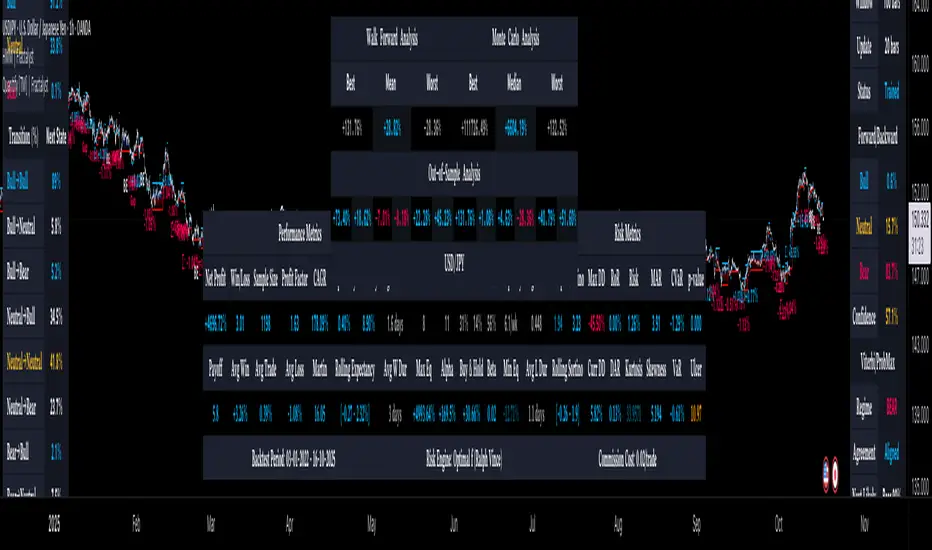
Quantify [Trading Model] | FractalystNote: In this description, "TM" refers to Trading Model (not trademark) and "EM" refers to Entry Model
What’s the indicator’s purpose and functionality?
You know how to identify market bias but always struggle with figuring out the best exit method, or even hesitating to take your trades?
I've been there. That's why I built this solution—once and for all—to help traders who know the market bias but need a systematic and quantitative approach for their entries and trade management.
A model that shows you real-time market probabilities and insights, so you can focus on execution with confidence—not doubt or FOMO.
How does this Quantify differentiate from Quantify ?
Have you managed to code or even found an indicator that identifies the market bias for you, so you don’t have to manually spend time analyzing the market and trend?
Then that’s exactly why you might need the Quantify Trading Model.
With the Trading Model (TM) version, the script automatically uses your given bias identification method to determine the trend (bull vs bear and neutral), detect the bias, and provide instant insight into the trades you could’ve taken.
To avoid complications from consecutive signals, it uses a kNN machine learning algorithm that processes market structure and probabilities to predict the best future patterns.
(You don’t have to deal with any complexity—it’s all taken care of for you.)
Quantify TM uses the k-Nearest Neighbors (kNN) machine learning algorithm to learn from historical market patterns and adapt to changing market structures. This means it can recognize similar market conditions from the past and apply those lessons to current trading decisions.
On the other hand, Quantify EM requires you to manually select your directional bias. It then focuses solely on generating entry signals based on that pre-determined bias.
While the entry model version (EM) uses your manual bias selection to determine the trend, it then provides insights into trades you could’ve taken and should be taking.
Trading Model (TM)
- Uses `input.source()` to incorporate your personal methodology for identifying market bias
- Automates everything—from bias detection to entry and exit decisions
- Adapts to market bias changes through kNN machine learning optimization
- Reduces human intervention in trading decisions, limiting emotional interference
Entry Model (EM)
- Focuses specifically on optimizing entry points within your pre-selected directional bias
- Requires manual input for determining market bias
- Provides entry signals without automating alerts or bias rules
Can the indicator be applied to any market approach/trading strategy?
Yes, if you have clear rules for identifying the market bias, then you can code your bias detection and then use the input.source() user input to retrieve the direction from your own indicator, then the Quantify uses machine-learning identify the best setups for you.
Here's an example:
//@version=6
indicator('Moving Averages Bias', overlay = true)
// Input lengths for moving averages
ma10_length = input.int(10, title = 'MA 10 Length')
ma20_length = input.int(20, title = 'MA 20 Length')
ma50_length = input.int(50, title = 'MA 50 Length')
// Calculate moving averages
ma10 = ta.sma(close, ma10_length)
ma20 = ta.sma(close, ma20_length)
ma50 = ta.sma(close, ma50_length)
// Identify bias
var bias = 0
if close > ma10 and close > ma20 and close > ma50 and ma10 > ma20 and ma20 > ma50
bias := 1 // Bullish
bias
else if close < ma10 and close < ma20 and close < ma50 and ma10 < ma20 and ma20 < ma50
bias := -1 // Bearish
bias
else
bias := 0 // Neutral
bias
// Plot the bias
plot(bias, title = 'Identified Bias', color = color.blue,display = display.none)
Once you've created your custom bias indicator, you can integrate it with Quantify :
- Add your bias indicator to your chart
- Open the Quantify settings
- Set the Bias option to "Auto"
- Select your custom indicator as the bias source
The machine learning algorithms will then analyze historical price action and identify optimal setups based on your defined bias parameters. Performance statistics are displayed in summary tables, allowing you to evaluate effectiveness across different timeframes.
Can the indicator be used for different timeframes or trading styles?
Yes, regardless of the timeframe you’d like to take your entries, the indicator adapts to your trading style.
Whether you’re a swing trader, scalper, or even a position trader, the algorithm dynamically evaluates market conditions across your chosen timeframe.
How Quantify Helps You Trade Profitably?
The Quantify Trading Model offers several powerful features that can significantly improve your trading profitability when used correctly:
Real-Time Edge Assessment
It displays real-time probability of price moving in your favor versus hitting your stoploss
This gives you immediate insight into risk/reward dynamics before entering trades
You can make more informed decisions by knowing the statistical likelihood of success
Historical Edge Validation
Instantly shows whether your trading approach has demonstrated an edge in historical data
Prevents you from trading setups that historically haven't performed well
Gives confidence when entering trades that have proven statistical advantages
Optimized Position Sizing
Analyzes each setup's success rate to determine the adjusted Kelly criterion formula
Customizes position sizing based on your selected maximum drawdown tolerance
Helps prevent account-destroying losses while maximizing growth potential
Advanced Exit Management
Utilizes market structure-based trailing stop-loss mechanisms
Maximizes the average risk-reward ratio profit per winning trade
Helps capture larger moves while protecting gains during market reversals
Emotional Discipline Enforcement
Eliminates emotional bias by adhering to your pre-defined rules for market direction
Prevents impulsive decisions by providing objective entry and exit signals
Creates psychological distance between your emotions and trading decisions
Overtrading Prevention
Highlights only setups that demonstrate positive expectancy
Reduces frequency of low-probability trades
Conserves capital for higher-quality opportunities
Systematic Approach Benefits
By combining machine learning algorithms with your personal bias identification methods, Quantify helps transform discretionary trading approaches into more systematic, probability-based strategies.
What Entry Models are used in Quantify Trading Model version?
The Quantify Trading Model utilizes two primary entry models to identify high-probability trade setups:
Breakout Entry Model
- Identifies potential trade entries when price breaks through significant swing highs and swing lows
- Captures momentum as price moves beyond established trading ranges
- Particularly effective in trending markets when combined with the appropriate bias detection
- Optimized by machine learning to filter false breakouts based on historical performance
Fractals Entry Model
- Utilizes fractal patterns to identify potential reversal or continuation points
- Also uses swing levels to determine optimal entry locations
- Based on the concept that market structure repeats across different timeframes
- Identifies local highs and lows that form natural entry points
- Enhanced by machine learning to recognize the most profitable fractal formations
- These entry models work in conjunction with your custom bias indicator to ensure trades are taken in the direction of the overall market trend. The machine learning component analyzes historical performance of these entry types across different market conditions to optimize entry timing and signal quality.
How Does This Indicator Identify Market Structure?
1. Swing Detection
• The indicator identifies key swing points on the chart. These are local highs or lows where the price reverses direction, forming the foundation of market structure.
2. Structural Break Validation
• A structural break is flagged when a candle closes above a previous swing high (bullish) or below a previous swing low (bearish).
• Break Confirmation Process:
To confirm the break, the indicator applies the following rules:
• Valid Swing Preceding the Break: There must be at least one valid swing point before the break.
3. Numeric Labeling
• Each confirmed structural break is assigned a unique numeric ID starting from 1.
• This helps traders track breaks sequentially and analyze how the market structure evolves over time.
4. Liquidity and Invalidation Zones
• For every confirmed structural break, the indicator highlights two critical zones:
1. Liquidity Zone (LIQ): Represents the structural liquidity level.
2. Invalidation Zone (INV): Acts as Invalidation point if the structure fails to hold.
How does the trailing stop-loss work? what are the underlying calculations?
A trailing stoploss is a dynamic risk management tool that moves with the price as the market trend continues in the trader’s favor. Unlike a fixed take profit, which stays at a set level, the trailing stoploss automatically adjusts itself as the market moves, locking in profits as the price advances.
In Quantify, the trailing stoploss is enhanced by incorporating market structure liquidity levels (explain above). This ensures that the stoploss adjusts intelligently based on key price levels, allowing the trader to stay in the trade as long as the trend remains intact, while also protecting profits if the market reverses.
What is the Kelly Criterion, and how does it work in Quantify?
The Kelly Criterion is a mathematical formula used to determine the optimal position size for each trade, maximizing long-term growth while minimizing the risk of large drawdowns. It calculates the percentage of your portfolio to risk on a trade based on the probability of winning and the expected payoff.
Quantify integrates this with user-defined inputs to dynamically calculate the most effective position size in percentage, aligning with the trader’s risk tolerance and desired exposure.
How does Quantify use the Kelly Criterion in practice?
Quantify uses the Kelly Criterion to optimize position sizing based on the following factors:
1. Confidence Level: The model assesses the confidence level in the trade setup based on historical data and sample size. A higher confidence level increases the suggested position size because the trade has a higher probability of success.
2. Max Allowed Drawdown (User-Defined): Traders can set their preferred maximum allowed drawdown, which dictates how much loss is acceptable before reducing position size or stopping trading. Quantify uses this input to ensure that risk exposure aligns with the trader’s risk tolerance.
3. Probabilities: Quantify calculates the probabilities of success for each trade setup. The higher the probability of a successful trade (based on historical price action and liquidity levels), the larger the position size suggested by the Kelly Criterion.
How can I get started to use the indicator?
1. Set Your Market Bias
• Choose Auto.
• Select the source you want Quantify to use as for bias identification method (explained above)
2. Choose Your Entry Timeframes
• Specify the timeframes you want to focus on for trade entries.
• The indicator will dynamically analyze these timeframes to provide optimal setups.
3. Choose Your Entry Model and BE/TP Levels
• Choose a model that suits your personality
• Choose a level where you'd like the script to take profit or move stop-loss to BE
4. Set and activate the alerts
What tables are used in the Quantify?
• Quarterly
• Monthly
• Weekly
Terms and Conditions | Disclaimer
Our charting tools are provided for informational and educational purposes only and should not be construed as financial, investment, or trading advice. They are not intended to forecast market movements or offer specific recommendations. Users should understand that past performance does not guarantee future results and should not base financial decisions solely on historical data.
Built-in components, features, and functionalities of our charting tools are the intellectual property of @Fractalyst Unauthorized use, reproduction, or distribution of these proprietary elements is prohibited.
- By continuing to use our charting tools, the user acknowledges and accepts the Terms and Conditions outlined in this legal disclaimer and agrees to respect our intellectual property rights and comply with all applicable laws and regulations.
TQ's Support & Resistance(My goal creating this indicator): Provide a way to categorize and label key structures on multiple different levels so I can create a plan based on those observable facts.
The Underlying Concept / What is Momentum?
Momentum indicates transaction pressure. If the algorithm detects price is going up, that would be considered positive momentum. If the algorithm detects price is going down negative momentum would be detected.
The Momentum shown is derived from a price action pattern. Unlike my previous Support & Resistance indicator that used Super Trend, this indicator uses a unique pattern I created. On the first bar bearish momentum is detected a resistance Level is made at the highest point of the previous bullish condition. On the first bar bullish momentum is detected a support Level is made at the lowest point of the previous bearish condition. This happens on 5 different Momentum Levels, (short-term to long-term). I currently use this pattern to trade so the source code is protected.
What is Severity?
Severity is How we differentiate the importance of different Highs and Lows. If Momentum is detected on a higher level the Supply or Demand Level is updated. The Color and Size representing that Level will be shown. Demand and Supply Levels made by higher levels are more SEVERE than a demand level made by a lower level.
Technical Inputs
- to ensure the correct calculation of Support and Resistance levels change BAR_INDEX. BAR_INDEX creates a buffer at the start of the chart. For example: If you set BAR_INDEX to 300. The script will wait for 300 bars to elapse on the current chart before running. This allows the script more time to gather data. Which is needed in order for our dynamic lookback length to never return an error (Dynamic lookback length can't be negative or zero). The lower the timeframe the greater the number of bars need. For Example, if I open up a 1min chart I would enter 5000 as my BAR_INDEX since that will provide enough data to ensure the correct calculation of Support and Resistance levels. If I was on a daily chart, I would enter a lower number such as 800. Don't be afraid to play around with this.
- Toggle options (Close) or (High & Low) creates Support and Resistance Levels using the Lowest close and Highest close or using the Lowest low and Highest high.
Level Inputs
- The indicator has 5 Different Levels indicating SEVEREITY of a Supply and Demand Levels. The higher the Level the more SEVERE the Level.
Display Inputs
- You have the option to customize the Length, Width, Line Style, and Colors of all 5 different
- This indicator includes a Trend Chart. To Easily verify the current trend of any displayed by this indicator toggle on Chart On/Off. You also get the option to change the Chart Position and the size of the Trend Chart
How Trend Is being Determined?
(Close > Current Supply Level) if this statement is true technically price made a HH, so the trend is bullish.
(Close < Current Demand Level) if this statement is true technically price made a LL, so the trend is bearish.
- Fully customize how you display Market Structure on different levels. Line Length, Line Width, Line Style, and Line color can all be customized.
How it can be used?
(Examples of Different ways you can use this indicator): Easily categorize the severity of each and every Supply or Demand Level in the market (The higher Level the stronger the level)
: Quickly Determine the trend of any Level.
: Get a consistent view of a market and how different Levels are behaving but just use one chart.
: Take the discretion from hand drawing support and resistance lines out of your trading.
: Find and categorize strong levels for potential breakouts.
: Trend Analysis, use Levels to create a narrative based on observable facts from these Levels.
: Different Targets to take money off the table.
: Use Severity to differentiate between different trend line setups.
: Find Great places to move your stop loss too.

FunkyQuokka's $ Volume💡 Why $ Volume Matters
Share volume alone is a half-truth — 1M shares traded at $5 isn’t the same as 1M shares at $500. That’s where dollar volume steps in, offering a far more accurate view of institutional interest, breakout validity, liquidity zones and overall trader conviction.
📈 Features:
Clean histogram of dollar volume (close × volume)
Orange line showing customizable average $ volume
K/M/B formatting for axis scale (no huge ugly numbers)
Minimal design to blend into a multi-pane layout
⚙️ Inputs:
Tweakable average length – defaults to 20
By FunkyQuokka 🦘

Previous Day, Week, Monday Liq + Asian, London & Ny session LiqGM Gs,
This indicator helps traders identify key liquidity levels from different market sessions (Asian, London, NY), as well as weekly and daily highs/lows. It automatically plots these levels on the chart, making it easier to spot potential support/resistance zones where price might react.
Key Features:
1. Multi-Timeframe Liquidity Zones
Previous Day High/Low – Tracks the prior day’s range.
Monday High/Low – Useful for weekly opening liquidity.
Previous Week High/Low – Helps identify broader weekly levels.
2. Customizable Session Times
Asian, London, and NY Session Highs/Lows – Automatically detects and plots key levels from each trading session.
Adjustable Time Zones – Supports multiple GMT offsets (GMT-8 to GMT+3), making it adaptable for traders worldwide.
3. Visual Customization
Color & Style Options – Each level type (e.g., London High, NY Low) can be customized in color, line style (solid, dashed, dotted), and width.
Faded Opacity for Swept Levels – When a level is swept (price breaks but closes beyond it), it becomes semi-transparent, helping traders distinguish active vs. invalidated levels.
4. Clean & Informative Labels
Each level has a clear label (e.g., "Asia High," "PW Low") for easy identification.
Adjustable label offsets prevent clutter on the chart.
Pros & Benefits for Traders:
✅ Helps Identify Key Liquidity Zones – Institutional traders often target session highs/lows for liquidity grabs. This indicator makes these levels visible at a glance.
✅ Adaptable to Different Trading Styles
Day Traders – Can use Asian/London/NY session levels for intraday setups.
Swing Traders – Can focus on weekly and Monday levels for broader trends.
✅ No Repainting – Levels are fixed once formed and do not change retroactively.
✅ Customizable for Personal Preference – Traders can adjust colors, line styles, and visibility to match their trading setup.
✅ Useful for Multiple Markets – Works well on Forex (major pairs), indices, and even crypto (due to 24/7 market structure similarities).
Suggested Use Cases:
Breakout Trading – Watch for price reactions at session highs/lows.
Mean Reversion – Fade moves into weekly or daily extremes.
Institutional Liquidity Analysis – Identify potential stop hunts or accumulation zones.
Conclusion:
This indicator is a powerful tool for traders who rely on session-based liquidity, institutional order flow, and key support/resistance levels. By automating the detection of these zones, it saves time and helps traders make more informed decisions.

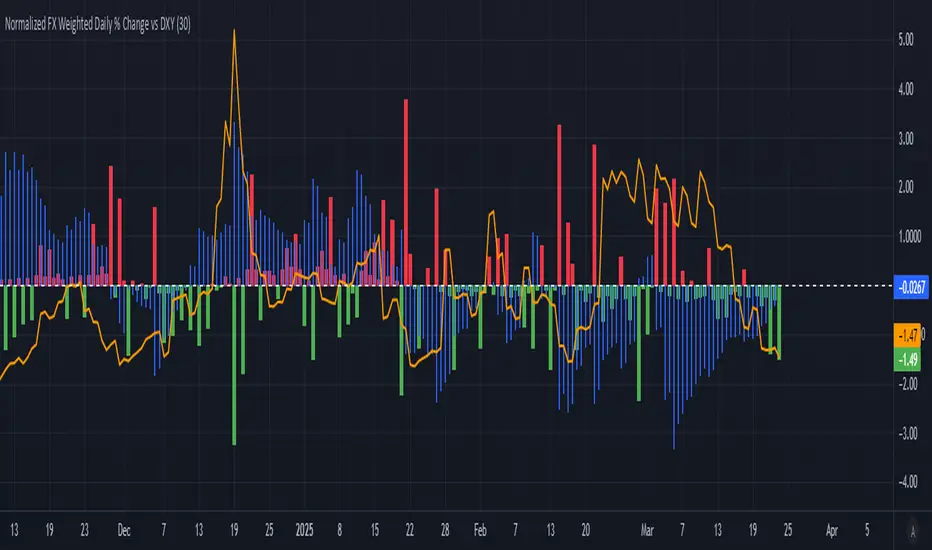
Normalized FX Weighted Daily % Change vs DXYThis indicator tracks international liquidity flows by measuring the USD’s relative strength against major currencies—EUR, CNY, JPY, GBP, and CAD. It calculates the weighted percentage change of each pair over a specified interval. A positive reading means the USD is weakening (liquidity flowing out of the US), while a negative reading indicates the USD is strengthening (liquidity flowing in). Additionally, the indicator incorporates the DXY index and VIX, with all components normalized using Z-scores for clear, comparable insights into market dynamics.
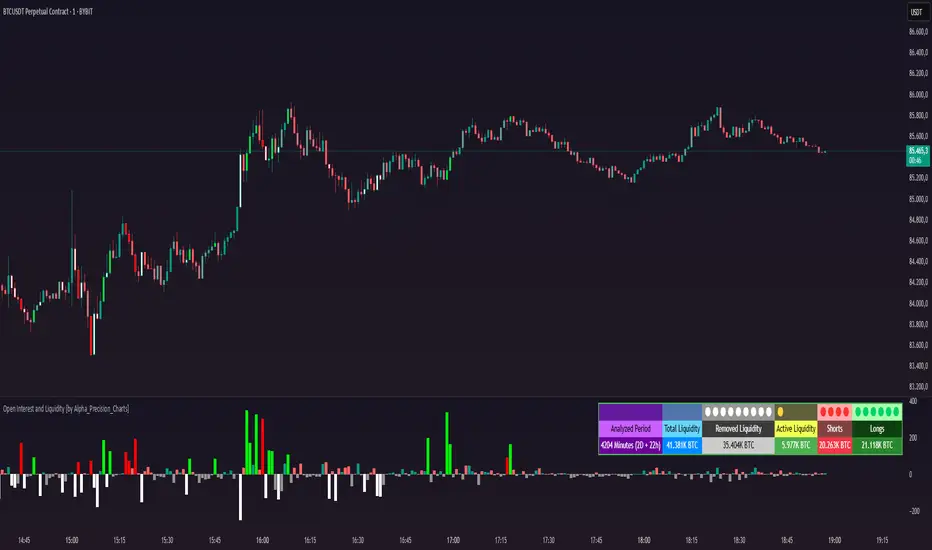
Open Interest and Liquidity [by Alpha_Precision_Charts]Indicator Description: Open Interest and Liquidity
Introduction:
The "Open Interest and Liquidity" indicator is an advanced tool designed for traders seeking to analyze aggregated Open Interest (OI) flow and liquidity in the cryptocurrency market, with a special focus on Bitcoin. It combines high-quality Open Interest data, a detailed liquidity table, and a visual longs vs shorts gauge, providing a comprehensive real-time view of market dynamics. Ideal for scalpers, swing traders, and volume analysts, this indicator is highly customizable and optimized for 1-minute charts, though it works across other timeframes as well.
Key Features:
Aggregated Open Interest and Delta: Leverages Binance data for accuracy, allowing traders to switch between displaying absolute OI or OI Delta, with value conversion to base currency or USD.
Liquidity Table: Displays the analyzed period, active liquidity, shorts, and longs with visual proportion bars, functioning for various cryptocurrencies as long as Open Interest data is available.
Longs vs Shorts Gauge: A semicircle visual that shows real-time market sentiment, adjustable for chart positioning, helping identify imbalances, optimized and exclusive for Bitcoin on 1-minute charts.
Utilities:
Sentiment Analysis: Quickly detect whether the market is accumulating positions (longs/shorts) or liquidating (OI exits).
Pivot Identification: Highlight key moments of high buying or selling pressure, ideal for trade entries or exits.
Liquidity Monitoring: The table and gauge provide a clear view of active liquidity, helping assess a move’s strength.
Scalping and Day Trading: Perfect for short-term traders operating on 1-minute charts, offering fast and precise visual insights.
How to Use:
Initial Setup: Choose between "Open Interest" (candles) or "Open Interest Delta" (columns) in the "Display" field. The indicator defaults to Binance data for enhanced accuracy.
Customization: Enable/disable the table and gauge as needed and position them on the chart.
Interpretation: Combine OI Delta and gauge data with price movement to anticipate breakouts or reversals.
Technical Notes
The indicator uses a 500-period VWMA to calculate significant OI Delta thresholds and is optimized for Bitcoin (BTCUSDT.P) on high-liquidity charts.
Disclaimer
This indicator relies on the availability of Open Interest data on TradingView. For best results, use on Bitcoin charts with high liquidity, such as BTCUSDT.P. Accuracy may vary with lower-volume assets or exchanges.
Range Breakout Signals [AlgoAlpha]OVERVIEW
This script detects range-bound market conditions and breakout signals using a combination of volatility compression and volume imbalance analysis. It identifies zones where price consolidates within a defined range and highlights potential breakout points with visual markers. Traders can use this to spot market transitions from ranging to trending phases, aiding in decision-making for breakout strategies.
CONCEPTS
The script measures volatility by comparing the ratio of the simple moving average (SMA) of price movements to their median value. When volatility drops below a threshold, the script assumes a range-bound market. It then tracks the cumulative volume of buying and selling pressure to assess breakout strength. The approach is based on the idea that market consolidation often precedes strong moves, and volume distribution can provide clues on the breakout direction.
FEATURES
Range Detection : Uses a volatility filter to identify low-volatility zones and marks them on the chart with shaded boxes.
Volume Imbalance Analysis : Evaluates cumulative up and down volume over a confirmation period to assess directional bias.
Breakout Signals : When price exits a detected range, the script plots breakout markers. A ▲ symbol indicates a bullish breakout, and a ▼ symbol indicates a bearish breakout. Additional "+" markers indicate strong volume imbalance favoring the breakout direction.
Adaptive Timeframe Volume Analysis : The script dynamically adjusts its volume calculation based on the chart’s timeframe, ensuring reliable signal generation across different trading conditions.
Alerts : Notifies traders when a new range is detected or when a breakout occurs, allowing for automated monitoring.
USAGE
Traders can use this script to identify potential trade setups by entering positions when price breaks out of a detected range. For breakout confirmation, traders can look at volume imbalance cues—bullish breakouts with strong buying volume may indicate sustained moves, while weak volume breakouts may lead to false signals. This script is particularly useful for breakout traders, range traders seeking to fade breakouts, and those looking to automate trade alerts in volatile markets.

Liquidity Sweep Filter Strategy [AlgoAlpha X PineIndicators]This strategy is based on the Liquidity Sweep Filter developed by AlgoAlpha. Full credit for the concept and original indicator goes to AlgoAlpha.
The Liquidity Sweep Filter Strategy is a non-repainting trading system designed to identify liquidity sweeps, trend shifts, and high-impact price levels. It incorporates volume-based liquidation analysis, trend confirmation, and dynamic support/resistance detection to optimize trade entries and exits.
This strategy helps traders:
Detect liquidity sweeps where major market participants trigger stop losses and liquidations.
Identify trend shifts using a volatility-based moving average system.
Analyze volume distribution with a built-in volume profile visualization.
Filter noise by differentiating between major and minor liquidity sweeps.
How the Liquidity Sweep Filter Strategy Works
1. Trend Detection Using Volatility-Based Filtering
The strategy applies a volatility-adjusted moving average system to determine trend direction:
A central trend line is calculated using an EMA smoothed over a user-defined length.
Upper and lower deviation bands are created based on the average price deviation over multiple periods.
If price closes above the upper band, the strategy signals an uptrend.
If price closes below the lower band, the strategy signals a downtrend.
This approach ensures that trend shifts are confirmed only when price significantly moves beyond normal market fluctuations.
2. Liquidity Sweep Detection
Liquidity sweeps occur when price temporarily breaks key levels, triggering stop-loss liquidations or margin call events. The strategy tracks swing highs and lows, marking potential liquidity grabs:
Bearish Liquidity Sweeps – Price breaks a recent high, then reverses downward.
Bullish Liquidity Sweeps – Price breaks a recent low, then reverses upward.
Volume Integration – The strategy analyzes trading volume at each sweep to differentiate between major and minor sweeps.
Key levels where liquidity sweeps occur are plotted as color-coded horizontal lines:
Red lines indicate bearish liquidity sweeps.
Green lines indicate bullish liquidity sweeps.
Labels are displayed at each sweep, showing the volume of liquidated positions at that level.
3. Volume Profile Analysis
The strategy includes an optional volume profile visualization, displaying how trading volume is distributed across different price levels.
Features of the volume profile:
Point of Control (POC) – The price level with the highest traded volume is marked as a key area of interest.
Bounding Box – The profile is enclosed within a transparent box, helping traders visualize the price range of high trading activity.
Customizable Resolution & Scale – Traders can adjust the granularity of the profile to match their preferred time frame.
The volume profile helps identify zones of strong support and resistance, making it easier to anticipate price reactions at key levels.
Trade Entry & Exit Conditions
The strategy allows traders to configure trade direction:
Long Only – Only takes long trades.
Short Only – Only takes short trades.
Long & Short – Trades in both directions.
Entry Conditions
Long Entry:
A bullish trend shift is confirmed.
A bullish liquidity sweep occurs (price sweeps below a key level and reverses).
The trade direction setting allows long trades.
Short Entry:
A bearish trend shift is confirmed.
A bearish liquidity sweep occurs (price sweeps above a key level and reverses).
The trade direction setting allows short trades.
Exit Conditions
Closing a Long Position:
A bearish trend shift occurs.
The position is liquidated at a predefined liquidity sweep level.
Closing a Short Position:
A bullish trend shift occurs.
The position is liquidated at a predefined liquidity sweep level.
Customization Options
The strategy offers multiple adjustable settings:
Trade Mode: Choose between Long Only, Short Only, or Long & Short.
Trend Calculation Length & Multiplier: Adjust how trend signals are calculated.
Liquidity Sweep Sensitivity: Customize how aggressively the strategy identifies sweeps.
Volume Profile Display: Enable or disable the volume profile visualization.
Bounding Box & Scaling: Control the size and position of the volume profile.
Color Customization: Adjust colors for bullish and bearish signals.
Considerations & Limitations
Liquidity sweeps do not always result in reversals. Some price sweeps may continue in the same direction.
Works best in volatile markets. In low-volatility environments, liquidity sweeps may be less reliable.
Trend confirmation adds a slight delay. The strategy ensures valid signals, but this may result in slightly later entries.
Large volume imbalances may distort the volume profile. Adjusting the scale settings can help improve visualization.
Conclusion
The Liquidity Sweep Filter Strategy is a volume-integrated trading system that combines liquidity sweeps, trend analysis, and volume profile data to optimize trade execution.
By identifying key price levels where liquidations occur, this strategy provides valuable insight into market behavior, helping traders make better-informed trading decisions.
Key use cases for this strategy:
Liquidity-Based Trading – Capturing moves triggered by stop hunts and liquidations.
Volume Analysis – Using volume profile data to confirm high-activity price zones.
Trend Following – Entering trades based on confirmed trend shifts.
Support & Resistance Trading – Using liquidity sweep levels as dynamic price zones.
This strategy is fully customizable, allowing traders to adapt it to different market conditions, timeframes, and risk preferences.
Full credit for the original concept and indicator goes to AlgoAlpha.

NoSweep CandlesNoSweep Candles – Identify Candles Without Liquidity Sweeps
The NoSweep Candles indicator highlights candles that do not break the high or low of the previous candle. This helps traders easily spot areas of consolidation, potential reversals, or moments of market indecision.
Key Features:
✅ White candle coloring when neither the high nor low of the previous candle is breached.
✅ Keeps default colors for other candles, maintaining a clean chart.
✅ Perfect for Smart Money Concept (SMC) traders, helping identify liquidity stability.
✅ No unnecessary signals or distractions, just pure price action analysis.
Use NoSweep Candles to refine your trading strategy and better understand market structure! 🚀
Global M2 Money Supply (USD) GrowthThe Global M2 Growth indicator evaluates the total liquid money supply, including cash, checking deposits, and assets that can be easily converted to cash. It reflects changes in global liquidity by tracking year-on-year (YoY) changes in the Global M2 money supply rather than its absolute value. This approach highlights the velocity of liquidity expansion or contraction, offering a clearer understanding of its correlation with asset performance, such as Bitcoin.
How It Works
When the Global M2 money supply expands, it reflects an increase in available liquidity. This often leads to an influx of capital into higher-yielding and riskier assets like Bitcoin, equities, and commodities. Conversely, when M2 contracts, liquidity tightens, leading to declines in the values of these assets.
An essential insight is that Bitcoin's price is not immediately affected by changes in M2. Research shows a lag of approximately 56-60 days (around two months) between liquidity changes and Bitcoin's price movements. Shifting the liquidity data forward by this period improves the correlation between Global M2 and Bitcoin performance.
How to Use
Track Global M2 YoY Change: Focus on liquidity's yearly change to identify trends. Rapid increases in liquidity often signify favorable conditions for Bitcoin and other risk assets to rise, while contractions often predict price declines or consolidation phases.
Account for the Lag Effect: Incorporate the two-month lag into your analysis to predict Bitcoin's potential moves more accurately. For instance, a recent resurgence in liquidity growth could signal a Bitcoin rally within the next two months.
Use as a Macro Indicator: Monitor liquidity trends alongside other economic indicators and asset performance metrics to build a more comprehensive investment framework.
By tracking these dynamics, traders and investors can better anticipate Bitcoin's trajectory and make informed decisions.

Pipnotic Supply and DemandDescription
The Pipnotic Supply and Demand Indicator was originally developed in 2011 for another trading platform and is currently being rewritten for TradingView due to user demand. It is a powerful tool designed for traders who utilize supply and demand concepts in technical analysis. This script automatically detects and highlights key supply and demand zones (as well as buy and sell zones) on the chart, enabling traders to identify potential reversal points, trend continuations, and price imbalances. We will continue to actively develop this indicator for existing and this new version for TradingView.
How It Works
The indicator follows a structured methodology to analyse price action and identify high-probability supply and demand zones:
Zone Identification:
Detects accumulation and distribution phases using volatility and range conditions.
Identifies zones where price imbalances occur, signalling potential trading opportunities.
Expansion and Confirmation:
Assesses whether the price expands away from a zone significantly enough to validate it as a supply or demand zone.
Uses a risk-to-reward ratio to ensure zones meet predefined trading criteria, adjustable via the configuration.
Visualization and Management:
Plots supply (bearish) and demand (bullish) zones directly on the chart.
Labels the percentage of expansion from the zone, giving traders insights into the strength of the imbalance.
Updates zones dynamically, marking tested and consumed levels and preventing outdated information from cluttering the chart.
Key Features & Inputs
Customizable Zone Display: Traders can adjust the maximum number of supply and demand zones shown on the chart.
Dynamic Volatility Sampling: Uses the ATR (Average True Range) to adapt to changing market conditions.
Flexible Risk Management: Allows traders to define a minimum zone size and a risk-to-reward ratio for filtering zones.
Enhanced Visualization:
Adjustable colours for bullish and bearish zones.
Configurable border width for zone clarity.
Optional display of consumed zones to avoid redundant signals, but to also identify price sensitive zones on the flip side of the book when zones are consumed.
Swing Significance Detection: Enables boxing of significant price swings to refine the accuracy of identified zones.
Benefits of Using the Pipnotic Supply and Demand Indicator
Automates Supply and Demand Analysis: Eliminates the need for manual zone drawing, saving time and reducing subjectivity.
Enhances Trade Decision-Making: By providing precise entry and exit points based on supply and demand principles, traders can optimize their strategies.
Adapts to Market Conditions: The indicator dynamically adjusts to price movements, ensuring relevant zones are displayed.
Works Across All Timeframes: Suitable for scalping, swing trading, and long-term investing.
Compatible with Multiple Trading Strategies: Can be used alongside trend-following, breakout, and reversal strategies for improved trade confirmation.

MTF Fractals [RunRox]🔽 MTF Fractals is a powerful indicator designed to visualize fractals from multiple timeframes directly on your chart, highlight liquidity sweeps at these fractal levels, and provide several additional features we’ll cover in detail below.
We created this indicator because we couldn’t find a suitable tool that met our specific needs on TradingView. Therefore, we decided to develop a valuable indicator for the entire TradingView community, combining simplicity and versatility.
⁉️ WHAT IS A FRACTALS?
In trading, a fractal is a technical analysis pattern composed of five consecutive candles, typically highlighting local market turning points. Specifically, a fractal high is formed when a candle’s high is higher than the highs of the two candles on either side, whereas a fractal low occurs when a candle’s low is lower than the lows of the two adjacent candles on both sides.
Traders use fractals as reference points for identifying significant support and resistance levels, potential reversal areas, and liquidity zones within price action analysis. Below is a screenshot illustrating clearly formed fractals on the chart.
📙 FRACTAL FORMATION
Here’s how fractals form depending on your chosen setting (3, 5, 7, or 9):
▶️ 3-bar fractal – forms when the central candle is higher (for highs) or lower (for lows) than one candle on each side.
▶️ 5-bar fractal – forms when the central candle is higher or lower than two candles on both sides.
▶️ 7-bar fractal – forms when the central candle is higher or lower compared to the three candles on each side.
▶️ 9-bar fractal – forms similarly but requires four candles on each side, making the fractal significantly more reliable and robust.
A higher number of bars ensures stronger fractal levels, highlighting more significant potential reversal points on the chart.
Now that we’ve covered the theory behind fractal formation, let’s explore the indicator’s functionality in more detail.
Below, I’ll explain each feature clearly and illustrate how you can effectively utilize this indicator in your trading.
🕐 MULTI-TIMEFRAME FRACTALS
We realized that displaying fractals only from the current timeframe isn’t always convenient, so we’ve introduced Multi-Timeframe Fractals into this indicator.
Now you can easily display fractals from higher timeframes directly on your current chart, providing you with broader market context and clearer trading signals.
Fractals from Current Timeframe – Fractals identified directly on the chart’s current timeframe.
Fractals from Higher Timeframes – Fractals sourced from higher timeframes and displayed clearly on your current chart for enhanced market perspective.
📈 FRACTAL LINES
Since fractals represent areas of high liquidity, we’ve added an option to extend fractal levels horizontally as Fractal Lines across your chart.
This feature allows you to clearly visualize critical liquidity areas from higher timeframes, directly on your current timeframe chart, as demonstrated in the screenshot below.
With this approach, you can clearly visualize significant fractal levels from higher timeframes directly on your current chart - for example, projecting fractals from the 1-hour (1H) timeframe onto a 3-minute (3m) chart. ✅ This helps you easily identify critical liquidity areas and potential reversal zones without the need to switch between multiple timeframes.
💰 LIQUDITY SWEEP (LIQUDITY GRAB)
To enhance your trading experience, we’ve introduced a feature that clearly identifies liquidity sweeps of fractal levels.
A Liquidity Sweep occurs when a candle closes beyond a fractal line, leaving a wick that pierces through it, signaling that liquidity has been collected at this level.
Below, you’ll find two examples illustrating this functionality:
▶️ Fractal lines from the current timeframe
▶️ Fractal lines projected from higher timeframes
The first example illustrates liquidity being swept from fractals on the current timeframe .
Here, the candle clearly closes beyond the fractal line, leaving a wick through it. This indicates a liquidity sweep at the fractal level, visually highlighting a potential reversal or continuation opportunity directly on your chart.
In the second example, fractals from the higher timeframe are projected onto your current chart.
When a candle on your current timeframe closes beyond an HTF fractal line - leaving a wick through this level - the indicator highlights it clearly. This signals to traders a potential reversal zone, indicating that liquidity has been swept, and price may reverse or significantly react from this area.
You can also enable the display of additional labels on the chart. These labels clearly mark liquidity sweeps at fractal levels, making it easier to visually identify potential reversal points directly on your chart.
⚙️ SETTINGS
Below are the indicator settings with detailed explanations for each parameter.
🔷 Bars in Fractal – Number of candles to the right and left required to form a fractal.
🔷 Fractal Timeframe – Select the timeframe from which you want to display fractals on the current chart.
🔷 Max Age, bars – Number of bars during which the fractal will remain active.
🔷 Show Fractal Line – Display or hide fractal lines.
🔷 Line Style – Choose the style of the line displayed on the chart.
🔷 Line Width – Thickness of the fractal line.
🔷 High Fractal – Style and color of bearish fractals.
🔷 Low Fractal – Style and color of bullish fractals.
🔷 Fractal Label Size – Select the size of fractal labels.
🔷 Show Sweep Labels – Option to display labels when a liquidity sweep occurs.
🔷 Label Color – Color and transparency of the area marked on the chart during a sweep.
🔷 Shade Sweep Area – Show or hide the sweep area shading.
🔷 Area Color – Color and transparency settings for the sweep area.
🔶 We’d love to hear your feedback and any suggestions for additional features you’d like to see in this indicator. We’ll be happy to consider your ideas and continue improving the indicator!

Liquidity Depth [AlgoAlpha]OVERVIEW
This script visualizes market liquidity by identifying key price levels where significant volume has transacted. It highlights zones of high buying and selling interest, helping traders understand where liquidity is accumulating and how price may respond to these areas. By dynamically tracking volume at highs and lows, the script builds a real-time liquidity profile, making it a powerful tool for identifying potential support and resistance levels.
CONCEPTS
Liquidity depth analysis helps traders determine how price interacts with supply and demand at different levels. The script processes historical volume data to distinguish between high-liquidity and low-liquidity zones. It assigns transparency levels to plotted lines , ensuring that more relevant liquidity areas stand out visually. The script adds a profile to show the depth of liquidity (derived from historical volume data) for levels above and below the current price
FEATURES
Liquidity Levels: Tracks liquidity levels based on volume concentration at price high and lows.
Volume-Based Transparency: More significant liquidity levels are displayed with higher visibility, showing their significance.
Interpolation: interpolates the bullish and bearish liquidity depth at a user defined range away from the price, helping in comparing the liquidity amounts between bullish and bearish.
Depth Profile: Allows traders to visualize depth of liquidity in a more quantitative and clearer way than the liquidity levels/list]
USAGE
This indicator is best used to track liquidity levels and potential price reaction areas. Traders can adjust the Liquidity Lookback setting to analyze past liquidity levels over different historical periods. The Profile Resolution setting controls the granularity of liquidity depth visualization, with higher values providing more detail. The script can be applied across different timeframes, from intraday scalping to swing trading analysis. The plotted liquidity zones provide traders with insights into where price may encounter strong support, resistance, or potential liquidity-driven reversals.

1H/3m Concept [RunRox]🕘 1H/3m Concept is a versatile trading methodology based on liquidity sweeps from fractal points identified on higher timeframes, followed by price reversals at these key moments.
Below, I will explain this concept in detail and provide clear examples demonstrating its practical application.
⁉️ WHAT IS A FRACTALS?
In trading, a fractal is a technical analysis pattern composed of five consecutive candles, typically highlighting local market turning points. Specifically, a fractal high is formed when a candle’s high is higher than the highs of the two candles on either side, whereas a fractal low occurs when a candle’s low is lower than the lows of the two adjacent candles on both sides.
Traders use fractals as reference points for identifying significant support and resistance levels, potential reversal areas, and liquidity zones within price action analysis. Below is a screenshot illustrating clearly formed fractals on the chart.
📌 ABOUT THE CONCEPT
The 1H/3m Concept involves marking Higher Timeframe (HTF) fractals directly onto a Lower Timeframe (LTF) chart. When a liquidity sweep occurs at an HTF fractal level, we remain on the same LTF chart (since all HTF fractals are already plotted on this lower timeframe) and wait for a clear Market Structure Shift (MSS) to identify our potential entry point.
Below is a schematic illustration clearly demonstrating how this concept works in practice.
Below is another 💡 real-chart example , showing liquidity in the form of a 1H fractal, swept by a rapid impulse move. Immediately afterward, a clear Market Structure Shift (MSS) occurs, signaling a potential entry point into the trade.
Another example is shown below, where we see our hourly fractal, from which price clearly reacts, providing an opportunity to search for an entry point.
As illustrated on the chart, the fractal levels from the higher timeframe are clearly displayed, but we’re working directly on the 5-minute chart. This allows us to remain on one timeframe without needing to switch back and forth between charts to spot such trading setups.
🔍 MTF FRACTALS
This concept can be applied across various HTF-LTF timeframe combinations. Although our examples illustrate 1H fractals used on a 5-minute chart, you can effectively utilize many other timeframe combinations, such as:
30m HTF fractals on 1m chart
1H HTF fractals on 3m chart
4H HTF fractals on 15m chart
1D HTF fractals on 1H chart
The key idea behind this concept is always the same: identify liquidity at fractal levels on the higher timeframe (HTF), then wait for a clear Market Structure Shift (MSS) on the lower timeframe (LTF) to enter trades.
⚙️ SETTINGS
🔷 Trade Direction – Select the preferred trading direction (Long, Short, or Both).
🔷 HTF – Choose the higher timeframe from which fractals will be displayed on the current chart.
🔷 HTF Period – Number of candles required on both sides of a fractal candle (before and after) to confirm fractal formation on the HTF.
🔷 Current TF Period – Sensitivity to the impulse that sweeps liquidity, used for identifying and forming the MSS line.
🔷 Show HTF – Enable or disable displaying HTF fractal lines on your chart. You can also customize line style and color.
🔷 Max Age (Bars) – Number of recent bars within which fractals from the selected HTF will be displayed.
🔷 Show Entry – Enable or disable displaying the MSS line on the chart.
🔷 Enable Alert – Activates TradingView alerts whenever the MSS line is crossed.
You can also enable 🔔 alerts, which notify you whenever price crosses the MSS line. This significantly simplifies the process of identifying these setups on your charts. Simply configure your preferred timeframes and wait for notifications when the MSS line is crossed.
🔶 We greatly appreciate your feedback and suggestions for improving the indicator!

Liquidity Imbalance Index (Li2)How to Use the Liquidity Imbalance Index (Li2)
The Liquidity Imbalance Index (Li2) is designed to track market liquidity and identify significant imbalances between buyers and sellers. Here's how to effectively use this indicator in your trading:
Understanding the Main Components
1. Liquidity Delta Histogram/Line:
- Shows the difference between buy and sell liquidity
- Green bars/line: Buying pressure dominates
- Red bars/line: Selling pressure dominates
- The intensity of color shows the strength of the imbalance
2. Threshold Lines:
- Upper (green) threshold: Marks significant buy pressure
- Lower (red) threshold: Marks significant sell pressure
- Neutral zone: Area between the dotted lines where neither buyers nor sellers dominate
3. Liquidity Zones (circles shown on top/bottom):
- Green circles on upper threshold: Historical bull zones (significant buying interest)
- Red circles on lower threshold: Historical bear zones (significant selling interest)
- These zones require multiple hits, consecutive signals, and optionally volume confirmation
Trading Strategies
For Trend Trading
1. Look for when the Liquidity Delta crosses above the upper threshold for bullish signals
2. Look for when the Liquidity Delta crosses below the lower threshold for bearish signals
3. Especially powerful when crossing occurs with acceleration (darker histogram colors)
For Support and Resistance
1. Identify where the significant bull/bear zones appear (green/red circles)
2. These often align with important price levels where orders cluster
3. Use these zones as potential reversal or confirmation points
For Divergence
1. Watch for price making new highs/lows while liquidity shows the opposite
2. Divergence between price and liquidity can signal potential reversals
Volume Confirmation
1. Pay attention to volume-confirmed signals (small circles at zero line)
2. These indicate stronger conviction behind the liquidity imbalance
Optimal Settings
- For day trading or volatile markets, consider reducing lookback periods and increasing thresholds
- For swing trading, the default settings work well to capture significant zones
- In ranging markets, focus on the zones as they often mark the range boundaries
- In trending markets, follow the overall direction of the liquidity delta
Reading Acceleration Signals
The indicator shows color intensity variations to highlight acceleration in liquidity flows:
- Dark green/red: Strong acceleration (rapid shift in order flow)
- Medium green/red: Medium acceleration
- Light green/red: Weak acceleration
These acceleration signals often precede significant price movements.
Liquidity Location Detector [BigBeluga]
This indicator helps traders identify potential liquidity zones by detecting significant volume levels at key highs and lows. By using color intensity and scoring numbers, it visually highlights areas where liquidity concentration may be highest while incorporating trend analysis through EMAs.
🔵Key Features:
Liquidity Zone Detection: Automatically detects and marks areas where significant volume has accumulated at swing highs and lows.
Dynamic Box Plotting: Draws liquidity boxes at key highs and lows, updating based on market conditions.
Volume Strength Scaling: Uses a scoring system to rank liquidity zones, helping traders identify the strongest areas.
Color Intensity for Volume Strength: More transperent color indicate less liquidity, while less transperent represent stronger volume concentrations.
Customizable Display: Users can adjust the number of displayed liquidity zones and modify colors to suit their trading style.
Real-Time Liquidity Adaptation: As price interacts with liquidity zones, the indicator updates dynamically to reflect changing market conditions.
Auto-Stopping Liquidity Zones: Liquidity boxes automatically stop extending to the right once price crosses them, preventing outdated zones from interfering with live market action.
Trend Analysis with EMAs: Includes two optional EMAs (fast and slow) to help traders analyze market trends. Users can enable or disable these EMAs in the settings and use crossover signals for trend confirmation.
🔵Usage:
Identify Key Liquidity Areas: Use color intensity and transparency levels to determine high-impact liquidity zones.
Support & Resistance Confirmation: Liquidity zones can act as potential support and resistance levels, enhancing trade decision-making.
Market Structure Analysis: Observe how price interacts with liquidity to anticipate breakout or reversal points.
Scalping & Swing Trading: Works for both short-term and long-term traders looking for liquidity-based trade setups.
Liquidation Map Insight: A liquidity map highlights areas where large amounts of leveraged positions (both long and short) are likely to get liquidated. Since many traders use leverage, sharp price movements can trigger a cascade of liquidations, leading to rapid price surges or drops. Monitoring these liquidity zones and trends helps traders anticipate where price might react strongly.
Liquidity Location Detector is an essential tool for traders seeking to map out potential liquidity zones, providing deeper insights into market structure and trading volume dynamics.

FinFluential Global M2 Money Supply // Days Offset =The "Global M2 Money Supply" indicator calculates and visualizes the combined M2 money supply from multiple countries and regions worldwide, expressed in trillions of USD.
M2 is a measure of the money supply that includes cash, checking deposits, and easily convertible near-money assets. This indicator aggregates daily M2 data from various economies, converts them into a common USD base using forex exchange rates, and plots the total as a single line on the chart.
It is designed as an overlay indicator aligned to the right scale, making it ideal for comparing global money supply trends with price action or other market data.
Key Features
Customizable Time Offset: Users can adjust the number of days to shift the M2 data forward or backward (from -1000 to +1000 days) via the indicator settings. This allows for alignment with historical events or forward-looking analysis.
Global Coverage Includes:
Eurozone: Eurozone M2 (converted via EUR/USD)
North America: United States, Canada
Non-EU Europe: Switzerland, United Kingdom, Finland, Russia
Pacific: New Zealand
Asia: China, Taiwan, Hong Kong, India, Japan, Philippines, Singapore
Latin America: Brazil, Colombia, Mexico
Middle East: United Arab Emirates, Turkey
Africa: South Africa

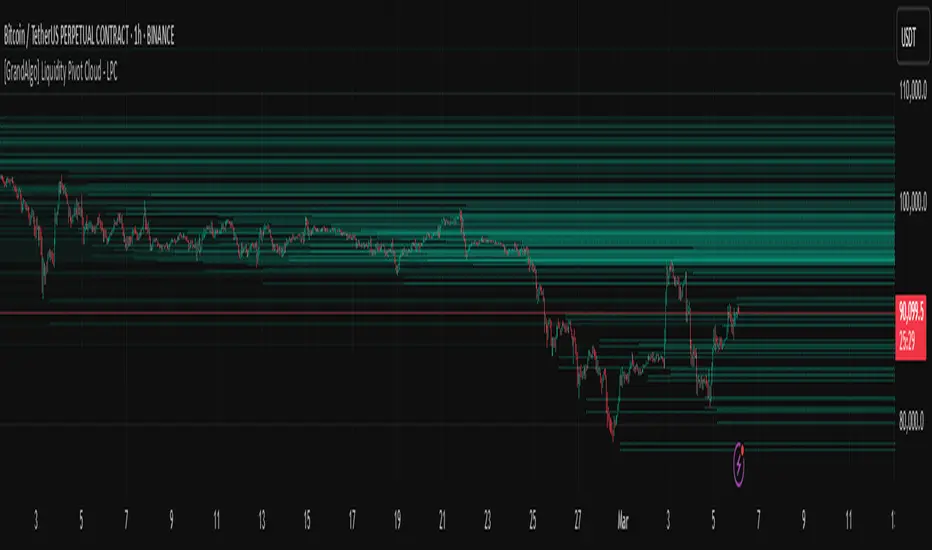
[GrandAlgo] Liquidity Pivot Cloud - LPCLiquidity Pivot Cloud (LPC) is a visualization tool that extends all pivot levels to the right, creating a structured liquidity map across the chart. Instead of treating pivot points as static levels, LPC transforms them into a dynamic cloud, highlighting key areas where price has historically reacted.
Key Features:
Extended Pivot Levels – Automatically stretches all pivot highs and lows, forming a continuous liquidity zone.
Clear Structure – Provides an organized view of price action, making it easy to identify reaction zones.
Dynamic Liquidity Map – Helps traders spot potential liquidity sweeps and areas of price absorption.
How to Use:
Identify Liquidity Zones – Areas with multiple overlapping pivots signal strong liquidity pools.
Look for Reactions – Price often consolidates, wicks, or reverses around extended pivot clouds.
Combine with Confluence – Use alongside Fair Value Gaps, Institutional Price Blocks, or Market Structure shifts for higher probability setups.
LPC aligns with smart money concepts by revealing key liquidity areas where stop hunts, liquidity grabs, and institutional activity are likely to occur. It helps traders see where price is likely to be drawn before a major move, making it a valuable tool for those trading liquidity-based strategies.
Liquidations Levels [RunRox]📈 Liquidation Levels is an indicator designed to visualize key price levels on the chart, highlighting potential reversal points where liquidity may trigger significant price movements.
Liquidity is essential in trading - price action consistently moves from one liquidity area to another. We’ve created this free indicator to help traders easily identify and visualize these liquidity zones on their charts.
📌 HOW IT WORKS
The indicator works by marking visible highs and lows, points widely recognized by traders. Because many traders commonly place their stop-loss orders beyond these visible extremes, significant liquidity accumulates behind these points. By analyzing trading volume and visible extremes, the indicator estimates areas where clusters of stop-loss orders (liquidity pools) are likely positioned, giving traders valuable insights into potential market moves.
As shown in the screenshot above, the price aggressively moved toward Sell-Side liquidity. After sweeping this liquidity level for the second time, it reversed and began targeting Buy-Side liquidity. This clearly demonstrates how price moves from one liquidity pool to another, continually seeking out liquidity to fuel its next directional move.
As shown in the screenshot, price levels with fewer anticipated trader stop-losses are indicated by less vibrant, faded colors. When the lines become more saturated and vivid, it signals that sufficient liquidity - in the form of clustered stop-losses has accumulated, potentially attracting price movement toward these areas.
⚙️ SETTINGS
🔹 Period – Increasing this setting makes the marked highs and lows more significant, filtering out minor price swings.
🔹 Low Volume – Select the color displayed for low-liquidity levels.
🔹 High Volume – Select the color displayed for high-liquidity levels.
🔹 Levels to Display – Choose between 1 and 15 nearest liquidity levels to be shown on the chart.
🔹 Volume Sensitivity – Adjust the sensitivity of the indicator to volume data on the chart.
🔹 Show Volume – Enable or disable the display of volume values next to each liquidity level.
🔹 Max Age – Limits displayed liquidity levels to those not older than the specified number of bars.
✅ HOW TO USE
One method of using this indicator is demonstrated in the screenshot above.
Price reached a high-liquidity level and showed an initial reaction. We then waited for a second confirmation - a liquidity sweep followed by a clear market structure break - to enter the trade.
Our target is set at the liquidity accumulated below, with the stop-loss placed behind the manipulation high responsible for the liquidity sweep.
By following this approach, you can effectively identify trading opportunities using this indicator.
🔶 We’ve made every effort to create an indicator that’s as simple and user-friendly as possible. We’ll continue to improve and enhance it based on your feedback and suggestions in the future.

Uptrick: Portfolio Allocation DiversificationIntro
The Uptrick: Portfolio Allocation Diversification script is designed to help traders and investors manage multiple assets simultaneously. It generates signals based on various trading systems, allocates capital using different diversification methods, and displays real-time metrics and performance tables on the chart. The indicator compares active trading strategies with a separate long-term holding (HODL) simulation, allowing you to see how a systematic trading approach stacks up against a simple buy-and-hold strategy.
------------------------------------------------------------------------
Trading System Selection
1. No signals (none)
In this mode, the script does not produce bullish or bearish indicators; every asset stays in a neutral stance. This setup is useful if you prefer to observe how capital might be distributed based solely on the chosen diversification method, with no influence from directional signals.
2. rsi – neutral
This mode uses an index-based measure of whether an asset appears overbought or oversold. It generates a bearish signal if market conditions point to overbought territory, and a bullish signal if they indicate oversold territory. If neither extreme surfaces, it remains neutral. Some traders apply this in sideways or range-bound conditions, where overbought and oversold levels often hint at possible turning points. It does not specifically account for divergence patterns.
3. rsi – long only
In this setting, the system watches for instances where momentum readings strengthen even if the asset’s price is still under pressure or setting new lows. It also considers oversold levels as potential signals for a bullish setup. When such conditions emerge, the script flags a possible move to the upside, ignoring indications that might otherwise suggest a bearish trend. This approach is generally favored by those who want to concentrate exclusively on identifying price recoveries.
4. rsi – short only
Here, the script focuses on spotting signs of deteriorating momentum while an asset’s price remains relatively high or attempts further gains. It also checks whether the market is drifting into overbought territory, suggesting a potential decline. Under such conditions, it issues a bearish signal. It provides no bullish alerts, making it particularly suitable for traders who look to take advantage of overvalued scenarios or protect themselves against sudden downward moves.
5. Deviation from fair value
Under this system, the script judges how far the current price may have strayed from what is considered typical, taking into account normal fluctuations. If the asset appears to be trading at an unusually low level compared to that reference, it is flagged as bullish. If it seems abnormally high, a bearish signal is issued. This can be applied in various market environments to seek opportunities that arise from perceived mispricing.
6. Percentile channel valuation
In this mode, the script determines where an asset's price stands within a historical distribution, highlighting whether it has reached unusually high or low territory compared to its recent past. When the price reaches what is deemed an extreme reading, it may indicate that a reversal is more likely. This approach is often used by traders who watch for statistical outliers and potential reversion to a more typical trading range.
7. ATH valuation
This technique involves comparing an asset's current price with its previously recorded peak values. The script then interprets whether the price is positioned so far below the all-time high that it looks discounted, or so close to that high that it could be overextended. Such perspective is favored by market participants who want to see if an asset still has ample room to climb before matching historic extremes, or if it is nearing a possible ceiling.
8. Z-score system
Here, the script measures how far above or below a standard reference average an asset's price may be, translated into standardized units. Substantial negative readings can suggest a price that might be unusually weak, prompting a bullish indication, while large positive readings could signal overextension and lead to a bearish call. This method is useful for traders watching for abrupt deviations from a norm that often invite a reversion to more balanced levels.
RSI Divergence Period
This input is particularly relevant for the RSI - Long Only and RSI - Short Only modes. The period determines how many bars in the past you compare RSI values to detect any divergences.
------------------------------------------------------------------------
Diversification Method
Once the script has determined a bullish, bearish, or neutral stance for each asset, it then calculates how to distribute capital among all included assets. The diversification method sets the weighting logic.
1. None
Gives each asset an equal weight. For example, if you have five included assets, each might get 20 percent. This is a simple baseline.
2. Risk-Adjusted Expected Return Using Volatility Clustering
Emphasizes each asset’s average returns relative to its observed risk or volatility tendencies. Assets that exhibit good risk-adjusted returns combined with moderate or lower volatility may receive higher weights than more volatile or less appealing assets. This helps steer capital toward assets that have historically provided a better ratio of return to risk.
3. Relative Strength
Allocates more capital to assets that show stronger price strength compared to a reference (for example, price above a long-term moving average plus a higher RSI). Assets in clear uptrends may be given higher allocations.
4. Trend-Following Indicators
Examines trend-based signals, like positive momentum measurements or upward-trending strength indicators, to assign more weight to assets demonstrating strong directional moves. This suits those who prefer to latch onto trending markets.
5. Volatility-Adjusted Momentum
Looks for assets that have strong price momentum but relatively subdued volatility. The script tends to reward assets that are trending well yet are not too volatile, aiming for stable upward performance rather than massive swings.
6. Correlation-Based Risk Parity
Attempts to weight assets in such a way that the overall portfolio risk is more balanced. Although it is not an advanced correlation matrix approach in a strict sense, it conceptually scales each asset’s weight so no single outlier heavily dominates.
7. Omega Ratio Maximization
Gives preference to assets with higher omega ratios. This ratio can be interpreted as the probability-weighted gains versus losses. Assets with a favorable skew are given more capital.
8. Liquidity-Weighted Valuation
Considers each asset’s average trading liquidity, such as the combination of volume and price. More liquid assets typically receive a higher allocation because they can be entered or exited with lower slippage. If the trading system signals bullishness, that can further boost the allocation, and if it signals bearishness, the allocation might be set to zero or reduced drastically.
9. Drawdown-Controlled Allocation (DCA)
Examines each asset’s maximum drawdown over a recent window. Assets experiencing lighter drawdowns (thus indicating somewhat less downside volatility) receive higher allocations, aiming for a smoother overall equity curve.
------------------------------------------------------------------------
Portfolio and Allocation Settings
Portfolio Value
Defines how much total capital is available for the strategy-based investment portion. For example, if set to 10,000, then each asset’s monetary allocation is determined by the percentage weighting times 10,000.
Use Fixed Allocation
When enabled, the script calculates the initial allocation percentages after 50 bars of data have passed. It then locks those percentages for the remainder of the backtest or real-time session. This feature allows traders to test a static weighting scenario to see how it differs from recalculating weights at each bar.
------------------------------------------------------------------------
HODL Simulator
The script has a separate simulation that accumulates positions in an asset whenever it appears to be recovering from an undervalued state. This parallel tracking is intended to contrast a simple buy-and-hold approach with the more adaptive allocation methods used elsewhere in the script.
HODL Buy Quantity
Each time an asset transitions from an undervalued state to a recovery phase, the simulator executes a purchase of a predefined quantity. For example, if set to 0.5 units, the system will accumulate this amount whenever conditions indicate a shift away from undervaluation.
HODL Buy Threshold
This parameter determines the level at which the simulation identifies an asset as transitioning out of an undervalued state. When the asset moves above this threshold after previously being classified as undervalued, a buy order is triggered. Over time, the performance of these accumulated positions is tracked, allowing for a comparison between this passive accumulation method and the more dynamic allocation strategy.
------------------------------------------------------------------------
Asset Table and Display Settings
The script displays data in multiple tables directly on your chart. You can toggle these tables on or off and position them in various corners of your TradingView screen.
Asset Info Table Position
This table provides key details for each included asset, displaying:
Symbol – Identifies the trading pair being monitored. This helps users keep track of which assets are included in the portfolio allocation process.
Current Trading Signal – Indicates whether the asset is in a bullish, bearish, or neutral state based on the selected trading system. This assists in quickly identifying which assets are showing potential trade opportunities.
Volatility Approximation – Represents the asset’s historical price fluctuations. Higher volatility suggests greater price swings, which can impact risk management and position sizing.
Liquidity Estimate – Reflects the asset’s market liquidity, often based on trading volume and price activity. More liquid assets tend to have lower transaction costs and reduced slippage, making them more favorable for active strategies.
Risk-Adjusted Return Value – Measures the asset’s returns relative to its risk level. This helps in determining whether an asset is generating efficient returns for the level of volatility it experiences, which is useful when making allocation decisions.
2. Strategy Allocation Table Position
Displays how your selected diversification method converts each asset into an allocation percentage. It also shows how much capital is being invested per asset, the cumulative return, standard performance metrics (for example, Sharpe ratio), and the separate HODL return percentage.
Symbol – Displays the asset being analyzed, ensuring clarity in allocation distribution.
Allocation Percentage – Represents the proportion of total capital assigned to each asset. This value is determined by the selected diversification method and helps traders understand how funds are distributed within the portfolio.
Investment Amount – Converts the allocation percentage into a dollar value based on the total portfolio size. This shows the exact amount being invested in each asset.
Cumulative Return – Tracks the total return of each asset over time, reflecting how well it has performed since the strategy began.
Sharpe Ratio – Evaluates the asset’s return in relation to its risk by comparing excess returns to volatility. A higher Sharpe ratio suggests a more favorable risk-adjusted performance.
Sortino Ratio – Similar to the Sharpe ratio, but focuses only on downside risk, making it more relevant for traders who prioritize minimizing losses.
Omega Ratio – Compares the probability of achieving gains versus losses, helping to assess whether an asset provides an attractive risk-reward balance.
Maximum Drawdown – Measures the largest percentage decline from an asset’s peak value to its lowest point. This metric helps traders understand the worst-case loss scenario.
HODL Return Percentage – Displays the hypothetical return if the asset had been bought and held instead of traded actively, offering a direct comparison between passive accumulation and the active strategy.
3. Profit Table
If the Profit Table is activated, it provides a summary of the actual dollar-based gains or losses for each asset and calculates the overall profit of the system. This table includes separate columns for profit excluding HODL and the combined total when HODL gains are included. As seen in the image below, this allows users to compare the performance of the active strategy against a passive buy-and-hold approach. The HODL profit percentage is derived from the Portfolio Value input, ensuring a clear comparison of accumulated returns.
4. Best Performing Asset Table
Focuses on the single highest-returning or highest-profit asset at that moment. It highlights the symbol, the asset’s cumulative returns, risk metrics, and other relevant stats. This helps identify which asset is currently outperforming the rest.
5. Most Profitable Asset
A simpler table that underscores the asset producing the highest absolute dollar profit across the portfolio.
------------------------------------------------------------------------
Multi Asset Selection
You can include up to ten different assets (such as BTCUSDT, ETHUSDT, ADAUSDT, and so on) in this script. Each asset has two inputs: one to enable or disable its inclusion, and another to select its trading pair symbol. Once you enable an asset, the script requests the relevant market data from TradingView.
------------------------------------------------------------------------
Uniqness and Features
1. Multiple Data Fetches
Each asset is pulled from the chart’s timeframe, along with various metrics such as RSI, volatility approximations, and trend indicators.
2. Various Risk and Performance Metrics
The script internally keeps track of different measures, like Sharpe ratio (a measure of average return adjusted for risk), Sortino ratio (which focuses on downside volatility), Omega ratio, and maximum drawdown. These metrics feed into the strategy allocation table, helping you quickly assess the risk-and-return profile of each asset.
3. Real-Time Tables
Instead of having to set up complex spreadsheets or external dashboards, the script updates all tables on every new bar. The color schemes in these tables are designed to draw attention to bullish or bearish signals, positive or negative returns, and so forth.
4. HODL Comparison
You can visually compare the active strategy’s results to a separate continuous buy-on-dips accumulation strategy. This allows for insight into whether your dynamic approach truly beats a simpler, more patient method.
5. Locking Allocations
The Use Fixed Allocation input is convenient for those who want to see how holding a fixed distribution of capital performs over time. It helps in distinguishing between constant rebalancing vs a fixed, set-and-forget style.
------------------------------------------------------------------------
How to use
1. Add the Script to Your Chart
Once added, open the settings panel to configure your asset list, choose a trading system, and select the diversification approach.
2. Select Assets
Pick up to ten symbols to monitor. Disable any you do not want included. Each included asset is then handled for signals, diversification, and performance metrics.
3. Choose Trading System
Decide if you prefer RSI-based signals, a fair-value approach, or a percentile-based method, among others. The script will then flag assets as bullish, bearish, or neutral according to that selection.
4. Pick a Diversification Method
For example, you might choose Trend-Following Indicators if you believe momentum stocks or cryptocurrencies will continue their trends. Or you could use the Omega Ratio approach if you want to reward assets that have had a favorable upside probability.
5. Set Portfolio Value and HODL Parameters
Enter how much capital you want to allocate in total (for the dynamic strategy) and adjust HODL buy quantities and thresholds as desired. (HODL Profit % is calculated from the Portfolio Value)
6. Inspect the Tables
On the chart, the script can display multiple tables showing your allocations, returns, risk metrics, and which assets are leading or lagging. Monitor these to make decisions about capital distribution or see how the strategy evolves.
------------------------------------------------------------------------
Additional Remarks
This script aims to simplify multi-asset portfolio management in a single tool. It emphasizes user-friendliness by color-coding the data in tables, so you do not need extra spreadsheets. The script is also flexible in letting you lock allocations or compare dynamic updates.
Always remember that no script can guarantee profitable outcomes. Real markets involve unpredictability, and real trading includes fees, slippage, and liquidity constraints not fully accounted for here. The script uses real-time and historical data for demonstration and educational purposes, providing a testing environment for various systematic strategies.
Performance Considerations
Due to the complexity of this script, users may experience longer loading times, especially when handling multiple assets or using advanced allocation methods. In some cases, calculations may time out if too many settings are adjusted simultaneously. If this occurs, removing and reapplying the indicator to the chart can help reset the process. Additionally, it is recommended to configure inputs gradually instead of adjusting all parameters at once, as excessive changes can extend the script’s loading duration beyond TradingView’s processing limits.
------------------------------------------------------------------------
Originality
This script stands out by integrating multiple asset management techniques within a single indicator, eliminating the need for multiple scripts or external portfolio tools. Unlike traditional single-asset strategies, it simultaneously evaluates multiple assets, applies systematic allocation logic, and tracks risk-adjusted performance in real time. The script is designed to function within TradingView’s script limitations while still allowing for complex portfolio simulations, making it an efficient tool for traders managing diverse holdings. Additionally, its combination of systematic trading signals with allocation-based diversification provides a structured approach to balancing exposure across different market conditions. The dynamic interplay between adaptive trading strategies and passive accumulation further differentiates it from conventional strategy indicators that focus solely on directional signals without considering capital allocation.
Conclusion
Uptrick: Portfolio Allocation Diversification pulls multiple assets into one efficient workflow, where each asset’s signal, volatility, and performance is measured, then assigned a share of capital according to your selected diversification method. The script accommodates both dynamic rebalancing and a locked allocation style, plus an ongoing HODL simulation for passive accumulation comparison. It neatly visualizes the entire process through on-chart tables that are updated every bar.
Traders and investors looking for ways to manage multiple assets under one unified framework can explore the different modules within this script to find what suits their style. Users can quickly switch among trading systems, vary the allocation approach, or review side-by-side performance metrics to see which method aligns best with their risk tolerance and market perspective.
