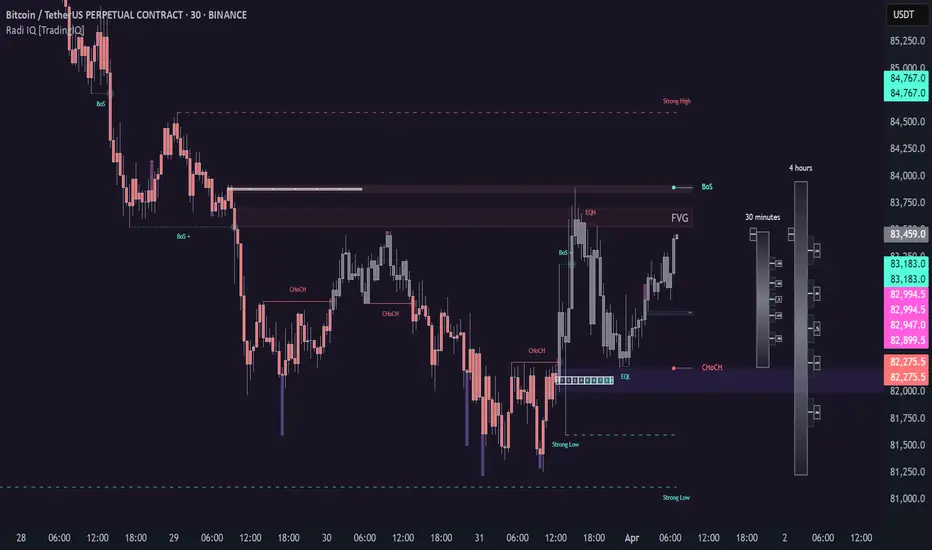
Fair Value MSThis indicator introduces rigid rules to familiar concepts to better capture and visualize Market Structure and Areas of Support and Resistance in a way that is both rule-based and reactive to market movements.
Typical "Market Structure" or "Zig-Zag" methods determine swing points based on fixed thresholds (length or percentage). While this does provide rigid structure, the results may be lagging or confusing due to the timing, since it is fixed to static parameters.
I believe the concept of Fair Value Gaps can solve this problem.
As you will notice, there are no length settings in this indicator.
> FVG Market Structure
Fair Value Gaps are a well known concept used to indicate directional intent, forming when price moves aggressively in one direction, leaving behind an imbalance between buyers and sellers. While the term FVG was popularized by ICT, the underlying concept predates them, known historically as imbalances, inefficiencies, or liquidity voids in institutional trading.
Note: For simplicity, in this indicator they'll be called FVGs.
By reading into this, we are able to clearly and rigidly define market structure simply by "looking" at the chart, using objective price events rather than subjective interpretation, or lengths.
By using FVGs to determine structure direction, the length, and speed of identification lies entirely on the market. If an FVG Down occurs immediately after a New Higher High forms, it is reasonable to assume there was a seller at that point, so the script would indicate a New Swing High.
The script is NOT stuck, waiting for a % retrace, or # bars to pass to identify it as such.
Sometimes the market is in a steady trend in a single direction and no FVGs form; therefore, no structure forms. -> Why would we try to impose structure on a clear trend?
Ultimately, the FVG Structure Method uses real reactions from the market to determine Market structure, and is not fixed to specific parameters.
As with other market structure indicators, "Market Structure Breaks" are still identifiable when price moves outside the most recent swing points.
These are helpful to indicate larger direction. In the following section you will see how these help us determine when we should start the search for an "Area of Interest (AOI)".
> Areas of Interest (AOIs)
"Area of Interest (AOI)" is a generalized term, and could refer to many types of zones you might recognize under different names. While the AOIs in this indicator are specialized in their own way, I have chosen to simply use the term "Area of Interest" because it’s more important to understand how they behave and why they exist than to focus on what they’re called.
The goal of an AOI is to point out reasonable areas where buyers or sellers may be staging, as is typical with support and resistance.
In order to reasonably identify these areas, we look for cause and effect relationships. When considering these relationships, it's easier to understand the placement of the points to define each zone.
(Buyer Examples)
Cause: Strong Buyers step in at Swing Low
Effect: Fair Value Gap Forms
Cause: Sustained Buying Pressure
Effect: Market Structure Breaks
In this example, The zone is drawn from the Swing Low, to the Bottom of the FVG closest to the swing point.
In theory, the participation at the swing point was strong and aggressive enough to create the FVG imbalance. Which then found acceptance and continued into a Market Structure Break. So with these AOIs, we are trying to locate the aggressive Buyers or Sellers which were positioned BEFORE the FVG.
These Zones are intended to act as areas to look for reactions from market participants, to judge where price may be going. When revisiting these zones, we look for a reaction or a break, to further provide us information to if the buyers or sellers are still there.
As seen in the screenshot above, The information we gain is not from the creation of these zones, but from the behavior we witness when these zones are revisited.
Technical Note: In this indicator, Market Structure Breaks are only considered when price closes outside the recent swing points. Wicks are not considered as confirmation, therefore are not used to detect structural breaks.
Inside each AOI you can optionally display a readout of the volume which accumulated during the time starting at the swing point and going until the closing bar of the FVG.
Note: We are counting volume until the closing bar of the FVG since the FVG is a 3 bar formation, and aggressive volume is required throughout to create the imbalance.
There are multiple FVGs that typically occur in a single direction, but we do not look to every single one to be indicative of structure, only the first FVG in the opposite direction of the previous direction (which is determined by previous FVGs)
You will probably notice, the AOIs do not form from the closest swing or FVG to the break, this is because we are targeting larger directional changes to draw these AOIs from.
Since they do not always happen perfectly every time, the AOI formation waits for an FVG to occur AND a Market structure break to happen. One without the other will result in no Zone displaying.
> Reflection Lines
While they may seem slightly redundant, Reflection Lines serve as reminders of previous support and resistance pivots. They are drawn at the same Pivots where and AOI is formed, and extend beyond the mitigation of the AOI.
These lines are often points of price to look for "Support Flips", a re-test pattern where price trades through previous support (or resistance) then returns to it and rejects, continuing into a larger move or trend.
Their namesake is based on the behavior of price, "reflecting" at these levels.
The Reflection lines are simple and change color based on price's location.
If price is above, we would typically look to a reflection line in with support in mind.
As a basic filter, these lines use an average price to determine their color, this way they will not change their color as frequently in choppy situations.
> Session Start/End Lines
For analysis purposes and trade review, it is helpful to analyze with context.
For that reason, I have implemented start and end session lines into the indicator, these are helpful when reviewing historical charts to not provide additional context.
By default, they are set to the NYSE Session, but can be changed to fit any needs.
These lines are not advanced, and simply draw a line as the chart passes the start and end of the sessions. It's very likely that you may need to adjust the session for your specific needs.
Note: The Timezone can be adjusted within the code if needed. By Default, the indicator uses "America/New_York" Timezone.
> Conclusion
If you’ve ever felt like your structure tools were confusing or lagging, drawing zones too late, or zones that simply don't make sense, this should feel like a breath of fresh air.
By removing arbitrary length settings and instead using FVGs to define structure and as a basis for AOIs, you're getting a more accurate look at what price is doing and where it's reacting from.
This indicator is rule-based, reactive, and aims to keep things logical without fluff or false confidence.
Enjoy!
Marketstructure

Ultimate Market Structure [Alpha Extract]Ultimate Market Structure
A comprehensive market structure analysis tool that combines advanced swing point detection, imbalance zone identification, and intelligent break analysis to identify high-probability trading opportunities.Utilizing a sophisticated trend scoring system, this indicator classifies market conditions and provides clear signals for structure breaks, directional changes, and fair value gap detection with institutional-grade precision.
🔶 Advanced Swing Point Detection
Identifies pivot highs and lows using configurable lookback periods with optional close-based analysis for cleaner signals. The system automatically labels swing points as Higher Highs (HH), Lower Highs (LH), Higher Lows (HL), and Lower Lows (LL) while providing advanced classifications including "rising_high", "falling_high", "rising_low", "falling_low", "peak_high", and "valley_low" for nuanced market analysis.
swingHighPrice = useClosesForStructure ? ta.pivothigh(close, swingLength, swingLength) : ta.pivothigh(high, swingLength, swingLength)
swingLowPrice = useClosesForStructure ? ta.pivotlow(close, swingLength, swingLength) : ta.pivotlow(low, swingLength, swingLength)
classification = classifyStructurePoint(structureHighPrice, upperStructure, true)
significance = calculateSignificance(structureHighPrice, upperStructure, true)
🔶 Significance Scoring System
Each structure point receives a significance level on a 1-5 scale based on its distance from previous points, helping prioritize the most important levels. This intelligent scoring system ensures traders focus on the most meaningful structure breaks while filtering out minor noise.
🔶 Comprehensive Trend Analysis
Calculates momentum, strength, direction, and confidence levels using volatility-normalized price changes and multi-timeframe correlation. The system provides real-time trend state tracking with bullish (+1), bearish (-1), or neutral (0) direction assessment and 0-100 confidence scoring.
// Calculate trend momentum using rate of change and volatility
calculateTrendMomentum(lookback) =>
priceChange = (close - close ) / close * 100
avgVolatility = ta.atr(lookback) / close * 100
momentum = priceChange / (avgVolatility + 0.0001)
momentum
// Calculate trend strength using multiple timeframe correlation
calculateTrendStrength(shortPeriod, longPeriod) =>
shortMA = ta.sma(close, shortPeriod)
longMA = ta.sma(close, longPeriod)
separation = math.abs(shortMA - longMA) / longMA * 100
strength = separation * slopeAlignment
❓How It Works
🔶 Imbalance Zone Detection
Identifies Fair Value Gaps (FVGs) between consecutive candles where price gaps create unfilled areas. These zones are displayed as semi-transparent boxes with optional center line mitigation tracking, highlighting potential support and resistance levels where institutional players often react.
// Detect Fair Value Gaps
detectPriceImbalance() =>
currentHigh = high
currentLow = low
refHigh = high
refLow = low
if currentOpen > currentClose
if currentHigh - refLow < 0
upperBound = currentClose - (currentClose - refLow)
lowerBound = currentClose - (currentClose - currentHigh)
centerPoint = (upperBound + lowerBound) / 2
newZone = ImbalanceZone.new(
zoneBox = box.new(bar_index, upperBound, rightEdge, lowerBound,
bgcolor=bullishImbalanceColor, border_color=hiddenColor)
)
🔶 Structure Break Analysis
Determines Break of Structure (BOS) for trend continuation and Directional Change (DC) for trend reversals with advanced classification as "continuation", "reversal", or "neutral". The system compares pre-trend and post-trend states for each break, providing comprehensive trend change momentum analysis.
🔶 Intelligent Zone Management
Features partial mitigation tracking when price enters but doesn't fully fill zones, with automatic zone boundary adjustment during partial fills. Smart array management keeps only recent structure points for optimal performance while preventing duplicate signals from the same level.
🔶 Liquidity Zone Detection
Automatically identifies potential liquidity zones at key structure points for institutional trading analysis. The system tracks broken structure points and provides adaptive zone extension with configurable time-based limits for imbalance areas.
🔶 Visual Structure Mapping
Provides clear visual indicators including swing labels with color-coded significance levels, dashed lines connecting break points with BOS/DC labels, and break signals for continuation and reversal patterns. The adaptive zones feature smart management with automatic mitigation tracking.
🔶 Market Structure Interpretation
HH/HL patterns indicate bullish market structure with trend continuation likelihood, while LH/LL patterns signal bearish structure with downtrend continuation expected. BOS signals represent structure breaks in trend direction for continuation opportunities, while DC signals warn of potential reversals.
🔶 Performance Optimization
Automatic cleanup of old structure points (keeps last 8 points), recent break tracking (keeps last 5 break events), and efficient array management ensure smooth performance across all timeframes and market conditions.
Why Choose Ultimate Market Structure ?
This indicator provides traders with institutional-grade market structure analysis, combining multiple analytical approaches into one comprehensive tool. By identifying key structure levels, imbalance zones, and break patterns with advanced significance scoring, it helps traders understand market dynamics and position themselves for high-probability trade setups in alignment with smart money concepts. The sophisticated trend scoring system and intelligent zone management make it an essential tool for any serious trader looking to decode market structure with precision and confidence.

Apex Edge - RSI Trend LinesThe Apex Edge - RSI Trend Lines indicator is a precision tool that automatically draws real-time trendlines on the RSI oscillator using confirmed pivot highs and lows. These dynamic trendlines track RSI structure in motion, helping you anticipate breakout zones, reversals, and hidden divergences.
Every time a new pivot forms, the indicator automatically re-draws the RSI trendline between the two most recent pivots — giving you an always-current view of momentum structure. You’ll instantly see when RSI begins compressing or expanding, long before price reacts.
Key Features: • Dynamic RSI trendlines drawn from the last 2 pivots
• Auto re-draws in real-time as new pivots form
• Optional "Full Extend" or "Pivot Only" modes
• Slope color-coded: green = support, red = resistance
• Built-in dotted RSI levels (30/70 default)
• Alert conditions for RSI trendline breakout signals
• Ideal for spotting divergence, compression, and early SMC confluence
This is not your average RSI — it’s a fully reactive momentum edge overlay designed to give you clarity, structure, and timing from within the oscillator itself. Perfect for traders using Smart Money Concepts, divergence setups, or algorithmic trend tracking.
⚔️ Built for precision. Built for edge. Built for Apex.

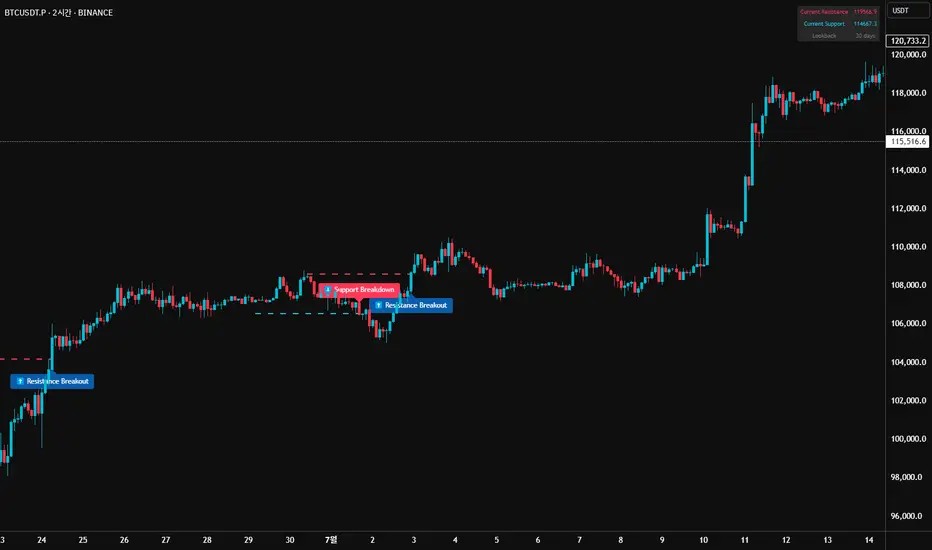
52SIGNAL RECIPE Market Structure Reversal Signals═══ 52SIGNAL RECIPE Market Structure Reversal Signals ═══
◆ Overview
52SIGNAL RECIPE Market Structure Reversal Signals is a technical indicator designed to detect structural changes in price charts and identify potential trend reversals. By tracking highs and lows over a specified period, this indicator provides clear visual signals when significant price breakouts occur, helping traders capture directional changes in the market early.
─────────────────────────────────────
◆ Key Features
• Structural Reversal Detection: Provides potential trend change signals when price breaks through recent N-day highs/lows
• Duplicate Signal Prevention: Filters out consecutive signals in the same direction
• Intuitive Visualization: Clearly distinguishes bullish/bearish reversal signals by color and position on the chart
• Confirmed Bar Based: Generates signals only after bars are completely closed, enhancing reliability
• Customizable Settings: Adjustable tracking period to optimize for various market environments and timeframes
─────────────────────────────────────
◆ Technical Foundation
■ Market Structure Analysis Principle
• High/Low Tracking: Identifies previous highs (LH) and lows (HL) over the specified period
• Structural Breakout: Interprets as structural change when closing price breaks above previous high or below previous low
• Confirmed Bar Verification: Minimizes false signals by generating signals only after the current bar has completely closed
■ Signal Filtering Mechanism
• Signal State Tracking: Prevents duplicate signals by tracking the direction of the last generated signal
• Directional Change Focus: Suppresses signals in the same direction until an opposite signal occurs
• Noise Reduction: Focuses only on important level breakouts, eliminating unnecessary signals
─────────────────────────────────────
◆ Practical Applications
■ Trend Reversal Point Identification
• Bullish Trend Starting Point:
▶ When bullish reversal signal occurs after a downtrend
▶ When upward momentum is confirmed by breaking previous high
• Bearish Trend Starting Point:
▶ When bearish reversal signal occurs after an uptrend
▶ When downward momentum is confirmed by breaking below previous low
• Range Breakout Detection:
▶ Potential trend formation signals when breaking upper/lower boundaries in a ranging market
■ Trading Strategy Application
• Trend Following Strategy:
▶ Consider buy entry when bullish reversal signal occurs
▶ Consider sell entry when bearish reversal signal occurs
• Reversal Trading:
▶ Signals occurring at support/resistance levels provide high-probability entry points
▶ Reversal signals in overbought/oversold conditions strengthen trend reversal possibility
• Risk Management:
▶ Consider closing or reducing positions when opposite signals occur
▶ Set precise stop-loss points by combining with key technical levels
─────────────────────────────────────
◆ Advanced Setting Options
■ Tracking Period (N-day) Adjustment
• Short-term Setting: 10-15 days (sensitive signals, quick reaction, suitable for short-term trading)
• Medium-term Setting: 20-30 days (balanced signals, general trend detection, recommended default)
• Long-term Setting: 40-50 days (strong filtering, detects only major trend reversals, suitable for long-term investment)
■ Timeframe Optimization
• Daily Chart: 20-30 day setting (medium-term trend change detection)
• 4-Hour Chart: 30-40 setting (short-term swing trading signals)
• Hourly Chart: 40-50 setting (intraday trend change detection)
• Intraday Chart: 10-20 setting (scalping and short-term trading)
■ Market Type Adjustment
• High Volatility Markets: Higher N values (30-50) to filter noise
• Trending Markets: Medium N values (20-30) to capture only major reversals
• Ranging Markets: Lower N values (10-20) to capture range-bound movements
─────────────────────────────────────
◆ Synergy with Other Indicators
• Moving Averages: Signal strength enhanced when Market Structure Reversal Signals align with key moving average crossovers
• RSI: Market Structure Reversal Signals occurring at overbought/oversold levels increase reversal probability
• Volume Indicators: Market Structure Reversal Signals accompanied by high volume enhance reliability
• Fibonacci Levels: Market Structure Reversal Signals occurring at key Fibonacci levels provide important turning points
• Channel Indicators: Powerful breakout confirmation when price channel upper/lower breakthroughs coincide with Market Structure Reversal Signals
─────────────────────────────────────
◆ Conclusion
52SIGNAL RECIPE Market Structure Reversal Signals objectively identifies structural changes in the market and clearly visualizes potential trend reversal points. Its simple yet powerful approach of detecting directional changes through recent N-day high/low breakouts provides flexibility applicable to various market environments and trading styles. The duplicate signal prevention mechanism and confirmed bar-based signal generation greatly enhance signal quality and reliability. When combined with other technical indicators, synergy effects can be maximized, providing traders with a valuable tool to capture market turning points early.
─────────────────────────────────────
※ Disclaimer: Past performance does not guarantee future results. Always use appropriate risk management strategies.
═══ 52SIGNAL RECIPE Market Structure Reversal Signals ═══
◆ 개요
52SIGNAL RECIPE Market Structure Reversal Signals는 가격 차트의 구조적 변화를 감지하여 잠재적인 추세 반전을 식별하는 기술적 지표입니다. 이 지표는 최근 N일 동안의 고점과 저점을 추적하여 의미 있는 가격 돌파가 발생할 때 명확한 시각적 신호를 제공함으로써, 트레이더가 시장의 방향성 변화를 조기에 포착할 수 있도록 도와줍니다.
─────────────────────────────────────
◆ 주요 특징
• 구조적 반전 탐지: 가격이 최근 N일 고점/저점을 돌파할 때 잠재적 추세 변화 신호 제공
• 중복 신호 방지: 동일한 방향의 신호가 연속으로 반복되지 않도록 필터링
• 직관적인 시각화: 상승/하락 반전 신호를 차트 상에서 색상과 위치로 명확히 구분
• 확정 봉 기반: 봉이 완전히 종료된 후에만 신호 생성하여 신뢰도 향상
• 사용자 정의 설정: 추적 기간을 조정하여 다양한 시장 환경과 타임프레임에 최적화 가능
─────────────────────────────────────
◆ 기술적 기반
■ 시장 구조 분석 원리
• 고점/저점 추적: 지정된 기간 동안의 이전 고점(LH)과 저점(HL) 식별
• 구조적 돌파: 종가가 이전 고점을 상향 돌파하거나 이전 저점을 하향 돌파할 때 구조적 변화로 해석
• 확정 봉 검증: 현재 봉이 완전히 종료된 후에만 신호 생성하여 오신호 최소화
■ 신호 필터링 메커니즘
• 신호 상태 저장: 마지막 생성된 신호의 방향을 추적하여 동일 방향 신호 중복 방지
• 방향성 전환 초점: 반대 방향 신호가 발생할 때까지 동일 방향 신호 억제
• 노이즈 감소: 중요 수준 돌파에만 집중하여 불필요한 신호 제거
─────────────────────────────────────
◆ 실용적 응용
■ 추세 전환점 식별
• 상승 추세 시작점:
▶ 하락 추세 후 상승 반전 신호 발생 시
▶ 이전 고점 돌파로 상승 모멘텀 확인 시
• 하락 추세 시작점:
▶ 상승 추세 후 하락 반전 신호 발생 시
▶ 이전 저점 이탈로 하락 모멘텀 확인 시
• 범위 돌파 감지:
▶ 횡보 시장에서 상/하 경계 돌파 시 잠재적 추세 형성 신호
■ 트레이딩 전략 적용
• 추세 추종 전략:
▶ 상승 반전 신호 발생 시 매수 진입 고려
▶ 하락 반전 신호 발생 시 매도 진입 고려
• 반전 트레이딩:
▶ 지지/저항 수준에서 반전 신호 발생 시 높은 확률의 진입점 제공
▶ 과매수/과매도 상태에서의 반전 신호는 추세 전환 가능성 강화
• 리스크 관리:
▶ 반대 방향 신호 발생 시 포지션 종료 또는 축소 고려
▶ 주요 기술적 수준과 결합하여 정밀한 손절점 설정 가능
─────────────────────────────────────
◆ 고급 설정 옵션
■ 추적 기간(N일) 조정
• 단기 설정: 10-15일 (민감한 신호, 빠른 반응, 단기 트레이딩에 적합)
• 중기 설정: 20-30일 (균형 잡힌 신호, 일반적 추세 감지, 기본 권장)
• 장기 설정: 40-50일 (강한 필터링, 주요 추세 전환만 감지, 장기 투자에 적합)
■ 타임프레임별 최적화
• 일봉 차트: 20-30일 설정 (중기 추세 변화 감지)
• 4시간 차트: 30-40 설정 (단기 스윙 트레이딩 신호)
• 시간봉 차트: 40-50 설정 (일중 추세 변화 감지)
• 일중 차트: 10-20 설정 (스캘핑 및 단기 거래)
■ 시장 유형별 조정
• 변동성 높은 시장: 높은 N값 (30-50) 설정으로 노이즈 필터링
• 추세 시장: 중간 N값 (20-30) 설정으로 주요 반전만 포착
• 횡보 시장: 낮은 N값 (10-20) 설정으로 범위 내 움직임 포착
─────────────────────────────────────
◆ 다른 지표와의 시너지
• 이동평균선: Market Structure Reversal Signals 신호와 주요 이동평균선 교차 지점이 일치할 때 신호 강화
• RSI: 과매수/과매도 수준에서의 Market Structure Reversal Signals 신호는 반전 가능성 높임
• 볼륨 지표: 높은 볼륨과 함께 발생하는 Market Structure Reversal Signals 신호는 신뢰도 향상
• 피보나치 레벨: 주요 피보나치 레벨에서 발생하는 Market Structure Reversal Signals 신호는 중요한 전환점 제공
• 채널 지표: 가격 채널의 상단/하단 돌파와 Market Structure Reversal Signals 신호 일치 시 강력한 돌파 확인
─────────────────────────────────────
◆ 결론
52SIGNAL RECIPE Market Structure Reversal Signals는 시장의 구조적 변화를 객관적으로 식별하여 잠재적인 추세 전환점을 명확하게 시각화합니다. 최근 N일 고점/저점 돌파를 통해 방향성 변화를 감지하는 단순하면서도 강력한 접근 방식은 다양한 시장 환경과 트레이딩 스타일에 적용할 수 있는 유연성을 제공합니다. 중복 신호 방지 메커니즘과 확정 봉 기반 신호 생성은 신호의 품질과 신뢰성을 크게 향상시킵니다. 다른 기술적 지표와 결합하여 사용할 때 시너지 효과를 극대화할 수 있으며, 트레이더에게 시장의 전환점을 조기에 포착할 수 있는 귀중한 도구를 제공합니다.
─────────────────────────────────────
※ 면책 조항: 과거 성과가 미래 결과를 보장하지 않습니다. 항상 적절한 리스크 관리 전략을 사용하세요.
Liquidity Break Probability [PhenLabs]📊 Liquidity Break Probability
Version: PineScript™ v6
The Liquidity Break Probability indicator revolutionizes how traders approach liquidity levels by providing real-time probability calculations for level breaks. This advanced indicator combines sophisticated market analysis with machine learning inspired probability models to predict the likelihood of high/low breaks before they happen.
Unlike traditional liquidity indicators that simply draw lines, LBP analyzes market structure, volume profiles, momentum, volatility, and sentiment to generate dynamic break probabilities ranging from 5% to 95%. This gives traders unprecedented insight into which levels are most likely to hold or break, enabling more confident trading decisions.
🚀 Points of Innovation
Advanced 6-factor probability model weighing market structure, volatility, volume, momentum, patterns, and sentiment
Real-time probability updates that adjust as market conditions change
Intelligent trading style presets (Scalping, Day Trading, Swing Trading) with optimized parameters
Dynamic color-coded probability labels showing break likelihood percentages
Professional tiered input system - from quick setup to expert-level customization
Smart volume filtering that only highlights levels with significant institutional interest
🔧 Core Components
Market Structure Analysis: Evaluates trend alignment, level strength, and momentum buildup using EMA crossovers and price action
Volatility Engine: Incorporates ATR expansion, Bollinger Band positioning, and price distance calculations
Volume Profile System: Analyzes current volume strength, smart money proxies, and level creation volume ratios
Momentum Calculator: Combines RSI positioning, MACD strength, and momentum divergence detection
Pattern Recognition: Identifies reversal patterns (doji, hammer, engulfing) near key levels
Sentiment Analysis: Processes fear/greed indicators and market breadth measurements
🔥 Key Features
Dynamic Probability Labels: Real-time percentage displays showing break probability with color coding (red >70%, orange >50%, white <50%)
Trading Style Optimization: One-click presets automatically configure sensitivity and parameters for your trading timeframe
Professional Dashboard: Live market state monitoring with nearest level tracking and active level counts
Smart Alert System: Customizable proximity alerts and high-probability break notifications
Advanced Level Management: Intelligent line cleanup and historical analysis options
Volume-Validated Levels: Only displays levels backed by significant volume for institutional-grade analysis
🎨 Visualization
Recent Low Lines: Red lines marking validated support levels with probability percentages
Recent High Lines: Blue lines showing resistance zones with break likelihood indicators
Probability Labels: Color-coded percentage labels that update in real-time
Professional Dashboard: Customizable panel showing market state, active levels, and current price
Clean Display Modes: Toggle between active-only view for clean charts or historical view for analysis
📖 Usage Guidelines
Quick Setup
Trading Style Preset
Default: Day Trading
Options: Scalping, Day Trading, Swing Trading, Custom
Description: Automatically optimizes all parameters for your preferred trading timeframe and style
Show Break Probability %
Default: True
Description: Displays percentage labels next to each level showing break probability
Line Display
Default: Active Only
Options: Active Only, All Levels
Description: Choose between clean active-only view or comprehensive historical analysis
Level Detection Settings
Level Sensitivity
Default: 5
Range: 1-20
Description: Lower values show more levels (sensitive), higher values show fewer levels (selective)
Volume Filter Strength
Default: 2.0
Range: 0.5-5.0
Description: Controls minimum volume threshold for level validation
Advanced Probability Model
Market Trend Influence
Default: 25%
Range: 0-50%
Description: Weight given to overall market trend in probability calculations
Volume Influence
Default: 20%
Range: 0-50%
Description: Impact of volume analysis on break probability
✅ Best Use Cases
Identifying high-probability breakout setups before they occur
Determining optimal entry and exit points near key levels
Risk management through probability-based position sizing
Confluence trading when multiple high-probability levels align
Scalping opportunities at levels with low break probability
Swing trading setups using high-probability level breaks
⚠️ Limitations
Probability calculations are estimations based on historical patterns and current market conditions
High-probability setups do not guarantee successful trades - risk management is essential
Performance may vary significantly across different market conditions and asset classes
Requires understanding of support/resistance concepts and probability-based trading
Best used in conjunction with other analysis methods and proper risk management
💡 What Makes This Unique
Probability-Based Approach: First indicator to provide quantitative break probabilities rather than simple S/R lines
Multi-Factor Analysis: Combines 6 different market factors into a comprehensive probability model
Adaptive Intelligence: Probabilities update in real-time as market conditions change
Professional Interface: Tiered input system from beginner-friendly to expert-level customization
Institutional-Grade Filtering: Volume validation ensures only significant levels are displayed
🔬 How It Works
1. Level Detection:
Identifies pivot highs and lows using configurable sensitivity settings
Validates levels with volume analysis to ensure institutional significance
2. Probability Calculation:
Analyzes 6 key market factors: structure, volatility, volume, momentum, patterns, sentiment
Applies weighted scoring system based on user-defined factor importance
Generates probability score from 5% to 95% for each level
3. Real-Time Updates:
Continuously monitors price action and market conditions
Updates probability calculations as new data becomes available
Adjusts for level touches and changing market dynamics
💡 Note: This indicator works best on timeframes from 1-minute to 4-hour charts. For optimal results, combine with proper risk management and consider multiple timeframe analysis. The probability calculations are most accurate in trending markets with normal to high volatility conditions.

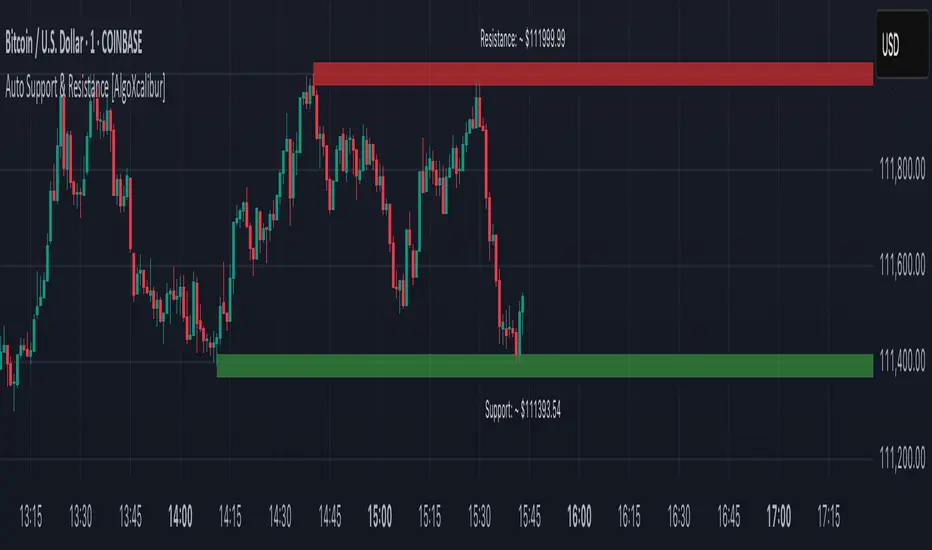
Auto Support & Resistance [AlgoXcalibur]Instantly visualize support and resistance levels with adaptive breakout prediction and zero chart clutter.
Combining reliable pivot level detection, relative volume, and price action confirmation, this tool delivers intelligent S/R zones that adapt to current market conditions. Whether you’re trading breakouts, navigating ranges, or using key levels to manage profits and risk — this indicator automatically identifies important levels for you, reducing your workload so you can better focus on your trades and decision-making.
🧠 Algorithm Logic
This ultra-refined Auto Support & Resistance indicator does more than just display reliable support and resistance levels — it applies a minimalist approach to display only the most relevant and actionable zones, while dynamically tracking their structural integrity in real time. The algorithm features unique Breakout Probability Detection — automatically switching lines from solid to dashed when volume and price action suggest a high probability that a breakout will occur. If a level is broken, the next relevant support or resistance level is immediately displayed on the chart, keeping the levels current and actionable so you do not miss critical insight. Optional Price Labels display the price of each level — practical if using these areas for setting take-profits or stop-losses. This algorithm keeps Support & Resistance what they are supposed to be — simple and useful — effortlessly providing a clean, adaptive view of evolving market structure.
⚙️ User-Selectable Features
• Breakout Probability Detection: When enabled, lines automatically switch from solid to dashed when volume and price action suggest a high breakout probability.
• Price Labels: When enabled, price labels display the price of the S/R for practical reference.
📊 Minimalistic Sophistication
Most automated support and resistance tools clutter the chart with dozens of static levels that do not react to price action. This tool displays only the single most relevant support and resistance level at a time, continuously monitoring for breaks and automatically updating when a level is invalidated. With breakout detection built in, it offers a modern, intuitive way to track structural integrity. This tool is designed to prioritize accuracy, adaptability, and visual simplicity — delivering a smart and refined tool for automatically identifying key levels with confidence.
🔐 To get access or learn more, visit the Author’s Instructions section.
Trend Direction (OTC)Trend Direction (OTC)
Welcome, and thank you for your interest in the Trend Direction (OTC) indicator. This is a private, invite-only tool designed to provide a clear and objective view of market structure and trend dynamics.
Overview
The primary goal of Trend Direction (OTC) is to declutter your charts and help you visually identify the prevailing market trend through a sophisticated analysis of swing points. By automatically plotting key structural points in the market, it helps traders see the bigger picture and make more informed decisions based on classic price action principles.
This indicator is suitable for all markets (Forex, Crypto, Stocks, Indices) and works on any timeframe.
Features
Intelligent Swing Detection: Automatically identifies and plots significant market swing points.
Market Structure Labels (HH, LL, LH, HL): Get instant context on the trend's health. The indicator clearly labels swing points as Higher Highs (HH), Lower Lows (LL), Lower Highs (LH), and Higher Lows (HL), allowing you to see trend continuation and potential reversals at a glance.
Trend Dashboard: A simple, color-coded dashboard in the corner of your chart provides a real-time assessment of the trend, classifying it as "Confirmed," "Unconfirmed". This helps filter out market noise and provides an extra layer of confirmation.
Customizable Display: You have full control over the visual elements.
Adjust the sensitivity of the swing detection to focus on either short-term or long-term trends.
Toggle the visibility of trend lines and labels.
Limit the number of historical swings shown on the chart to keep your workspace clean.
Customize all colors to match your chart's theme.
How to Use
The Trend Direction (OTC) indicator is designed to be intuitive. Here’s a simple guide to interpreting its signals:
Identifying an Uptrend: Look for a consistent series of HH (Higher Highs) and HL (Higher Lows). The dashboard will likely show a "Bullish" status. A break of this pattern (e.g., the formation of an LH or LL) could signal a potential change in trend.
Identifying a Downtrend: Look for a consistent series of LH (Lower Highs) and LL (Lower Lows). The dashboard will likely show a "Bearish" status. A break of this pattern (e.g., the formation of an HL or HH) could signal that the downtrend is weakening.
Ranging or Choppy Markets: In sideways markets, you will see an alternating series of swings without clear direction. The dashboard will likely read "Neutral" or flip between "Unconfirmed" states. This can be useful for avoiding low-probability setups.
Settings
Swing Detection:
Pivot Lookback: The core setting for sensitivity. Higher values = less sensitive (major swings). Lower values = more sensitive (minor swings).
Display Options:
Show Swing Labels: Toggles the HH/LL/etc. labels.
Show Trend Lines: Toggles the zig-zag lines connecting the swings.
Show Last Swings: Set to 0 to see all historical swings, or enter a number to see only the most recent ones.
Color Settings: Customize the colors of all lines and labels to your preference.
Disclaimer: The Trend Direction (OTC) indicator is a tool for analysis and should not be considered financial advice. It is designed to assist in your trading decisions, not to make them for you. Always use proper risk management. Past performance is not indicative of future results.

PriceLevels GBGoldbach Price Levels – Identify Algorithmic Key Zones
This open-source indicator is designed to help traders identify potential algorithmic key zones by highlighting price levels ending with specific numbers such as 03, 11, 29, 35, 65, and 71. These levels may act as inflection points or hesitation areas based on observed behavioral patterns in price movement.
What It Does:
📌 Scans and plots horizontal price levels where the price ends with one of the selected number combinations
🎯 Toggle on/off visibility for each number ending
🎨 Customize color and thickness for each level
🏷️ Shows price labels at the end of each line
🌗 Label styles (color/transparency) are adjustable for both dark and light chart themes
🧠 Why Use It:
This tool is ideal for discretionary traders who study market structure through static price anchors. It provides a visual reference for recurring numerical levels that may be used in algorithmic trading models or serve as psychological price zones.
⚠️ Disclaimer:
This script is open-source and intended for educational and analytical purposes only. No trading signals or performance guarantees are provided. Please use your own judgment when applying this tool in a trading context.

Enhanced Market Sessions Indicator by NomadTradesEnhanced Market Sessions Indicator by NomadTrades
Summary
The Enhanced Market Sessions Indicator is a comprehensive trading tool that automatically identifies and marks the high and low price levels for Asia, London, and New York trading sessions. This indicator goes beyond basic session marking by extending previous session levels into the NY session as key support/resistance zones and providing real-time price interaction alerts when these levels are touched.
**Important Setup Notes:**
- **Update Your Timezone**: Ensure you select the correct timezone in the indicator settings to match your trading preferences
- **Verify Session Times**: Double-check that the default session times align with your market analysis requirements, as market hours may vary due to seasonal changes or regional differences
Key Features
**Session Tracking & Visualization**
- **Automatic Session Detection**: Identifies Asia (2300-0800), London (0800-1330), and New York (1430-2100) sessions
- **High/Low Marking**: Draws solid horizontal lines showing each session's highest and lowest price points
- **Color-Coded System**: Distinct colors for each session (Red for Asia, Blue for London, Green for NY)
- **Session Labels**: Clear price labels showing exact high/low values for easy reference
**Advanced Level Extension**
- **Smart Line Extension**: Automatically extends Asia and London session levels into the NY session as dashed lines
- **Key Level Identification**: Transforms previous session levels into actionable support/resistance zones
- **Visual Distinction**: Extended lines use transparent, dashed styling to differentiate from active session boundaries
**Real-Time Alert System**
- **Price Interaction Alerts**: Sends TradingView notifications when price touches Asia or London levels during NY session
- **Customizable Tolerance**: Adjustable touch sensitivity (0.01% to 1.0%) for precise interaction detection
- **Visual Confirmation**: Displays colored labels on chart when price interactions occur
- **Duplicate Prevention**: Smart logic prevents multiple alerts for the same level touch
**Customization & Control**
- **Lookback Period**: Control how many days of historical sessions to display (1-30 days)
- **Timezone Flexibility**: Support for all major timezones (UTC-12 to UTC+12)
- **Session Toggle**: Individual on/off switches for each session display
- **Color Customization**: Full color control for all session lines and labels
- **Clean Interface**: Organized input groups for easy configuration
**Chart Behaviour**
- **Fixed Positioning**: Lines remain anchored to time positions when dragging or scrolling the chart
- **Professional Appearance**: Matches the behaviour of manually drawn horizontal lines
- **Performance Optimized**: Efficient rendering with proper line and label limits
- **Multi-Timeframe Support**: Works reliably across all chart timeframes
**Alert Configuration Options**
- **Script Alerts**: Use "Any alert() function call" for comprehensive notifications
- **Individual Conditions**: Separate alert conditions for granular control
- **Flexible Notifications**: Compatible with mobile app, email, and desktop alerts
- **Session-Specific Logic**: Alerts only trigger during NY session for relevant level interactions
This indicator is perfect for traders who focus on session-based analysis, ICT concepts, and multi-session support/resistance strategies. The combination of visual clarity, automated alerts, and professional chart behaviour makes it an essential tool for serious forex and index traders.

Volatility Quality [Alpha Extract]The Alpha-Extract Volatility Quality (AVQ) Indicator provides traders with deep insights into market volatility by measuring the directional strength of price movements. This sophisticated momentum-based tool helps identify overbought and oversold conditions, offering actionable buy and sell signals based on volatility trends and standard deviation bands.
🔶 CALCULATION
The indicator processes volatility quality data through a series of analytical steps:
Bar Range Calculation: Measures true range (TR) to capture price volatility.
Directional Weighting: Applies directional bias (positive for bullish candles, negative for bearish) to the true range.
VQI Computation: Uses an exponential moving average (EMA) of weighted volatility to derive the Volatility Quality Index (VQI).
vqiRaw = ta.ema(weightedVol, vqiLen)
Smoothing: Applies an additional EMA to smooth the VQI for clearer signals.
Normalization: Optionally normalizes VQI to a -100/+100 scale based on historical highs and lows.
Standard Deviation Bands: Calculates three upper and lower bands using standard deviation multipliers for volatility thresholds.
vqiStdev = ta.stdev(vqiSmoothed, vqiLen)
upperBand1 = vqiSmoothed + (vqiStdev * stdevMultiplier1)
upperBand2 = vqiSmoothed + (vqiStdev * stdevMultiplier2)
upperBand3 = vqiSmoothed + (vqiStdev * stdevMultiplier3)
lowerBand1 = vqiSmoothed - (vqiStdev * stdevMultiplier1)
lowerBand2 = vqiSmoothed - (vqiStdev * stdevMultiplier2)
lowerBand3 = vqiSmoothed - (vqiStdev * stdevMultiplier3)
Signal Generation: Produces overbought/oversold signals when VQI reaches extreme levels (±200 in normalized mode).
Formula:
Bar Range = True Range (TR)
Weighted Volatility = Bar Range × (Close > Open ? 1 : Close < Open ? -1 : 0)
VQI Raw = EMA(Weighted Volatility, VQI Length)
VQI Smoothed = EMA(VQI Raw, Smoothing Length)
VQI Normalized = ((VQI Smoothed - Lowest VQI) / (Highest VQI - Lowest VQI) - 0.5) × 200
Upper Band N = VQI Smoothed + (StdDev(VQI Smoothed, VQI Length) × Multiplier N)
Lower Band N = VQI Smoothed - (StdDev(VQI Smoothed, VQI Length) × Multiplier N)
🔶 DETAILS
Visual Features:
VQI Plot: Displays VQI as a line or histogram (lime for positive, red for negative).
Standard Deviation Bands: Plots three upper and lower bands (teal for upper, grayscale for lower) to indicate volatility thresholds.
Reference Levels: Horizontal lines at 0 (neutral), +100, and -100 (in normalized mode) for context.
Zone Highlighting: Overbought (⋎ above bars) and oversold (⋏ below bars) signals for extreme VQI levels (±200 in normalized mode).
Candle Coloring: Optional candle overlay colored by VQI direction (lime for positive, red for negative).
Interpretation:
VQI ≥ 200 (Normalized): Overbought condition, strong sell signal.
VQI 100–200: High volatility, potential selling opportunity.
VQI 0–100: Neutral bullish momentum.
VQI 0 to -100: Neutral bearish momentum.
VQI -100 to -200: High volatility, strong bearish momentum.
VQI ≤ -200 (Normalized): Oversold condition, strong buy signal.
🔶 EXAMPLES
Overbought Signal Detection: When VQI exceeds 200 (normalized), the indicator flags potential market tops with a red ⋎ symbol.
Example: During strong uptrends, VQI reaching 200 has historically preceded corrections, allowing traders to secure profits.
Oversold Signal Detection: When VQI falls below -200 (normalized), a lime ⋏ symbol highlights potential buying opportunities.
Example: In bearish markets, VQI dropping below -200 has marked reversal points for profitable long entries.
Volatility Trend Tracking: The VQI plot and bands help traders visualize shifts in market momentum.
Example: A rising VQI crossing above zero with widening bands indicates strengthening bullish momentum, guiding traders to hold or enter long positions.
Dynamic Support/Resistance: Standard deviation bands act as dynamic volatility thresholds during price movements.
Example: Price reversals often occur near the third standard deviation bands, providing reliable entry/exit points during volatile periods.
🔶 SETTINGS
Customization Options:
VQI Length: Adjust the EMA period for VQI calculation (default: 14, range: 1–50).
Smoothing Length: Set the EMA period for smoothing (default: 5, range: 1–50).
Standard Deviation Multipliers: Customize multipliers for bands (defaults: 1.0, 2.0, 3.0).
Normalization: Toggle normalization to -100/+100 scale and adjust lookback period (default: 200, min: 50).
Display Style: Switch between line or histogram plot for VQI.
Candle Overlay: Enable/disable VQI-colored candles (lime for positive, red for negative).
The Alpha-Extract Volatility Quality Indicator empowers traders with a robust tool to navigate market volatility. By combining directional price range analysis with smoothed volatility metrics, it identifies overbought and oversold conditions, offering clear buy and sell signals. The customizable standard deviation bands and optional normalization provide precise context for market conditions, enabling traders to make informed decisions across various market cycles.

Approximate Entropy Zones [PhenLabs]Version: PineScript™ v6
Description
This indicator identifies periods of market complexity and randomness by calculating the Approximate Entropy (ApEn) of price action. As the movement of the market becomes complex, it means the current trend is losing steam and a reversal or consolidation is likely near. The indicator plots high-entropy periods as zones on your chart, providing a graphical suggestion to anticipate a potential market direction change. This indicator is designed to help traders identify favorable times to get in or out of a trade by highlighting when the market is in a state of disarray.
Points of Innovation
Advanced Complexity Analysis: Instead of relying on traditional momentum or trend indicators, this tool uses Approximate Entropy to quantify the unpredictability of price movements.
Dynamic Zone Creation: It automatically plots zones on the chart during periods of high entropy, providing a clear and intuitive visual guide.
Customizable Sensitivity: Users can fine-tune the ‘Entropy Threshold’ to adjust how frequently zones appear, allowing for calibration to different assets and timeframes.
Time-Based Zone Expiration: Zones can be set to expire after a specific time, keeping the chart clean and relevant.
Built-in Zone Size Filter: Excludes zones that form on excessively large candles, filtering out noise from extreme volatility events.
On-Chart Calibration Guide: A persistent note on the chart provides simple instructions for adjusting the entropy threshold, making it easy for users to optimize the indicator’s performance.
Core Components
Approximate Entropy (ApEn) Calculation: The core of the indicator, which measures the complexity or randomness of the price data.
Zone Plotting: Creates visual boxes on the chart when the calculated ApEn value exceeds a user-defined threshold.
Dynamic Zone Management: Manages the lifecycle of the zones, from creation to expiration, ensuring the chart remains uncluttered.
Customizable Settings: A comprehensive set of inputs that allow users to control the indicator’s sensitivity, appearance, and time-based behavior.
Key Features
Identifies Potential Reversals: The high-entropy zones can signal that a trend is nearing its end, giving traders an early warning.
Works on Any Timeframe: The indicator can be applied to any chart timeframe, from minutes to days.
Customizable Appearance: Users can change the color and transparency of the zones to match their chart’s theme.
Informative Labels: Each zone can display the calculated entropy value and the direction of the candle on which it formed.
Visualization
Entropy Zones: Shaded boxes that appear on the chart, highlighting candles with high complexity.
Zone Labels: Text within each zone that displays the ApEn value and a directional arrow (e.g., “0.525 ↑”).
Calibration Note: A small table in the top-right corner of the chart with instructions for adjusting the indicator’s sensitivity.
Usage Guidelines
Entropy Analysis
Source: The price data used for the ApEn calculation. (Default: close)
Lookback Length: The number of bars used in the ApEn calculation. (Default: 20, Range: 10-50)
Embedding Dimension (m): The length of patterns to be compared; a standard value for financial data. (Default: 2)
Tolerance Multiplier (r): Adjusts the tolerance for pattern matching; a larger value makes matching more lenient. (Default: 0.2)
Entropy Threshold: The ApEn value that must be exceeded to plot a zone. Increase this if too many zones appear; decrease it if too few appear. (Default: 0.525)
Time Settings
Analysis Timeframe: How long a zone remains on the chart after it forms. (Default: 1D)
Custom Period (Bars): The zone’s lifespan in bars if “Analysis Timeframe” is set to “Custom”. (Default: 1000)
Zone Settings
Zone Fill Color: The color of the entropy zones. (Default: #21f38a with 80% transparency)
Maximum Zone Size %: Filters out zones on candles that are larger than this percentage of their low price. (Default: 0.5)
Display Options
Show Entropy Label: Toggles the visibility of the text label inside each zone. (Default: true)
Label Text Position: The horizontal alignment of the text label. (Default: Right)
Show Calibration Note: Toggles the visibility of the calibration note in the corner of the chart. (Default: true)
Best Use Cases
Trend Reversal Trading: Identifying when a strong trend is likely to reverse or pause.
Breakout Confirmation: Using the absence of high entropy to confirm the strength of a breakout.
Ranging Market Identification: Periods of high entropy can indicate that a market is transitioning into a sideways or choppy phase.
Limitations
Not a Standalone Signal: This indicator should be used in conjunction with other forms of analysis to confirm trading signals.
Lagging Nature: Like all indicators based on historical data, ApEn is a lagging measure and does not predict future price movements with certainty.
Calibration Required: The effectiveness of the indicator is highly dependent on the “Entropy Threshold” setting, which needs to be adjusted for different assets and timeframes.
What Makes This Unique
Quantifies Complexity: It provides a numerical measure of market complexity, offering a different perspective than traditional indicators.
Clear Visual Cues: The zones make it easy to see when the market is in a state of high unpredictability.
User-Friendly Design: With features like the on-chart calibration note, the indicator is designed to be easy to use and optimize.
How It Works
Calculate Standard Deviation: The indicator first calculates the standard deviation of the source price data over a specified lookback period.
Calculate Phi: It then calculates a value called “phi” for two different pattern lengths (embedding dimensions ‘m’ and ‘m+1’). This involves comparing sequences of data points to see how many are “similar” within a certain tolerance (determined by the standard deviation and the ‘r’ multiplier).
Calculate ApEn: The Approximate Entropy is the difference between the two phi values. A higher ApEn value indicates greater irregularity and unpredictability in the data.
Plot Zones: If the calculated ApEn exceeds the user-defined ‘Entropy Threshold’, a zone is plotted on the chart.
Note: The “Entropy Threshold” is the most important setting to adjust. If you see too many zones, increase the threshold. If you see too few, decrease it.

Liquidation Heatmap ║ BullVision 🧠Overview
The Liquidation Heatmap ║ BullVision 💥 is a high-precision visualization tool engineered to highlight probable liquidation levels in crypto markets. It leverages multi-exchange Open Interest data, real-time volume dynamics, and structure-aware volatility signals to reveal where leveraged traders are most at risk of forced position closures.
📖 What Are Liquidations?
In leveraged derivatives markets, a liquidation occurs when a trader’s margin becomes insufficient to maintain their position, triggering an automatic force-close by the exchange. These events are typically clustered around price levels where large volumes of overleveraged positions accumulate. When breached, they often result in sharp, aggressive price movements — also known as liquidation cascades.
This indicator is designed to detect and project such high-risk zones before they trigger, giving traders an edge in visualizing hidden pressure points in the market.
🧠 How It Works
The core engine aggregates real-time ∆OI (Open Interest delta) data from multiple major exchanges and applies a layered filtering system that considers:
Relative Open Interest shifts, normalized against an adaptive moving average baseline
Volume acceleration patterns, compared to a rolling historical benchmark
Market structure context, identifying meaningful directional breaks and failed retests
Leverage-tier modeling, using probabilistic distance rules to simulate where liquidations from 5x to 100x positions would be triggered
Each qualifying liquidation level is rendered using dynamic gradient lines and optional glow-enhanced zone visuals. The display adapts in real time to structural confirmation, volatility regime, and liquidity depth.
Exemple of Liquidation cascades
Exemple of Liquidation rejection
🔍 Key Features
🔗 Multi-Exchange OI Aggregation: Binance, OKX, BitMEX, Kraken (toggleable)
📊 Leverage-Tier Mapping: 5x, 10x, 25x, 50x, 100x projections
🎨 Gradient Zones: Custom color ramps reflect level significance
🧱 Structure-Sensitive Filtering: Noise reduction via multi-condition confirmation logic
🧠 Contextual Directional Bias: Zones filtered based on recent bullish/bearish transitions
⚙️ Fully Customizable: User-defined intensity thresholds, color palette, and range filtering
🧩 Why It’s Worth Paying For
This is not a mashup of public indicators. The script introduces an original, multi-layered architecture combining real-time Open Interest dynamics, structural analysis, and custom liquidation modeling.
Unlike speculative support/resistance plots or volume-only heatmaps, this tool is built to:
Detect liquidation zones before they cascade
React dynamically to market shifts
Filter noise through structural confirmation
Retain historical zones for visual learning and backtesting
✅ Compliance & Originality
This script was developed entirely in-house with original detection logic. No reused open-source components are included. Data requests are made through TradingView’s native .P_OI feeds, and all calculations, signal conditions, and visual logic were coded from scratch for this script.
⚠️ Risk Disclaimer & Access Policy
This script is a visual risk-awareness tool, not a signal generator or financial advice mechanism. No guarantee is made regarding future price action, liquidation triggers, or trading performance.
Use at your own discretion, with proper position sizing, risk management, and awareness of the market's inherent uncertainty.
🔒 Why This Script Is Invite-Only and Closed-Source
To protect its proprietary detection engine, this script is both closed-source and invite-only. The algorithm uses original methods to:
Aggregate real-time Open Interest delta across exchanges
Simulate leverage-based liquidation zones
Dynamically filter zones using structure and volatility layers
Opening the source would expose core detection logic to copycats or misuse. Likewise, access is limited to ensure the tool is used responsibly by serious traders and not distributed or repackaged unethically.
This model preserves the script’s quality, originality, and intended value.

ATR RopeATR Rope is inspired by DonovanWall's "Range Filter". It implements a similar concept of filtering out smaller market movements and adjusting only for larger moves. In addition, this indicator goes one step deeper by producing actionable zones to determine market state. (Trend vs. Consolidation)
> Background
When reading up on the Range Filter indicator, it reminded me exactly of a Rope stabilization drawing tool in a program I use frequently. Rope stabilization essentially attaches a fixed length "rope" to your cursor and an anchor point (Brush). As you move your cursor, you are pulling the brush behind it. The cursor (of course) will not pull the brush until the rope is fully extended, this behavior filters out jittery movements and is used to produce smoother drawing curves.
If compared visually side-by-side, you will notice that this indicator bears striking resemblance to its inspiration.
> Goal
Other than simply distinguishing price movements between meaningful and noise, this indicator strives to create a rigid structure to frame market movements and lack-there-of, such as when to anticipate trend, and when to suspect consolidation.
Since the indicator works based on an ATR range, the resulting ATR Channel does well to get reactions from price at its extremes. Naturally, when consolidating, price will remain within the channel, neither pushing the channel significantly up or down. Likewise, when trending, price will continue to push the channel in a single direction.
With the goal of keeping it quick and simple, this indicator does not do any smoothing of data feeds, and is simply based on the deviation of price from the central rope. Adjusting the rope when price extends past the threshold created by +/- ATR from the rope.
> Features & Behaviors
- ATR Rope
ATR Rope is displayed as a 3 color single line.
This can be considered the center line, or the directional line, whichever you'd prefer.
The main point of the Rope display is to indicate direction, however it also is factually the center of the current working range.
- ATR Rope Color
When the rope's value moves up, it changes to green (uptrend), when down, red (downtrend).
When the source crosses the rope, it turns blue (flat).
With these simple rules, we've formed a structure to view market movements.
- Consolidation Zones
Consolidation Zones generate from "Flat" areas, and extend into subsequent trend areas. Consolidation is simply areas where price has crossed the Rope and remains inside the range. Over these periods, the upper and lower values are accumulated and averaged together to form the "Consolidation Zone" values. These zones are draw live, so values are averaged as the flat areas progress and don't repaint, so all values seen historically are as they would appear live.
- ATR Channel
ATR Channel displays the upper and lower bounds of the working range.
When the source moves beyond this range, the rope is adjusted based on the distance from the source to the channel. This range can be extremely useful to view, but by default it is hidden.
> Application
This indicator is not created to provide signals, or serve as a "complete" system.
(People who didn't read this far will still comment for signals. :) )
This is created to be used alongside manual interpretation and intuition. This indicator is not meant to constrain any users into a box, and I would actually encourage an open mind and idea generation, as the application of this indicator can take various forms.
> Examples
As you would probably already know, price movement can be fast impulses, and movement can be slow bleeds. In the screenshot below, we are using movements from and to consolidation zones to classify weak trend and strong trend. As you can see, there are also areas of consolidation which get broken out of and confirmed for the larger moves.
Author's Note: In each of these examples, I have outlined the start and end of each session. These examples come from 1 Min Future charts, and have specifically been framed with day trading in mind.
"Breakout Retest" or "Support/Resistance Flips" or "Structure Retests" are all generally the same thing, with different traders referring to them by different names, all of which can be seen throughout these examples.
In the next example, we have a day which started with an early reversal leading into long, slow, trend. Notice how each area throughout the trend essentially moves slightly higher, then consolidates while holding support of the previous zone. This day had a few sharp movements, however there was a large amount of neutrality throughout this day with continuous higher lows.
In contrast to the previous example, next up, we have a very choppy day. Throughout which we see a significant amount of retests before fast directional movements. We also see a few examples of places where previous zones remained relevant into the future. While the zones only display into the resulting trend area, they do not become immediately meaningless once they stop drawing.
> Abstract
In the screenshot below, I have stacked 2 of these indicators, using the high as the source for one and the low as the source for the other. I've hidden lines of the high and low channels to create a 4 lined channel based on the wicks of price.
This is not necessary to use the indicator, but should help provide an idea of creative ways the simple indicator could be used to produce more complicated analysis.
If you've made it this far, I would hope it's clear to you how this indicator could provide value to your trading.
Thank you to DonovonWall for the inspiration.
Enjoy!

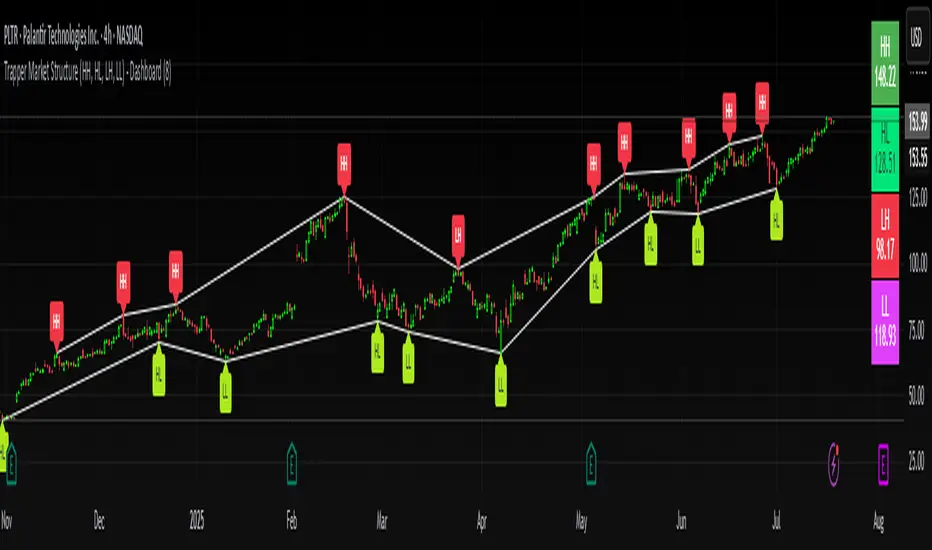
Trapper Market Structure (HH, HL, LH, LL)This script is designed to visually identify price action market structure in real time using pivot-based logic. It highlights the key components of trend direction by labeling:
- **HH** – Higher Highs
- **HL** – Higher Lows
- **LH** – Lower Highs
- **LL** – Lower Lows
These labels help traders track evolving market conditions and spot trend continuations, breaks in structure, or potential reversals — all without guessing.
**How It Works**
The script detects local swing highs and lows based on a customizable pivot strength. Once a valid pivot is confirmed, it’s classified in context with the previous relevant pivot to determine its structural significance.
For example:
- If a pivot high is higher than the previous, it’s marked as a **HH**.
- If a pivot low is lower than the previous, it’s marked as a **LL**, and so on.
This running analysis helps traders anticipate shifts between bullish and bearish structures.
**Customizable Features**
- Adjust **Pivot Strength** to increase or reduce sensitivity (more reactive or more stable)
- Toggle **Labels** on/off for cleaner charts
- Toggle **Connecting Lines** between pivots to visualize structure flow
**Use Case**
This indicator is ideal for:
- Price action traders
- Market structure analysis
- Identifying entry zones during pullbacks (e.g., buying at HLs during uptrends)
- Confirming trend reversals or break-of-structure (BoS)
You can use this tool as a foundation for more advanced systems such as CHoCH/BOS detection, liquidity zones, or sniper-style entry frameworks.
**Concepts Used**
- Swing High/Low detection using `ta.pivothigh` and `ta.pivotlow`
- Market structure labeling logic
- Visual flow to reinforce trader psychology on trend states
Disclaimer
This script is provided for educational purposes only. It is not financial advice and should not be relied upon for trading decisions. Always conduct your own analysis and risk management.
#marketstructure #priceaction #technicalanalysis #tradingviewopen #pivotpoints
Stop Hunt Indicator ║ BullVision 🧠 Overview
The Stop Hunt Indicator (SmartTrap Radar) is an original tool designed to identify potential liquidity traps caused by institutional stop hunts. It visually maps out historically significant levels where price has repeatedly reversed or rejected — and dynamically detects real-time sweep patterns based on volume, structure, and candle rejection behavior.
This script does not repurpose existing public indicators, nor does it use default TradingView built-ins such as RSI, MACD, or MAs. Its core logic is fully proprietary and was developed from scratch to support discretionary and data-driven traders in visualizing volatility risks and manipulation zones.
🔍 What the Indicator Does
This indicator identifies and visualizes potential stop hunt zones using:
Historical structure analysis: Swing highs/lows are identified via a configurable lookback period.
Liquidity level tracking: Once detected, levels are monitored for touches, age, and volume strength.
Proprietary scoring model: Each level receives a real-time significance score based on:
Age (how long the level has held)
Number of rejections (touches)
Relative volume strength
Proximity to current price
The glow intensity of plotted levels is dynamically mapped based on this score. Bright glow = higher institutional interest probability.
⚙️ Stop Hunt Detection Logic
A stop hunt is flagged when all of the following are met:
Price sweeps through a high/low beyond a user-defined penetration threshold
Wick rejection occurs (i.e., candle closes back inside the level)
Volume spikes above the average in a recent window
The script automatically:
Detects bullish stop hunts (below support) and bearish ones (above resistance)
Marks detected sweeps on-chart with optional 🔰/🚨 signals
Adjusts glow visuals based on score even after the sweep occurs
These sweeps often precede local reversals or high-volatility zones — this is not predictive, but rather a reactive mapping of market manipulation behavior.
📌 Why This Is Not Just Another Liquidity Tool
Unlike typical liquidity heatmaps or S/R indicators, this script includes:
A proprietary significance score instead of fixed rules
Multi-layer glow rendering to reflect level importance visually
Real-time scoring updates as new volume and touches occur
Combined volume × rejection × structure logic to validate stop hunts
Fully customizable detection logic (lookback, wick %, volume filters, max bars, etc.)
This indicator provides a specialized view focused solely on visualizing trap setups — not generic trend signals.
🧪 Usage Recommendations
To get started:
Add the indicator to your chart (volume-enabled instruments only)
Customize detection:
Lookback Period for structure
Penetration % for how far price must sweep
Volume Spike Multiplier
Wick rejection strength
Enable/disable features:
Glow effects
Hunt markers
Score labels
Volume highlights
Watch for:
🔰 Bullish Sweeps (below support)
🚨 Bearish Sweeps (above resistance)
Bright glowing zones = high-liquidity targets
This tool can be used for both confluence and risk assessment, especially around high-impact sessions, liquidation events, or range extremes.
📊 Volume Dependency Notice
⚠️ This indicator requires real volume data to function correctly. On instruments without volume (e.g., synthetic pairs), certain features like spike detection and scoring will be disabled or inaccurate.
🔐 Closed-Source Disclosure
This script is published as invite-only to protect its proprietary scoring, glow mapping, and detection logic. While the full implementation remains confidential, this description outlines all key mechanics and configurable logic for user transparency.

[RenkoCore] PublicWhen it comes the Renko chart, we all know it has its advantages & disadvantages compared to the candle-stick chart. My aim of this was to alleviate some of the disadvantages by providing some sort of structure on Renko chart. These set of tools may hopefully help your trading journey on Renko chart.
Helpful tips:
a) Enable wicks on your Renko settings, this indicator needs wicks to work.
b) Choose correct size (I recommend traditional size option) for your Renko chart as well as for your instrument.
c) Keep it on 1-second time frame, anything other than that doesn't work on TradingView's Renko. This is important as price will not repaint.
d) If you want to see bigger picture (like 4hr/daily on candle-stick chart), just increase your Renko size, but still keep it on 1-second timeframe.
This toolset includes couple different methods to provide some structures as explained below:
1. 📌 Balance | Price Action Equilibrium Zones
Overview
The Balance is a visual framework designed to evaluate directional bias and internal structure in price action. It measures net bullish/bearish momentum within a configurable rolling window, while highlighting key structural turning points based on multiple custom sensitivity levels. This tool helps traders stay in sync with market rhythm by emphasizing balance, imbalance, and inflection zones.
🔧 How It Works:
Inflection Tiers
Three customizable rounds of pivot-based divergence detection—labeled as 1°, 2°, and 3°—automatically identify regular bullish and regular bearish pivot structures. Though may not be always accurate, these structural signals are intended to keep user's focus to continually reflect emerging internal market shifts.
Balance Limit
Monitors directional bar disparity within a customizable retrospective span. When the net balance exceeds ±50% of the range, the line turns green to suggest strong directional bias. A red fill zone between these thresholds indicates equilibrium or no-trade conditions.
Volatility Based Reversal (Candle Reversal Detector)
This tool scans for extreme price movements relative to local volatility baselines, helping traders detect possible tops and bottoms before major price reversals or pauses. Compares current price action to the lowest recent volatility anchor or if price sharply dips below the highest recent volatility anchor.
🧠 Use Case Recommendations:
Discretionary trading to visually confirm balance and momentum shifts.
Confluence strategies, combining the balance counter with trend indicators or support/resistance levels.
Structure mapping, to highlight exhaustion zones or emerging reversals based on internal divergences.
Avoid using this tool in isolation. It is most effective when combined with broader market context or other confirmation layers.
2. 📌 Primary Level Detection
Overview
This is a precision tool for detecting dynamic price zones where significant market reversals may begin. Using a blend of momentum, price tension, and volatility structure, it identifies potential top and bottom areas — and tracks them with adaptive channel levels that evolve in real time.
🔧 How It Works:
Combines price action, RSI-based bias, and volatility deviation to identify moments when price is overextended.
Reacts only to major changes — reducing false positives in choppy markets.
Levels persist on the chart until a new valid reversal is confirmed, giving you visual structure and actionable areas to work with.
🧠 Use Case Recommendations:
Trading reversals, reversion-to-mean, or liquidity sweeps
Confirming entries from other indicators (like divergence, order blocks, or support/resistance)
Analyzing volatile markets where rapid direction changes are common (e.g., crypto, futures, scalping)
3. 📌 Secondary Level Detection
Overview
This tool highlights where price may be overextended and due for a short-term reversal, based on recent price structure.
🔧 How It Works:
It uses dynamic bar-count and swing conditions to identify potential price turning points after extended directional moves or strong sequence of bars in same direction.
Levels persist on the chart until a new valid reversal is confirmed, giving you visual structure and actionable areas to work with.
🧠 Use Case Recommendations:
Trading reversals, reversion-to-mean, or liquidity sweeps
Confirming entries from other indicators (like divergence, order blocks, or support/resistance)
⚠️ Important Notes:
This indicator does not repaint. All pivots and plots are based on closed candles and verified conditions.
This tool does not provide trade signals. It is a structural analysis tool intended to assist in discretionary decision-making. This indicator is for informational and educational purposes only. Use in combination with your own trading strategy, risk management, and market context. The signals generated do not guarantee outcomes and should not be used in isolation.
It is not intended to be financial advice or a recommendation to buy or sell any security or asset. Trading involves risk. Always do your own research and consult with a licensed financial advisor before making any trading decisions. Past performance is not indicative of future results.
The author is not responsible for any losses incurred from the use of this script.

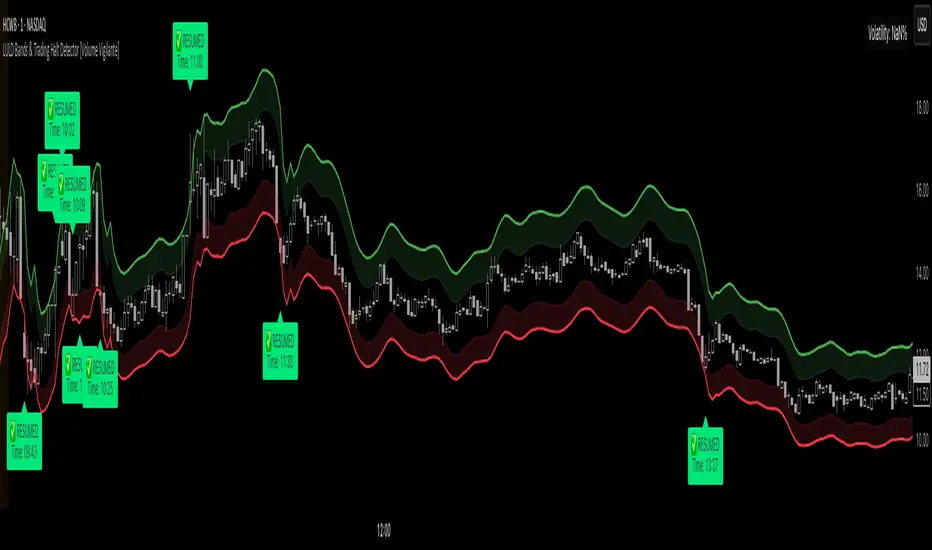
LULD Bands & Trading Halt Detector [Volume Vigilante]📖 LULD Bands & Trading Halt Detector
This advanced tool visualizes official Limit Up / Limit Down (LULD) price bands and detects regulatory trading halts and resumptions based on SEC and NASDAQ rules. It is engineered for high accuracy by anchoring all calculations to the 1-minute timeframe, ensuring reliable signals across any chart resolution.
📌 What Does This Script Do?
- Draws real-time LULD price band estimations and optional buffer (caution) zones directly on the chart.
- Detects trading halt resumptions by monitoring time gaps between candles and other regulatory criteria. (Note: Due to Pine Script limitations, halts cannot be detected in real-time, only resumptions after they occur.)
- Triggers real-time alerts for:
- Trading Resumptions (Limit Up & Limit Down)
- LULD Zone Entries (Caution Zone)
- Band Breaches (Limit Up and Limit Down)
- Plots historical halt resumption markers to analyse past events.
📐 How It Works:
- Implements official SEC/NASDAQ LULD rules for Tier 1 and Tier 2 securities.
- Applies special band adjustments for the final 25 minutes of trading (after 3:35 PM ET).
- Anchors all logic to the 1-minute timeframe for precise calculations, even on higher timeframe charts.
- Includes adjustable volume and volatility filters to eliminate false signals (ghost halts) on low-- liquidity assets, especially Tier 2 securities when TradingView fails to print candles.
⚙️ How to Use It:
1.) Apply the script to any asset or timeframe.
2.) Adjust Volume and Volatility Filters to reduce noise. (Recommended: 500,000+ volume, 10%+ volatility.)
3.) Enable or disable visual components like bands, buffer zones, and halt resumption labels.
4.) Configure alerts directly from the script settings panel.
5.) Apply alerts to individual assets via "Add Alert On..." or to entire watchlists using "Add Alert on the List."
🧩 What Makes This Script Unique?
- True 1-Minute Anchored Calculations: Ensures alerts and visuals match official trading halt criteria regardless of chart timeframe.
- Customisable Buffered Zones: Visualise proximity to regulatory price limits and avoid volatility traps.
- Combines halt resumption detection, limit up/down band visualisation, and real-time alerts into one clean, modular tool.
📚 Disclaimer:
This script is for educational purposes only and does not constitute financial advice. Use at your own discretion and consult a licensed financial advisor before making trading decisions based on it.
Official Resources:
- NASDAQ LULD Regulations (FAQ):
www.nasdaqtrader.com
Current Nasdaq Trading Halts:
www.nasdaqtrader.com
Entropy Chart Analysis [PhenLabs]📊 Entropy Chart analysis -
Version: PineScript™ v6
📌 Description
The Entropy Chart indicator analysis applies Approximate Entropy (ApEn) to identify zones of potential support and resistance on your price chart. It is designed to locate changes in the market’s predictability, with a focus on zones near significant psychological price levels (e.g., multiples of 50). By quantifying entropy, the indicator aims to identify zones where price action might stabilize (potential support) or become randomized (potential resistance).
This tool automates the visualization of these key areas for traders, which may have the effect of revealing reversal levels or consolidation zones that would be hard to discern through traditional means. It also filters the signals by proximity to key levels in an attempt to reduce noise and highlight higher-probability setups. These dynamic zones adapt to changing market conditions by stretching, merging, and expiring based on user-inputted rules.
🚀 Points of Innovation
Combines Approximate Entropy (ApEn) calculation with price action near significant levels.
Filters zone signals based on proximity (in ticks) to predefined significant price levels (multiples of 50).
Dynamically merges overlapping or nearby zones to consolidate signals and reduce chart clutter.
Uses ApEn crossovers relative to its moving average as the core trigger mechanism.
Provides distinct visual coloring for bullish, bearish, and merged (mixed-signal) zones.
Offers comprehensive customization for entropy calculation, zone sensitivity, level filtering, and visual appearance.
🔧 Core Components
Approximate Entropy (ApEn) Calculation : Measures the regularity or randomness of price fluctuations over a specified window. Low ApEn suggests predictability, while high ApEn suggests randomness.
Zone Trigger Logic : Creates potential support zones when ApEn crosses below its average (indicating increasing predictability) and potential resistance zones when it crosses above (indicating increasing randomness).
Significant Level Filter : Validates zone triggers only if they occur within a user-defined tick distance from significant price levels (multiples of 50).
Dynamic Zone Management : Automatically creates, extends, merges nearby zones based on tick distance, and removes the oldest zones to maintain a maximum limit.
Zone Visualization : Draws and updates colored boxes on the chart to represent active support, resistance, or mixed zones.
🔥 Key Features
Entropy-Based S/R Detection : Uses ApEn to identify potential support (low entropy) and resistance (high entropy) areas.
Significant Level Filtering : Enhances signal quality by focusing on entropy changes near key psychological price points.
Automatic Zone Drawing & Merging : Visualizes zones dynamically, merging close signals for clearer interpretation.
Highly Customizable : Allows traders to adjust parameters for ApEn calculation, zone detection thresholds, level filter sensitivity, merging distance, and visual styles.
Integrated Alerts : Provides built-in alert conditions for the formation of new bullish or bearish zones near significant levels.
Clear Visual Output : Uses distinct, customizable colors for buy (support), sell (resistance), and mixed (merged) zones.
🎨 Visualization
Buy Zones : Represented by greenish boxes (default: #26a69a), indicating potential support areas formed during low entropy periods near significant levels.
Sell Zones : Represented by reddish boxes (default: #ef5350), indicating potential resistance areas formed during high entropy periods near significant levels.
Mixed Zones : Represented by bluish/purple boxes (default: #8894ff), formed when a buy zone and a sell zone merge, indicating areas of potential consolidation or conflict.
Dynamic Extension : Active zones are automatically extended to the right with each new bar.
📖 Usage Guidelines
Calculation Parameters
Window Length
Default: 15
Range: 10-100
Description: Lookback period for ApEn calculation. Shorter lengths are more responsive; longer lengths are smoother.
Embedding Dimension (m)
Default: 2
Range: 1-6
Description: Length of patterns compared in ApEn calculation. Higher values detect more complex patterns but require more data.
Tolerance (r)
Default: 0.5
Range: 0.1-1.0 (step 0.1)
Description: Sensitivity factor for pattern matching (as a multiple of standard deviation). Lower values require closer matches (more sensitive).
Zone Settings
Zone Lookback
Default: 5
Range: 5-50
Description: Lookback period for the moving average of ApEn used in threshold calculations.
Zone Threshold
Default: 0.5
Range: 0.5-3.0
Description: Multiplier for the ApEn average to set crossover trigger levels. Higher values require larger ApEn deviations to create zones.
Maximum Zones
Default: 5
Range: 1-10
Description: Maximum number of active zones displayed. The oldest zones are removed first when the limit is reached.
Zone Merge Distance (Ticks)
Default: 5
Range: 1-50
Description: Maximum distance in ticks for two separate zones to be merged into one.
Level Filter Settings
Tick Size
Default: 0.25
Description: The minimum price increment for the asset. Must be set correctly for the specific instrument to ensure accurate level filtering.
Max Ticks Distance from Levels
Default: 40
Description: Maximum allowed distance (in ticks) from a significant level (multiple of 50) for a zone trigger to be valid.
Visual Settings
Buy Zone Color : Default: color.new(#26a69a, 83). Sets the fill color for support zones.
Sell Zone Color : Default: color.new(#ef5350, 83). Sets the fill color for resistance zones.
Mixed Zone Color : Default: color.new(#8894ff, 83). Sets the fill color for merged zones.
Buy Border Color : Default: #26a69a. Sets the border color for support zones.
Sell Border Color : Default: #ef5350. Sets the border color for resistance zones.
Mixed Border Color : Default: color.new(#a288ff, 50). Sets the border color for mixed zones.
Border Width : Default: 1, Range: 1-3. Sets the thickness of zone borders.
✅ Best Use Cases
Identifying potential support/resistance near significant psychological price levels (e.g., $50, $100 increments).
Detecting potential market turning points or consolidation zones based on shifts in price predictability.
Filtering entries or exits by confirming signals occurring near significant levels identified by the indicator.
Adding context to other technical analysis approaches by highlighting entropy-derived zones.
⚠️ Limitations
Parameter Dependency : Indicator performance is sensitive to parameter settings ( Window Length , Tolerance , Zone Threshold , Max Ticks Distance ), which may need optimization for different assets and timeframes.
Volatility Sensitivity : High market volatility or erratic price action can affect ApEn calculations and potentially lead to less reliable zone signals.
Fixed Level Filter : The significant level filter is based on multiples of 50. While common, this may not capture all relevant levels for every asset or market condition. Accurate Tick Size input is essential.
Not Standalone : Should be used in conjunction with other analysis methods (price action, volume, other indicators) for confirmation, not as a sole basis for trading decisions.
💡 What Makes This Unique
Entropy + Level Context : Uniquely combines ApEn analysis with a specific filter for proximity to significant price levels (multiples of 50), adding locational context to entropy signals.
Intelligent Zone Merging : Automatically consolidates nearby buy/sell zones based on tick distance, simplifying visual analysis and highlighting stronger confluence areas.
Targeted Signal Generation : Focuses alerts and zone creation on specific market conditions (entropy shifts near key levels).
🔬 How It Works
Calculate Entropy : The script computes the Approximate Entropy (ApEn) of the closing prices over the defined Window Length to quantify price predictability.
Check Triggers : It monitors ApEn relative to its moving average. A crossunder below a calculated threshold (avg_apen / zone_threshold) indicates potential support; a crossover above (avg_apen * zone_threshold) indicates potential resistance.
Filter by Level : A potential zone trigger is confirmed only if the low (for support) or high (for resistance) of the trigger bar is within the Max Ticks Distance of a significant price level (multiple of 50).
Manage & Draw Zones : If a trigger is confirmed, a new zone box is created. The script checks for overlaps with existing zones within the Zone Merge Distance and merges them if necessary. Zones are extended forward, and the oldest are removed to respect the Maximum Zones limit. Active zones are drawn and updated on the chart.
💡 Note:
Crucially, set the Tick Size parameter correctly for your specific trading instrument in the “Level Filter Settings”. Incorrect Tick Size will make the significant level filter inaccurate.
Experiment with parameters, especially Window Length , Tolerance (r) , Zone Threshold , and Max Ticks Distance , to tailor the indicator’s sensitivity to your preferred asset and timeframe.
Always use this indicator as part of a comprehensive trading plan, incorporating risk management and seeking confirmation from other analysis techniques.

Smarter Money Concepts - MTF IFVGs [PhenLabs]📊 Smarter Money Concepts - MTF IFVG
Version: PineScript™ v6
📌 Description
This multi-timeframe indicator identifies Inverse Fair Value Gaps (IFVGs) and their inversions across simultaneous chart intervals, helping traders spot liquidity voids and potential reversal zones. By analyzing price action through the lens of institutional order flow patterns, it solves the problem of manual gap tracking across timeframes while incorporating volatility-adjusted parameters and psychological level analysis for higher-probability setups.
🚀 Points of Innovation
• Multi-Timeframe Engine - Simultaneous analysis of 3 higher timeframes
• Adaptive Parameters - Auto-adjusts to market volatility conditions
• Quality Scoring System - Ranks gaps using RVI strength and size metrics
• Inversion Tracking - Monitors failed gaps for counter-trend signals
• Render Optimization - Prevents chart clutter with smart gap management
🔧 Core Components
FVG Detection Logic: Identifies gaps using customizable price source (Close/Wick)
Inversion Tracker: Manages failed gaps and generates counter signals
Multi-Timeframe Engine: Processes 3 independent higher timeframe analyses
Dashboard System: Real-time display of active gaps across all timeframes
🔥 Key Features
• Volatility-adjusted gap size filters (ATR-based)
• Customizable timeframe confluence analysis
• Color-coded quality scoring
• Non-repainting inversion signals
• Mobile-optimized visual rendering
🎨 Visualization
• Colored Boxes: Translucent zones show active gaps (green/bullish, red/bearish)
• Midline Plot: Dashed gray line marks gap midpoint for price targets
• Inversion Markers: Intense colors show failed gaps (dark red/bullish failure, bright green/bearish failure)
• HTF Differentiation: Higher timeframe gaps shown in blue/teal hues
📖 Usage Guidelines
Multi-Timeframe Settings
• Higher Timeframe 1
Default: 30 | Range: Any > Chart TF | Controls primary confluence timeframe
• Show All Timeframes
Default: True | Toggles multi-TF gap displays
Gap Settings
• Source
Default: Close | Options: | Determines gap measurement method
• RVI Period
Default: 14 | Range: 1-50 | Sets momentum confirmation sensitivity
• RVI Value
Default 0.1 | 0 to see all IFVGs | Increase min RVI to see the most powerful IFVGs
✅ Best Use Cases
• Identifying confluence across timeframes
• Spotting institutional order blocks
• High-probability reversal trading
• Trend continuation confirmation
• Volatility breakout setups
⚠️ Limitations
• Repaints historical gap zones
• Requires understanding of FVG concepts
• Higher timeframe data latency
• Quality scores rely on RVI/ATR settings
💡 What Makes This Unique
First FVG indicator with true multi-timeframe processing
Adaptive parameters that auto-adjust to volatility
Quantifiable quality scoring system
Professional-grade dashboard with HTF tracking
🔬 How It Works
Gap Detection: Identifies FVGs using price relationships and RVI confirmation
Inversion Tracking: Monitors price breaches to flag failed gaps
Quality Assessment: Scores gaps based on size, momentum, and location
Adaptive Filtering: Adjusts parameters using ATR-based volatility analysis
Multi-TF Synthesis: Correlates gaps across user-selected timeframes
Visual Rendering: Displays only relevant, active gaps to prevent clutter
💡 Note:
Start with default settings and gradually adjust parameters after observing market interactions. Focus on gaps with quality scores above 7 that align with higher timeframe trends. Combine with price action at psychological levels for highest-probability setups. Remember that higher timeframe gaps generally carry more significance than current chart gaps.

Swing + 3-Bar Breakout(Mastersinnifty)Overview
This script is a hybrid trading tool combining swing-based structural analysis, momentum filtering, and breakout validation — designed to detect early reversals and confirm trend continuations within a single unified system.
It integrates five major components:
- ZigZag Structural Detection — to identify critical swing highs and lows.
- Momentum Validation — using RSI and Rate of Change (ROC) to confirm the strength behind swings.
- Three-Bar Breakout Confirmation — spotting trend continuation beyond swing structures.
- Dynamic Trailing Stop System — managing trades adaptively via ATR-based trailing stops.
- Projected Target Levels — estimating future price destinations based on measured swings.
---
What Makes This Script Unique
Rather than using standard indicators in isolation, this script layers multiple conditions sequentially and contextually:
- Structural Foundation: Identifies pivots through a tight ZigZag algorithm tuned with a low-depth setting for early detection.
- Momentum Checkpoint: Validates pivots only if RSI extremes and ROC momentum surges align, reducing false breakouts during sideways movements.
- Breakout Validation: Confirms trend continuation when price breaches critical multi-bar highs/lows post-swing formation.
- Risk-Managed Progression: Initiates adaptive ATR-based trailing stops immediately after signal generation, tightening risk dynamically as trends unfold.
- Target Projection: Estimates potential move size by projecting the magnitude of the last completed swing, offering realistic price milestones.
This combination provides a dual-purpose tool for both reversals and breakouts, allowing flexible trading styles within a single indicator.
---
How the Script Works
- Swing Detection
- A swing low is identified when a price bottom forms (via ZigZag) and momentum conditions are met (RSI < 20, ROC > +0.5).
- A swing high is identified when a price top forms and momentum conditions are met (RSI > 80, ROC < -0.5).
- Breakout Confirmation
- After a swing is detected, if price crosses above/below a three-bar swing structure, a secondary breakout signal is triggered.
- Trailing Stop Activation:
- Upon a confirmed swing or breakout, an ATR-multiplied trailing stop is initialized below/above the entry point to secure profits dynamically.
- Projection Logic
- Swing height is measured from the latest high-low sequence, and potential future targets are plotted for visual guidance.
---
Who Can Benefit From This Indicator
- Swing Traders — who seek early entries around reversal zones.
- Scalpers & Intraday Traders — needing fast-reacting momentum-based confirmation.
- Breakout Traders — to time entries after multi-bar compressions.
- Risk Managers — through integrated ATR trailing stops for dynamic exit management.
- Price Action Analysts — utilizing projected swing targets for strategic planning.
---
How to Use
- Entry Identification
- Look for buy signals at swing lows with strong positive momentum.
- Look for sell signals at swing highs with strong negative momentum.
- Use breakout confirmations to validate the trend continuation beyond swings.
- Risk Management
- Monitor trailing stop lines to track trade health.
- Watch projected targets to anticipate realistic move completions.
- Chart Visibility
- All plotted points, breakout markers, trailing stops, and projected levels are generated automatically for clarity.
---
Disclaimer
This script is intended for educational and analytical purposes only.
It does not constitute financial advice, and past performance does not guarantee future results.
All trading involves risk. Users are responsible for their own trading decisions.
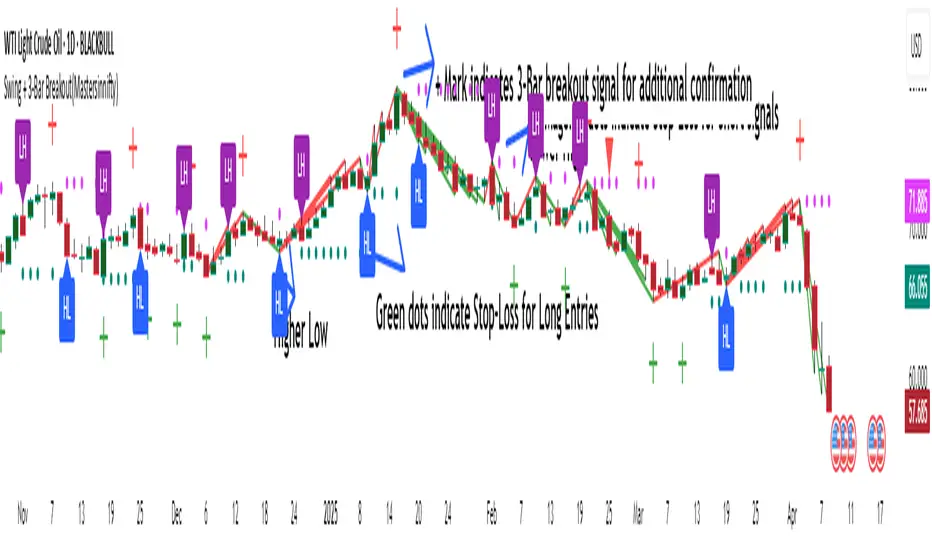
Anchored VWAP Pro (Final Visibility Enhanced)This is a fully customizable Anchored VWAP (Volume Weighted Average Price) indicator designed for traders who prioritize precision, clarity, and macro trend analysis.
Unlike traditional VWAPs tied to daily or session data, this version allows you to manually anchor the VWAP to any candle in history—ideal for macro swing trading, cycle lows, breakouts, and reaccumulation phases.
Features:
• Manual Anchor Date: Set the exact year, month, and day for your VWAP to begin
• Custom Price Source: Choose between HLC3, close, or any OHLC-based input
• VWAP Bands: Two standard deviation bands for identifying overextension or fair value zones
• Full Visual Control:
• Toggle each band on/off individually
• Adjust color, line width, and line style (solid, dotted, dashed)
• Built for Clarity: Designed to stand out on both light and dark charts
This script is ideal for:
• Identifying macro confluence zones
• Defining risk during trend pullbacks
• Confirming breakout legitimacy
• Layering with other tools like Market Cipher, VRVP, and Fib levels
Inspired by the work of LonesomeTheBlue, Algokid, and other pros—this is a cleaner, more flexible and updated alternative for precision trading.
Script created and published by @ImmortalEmerson
For advanced swing traders, crypto analysts, and macro trend specialists.
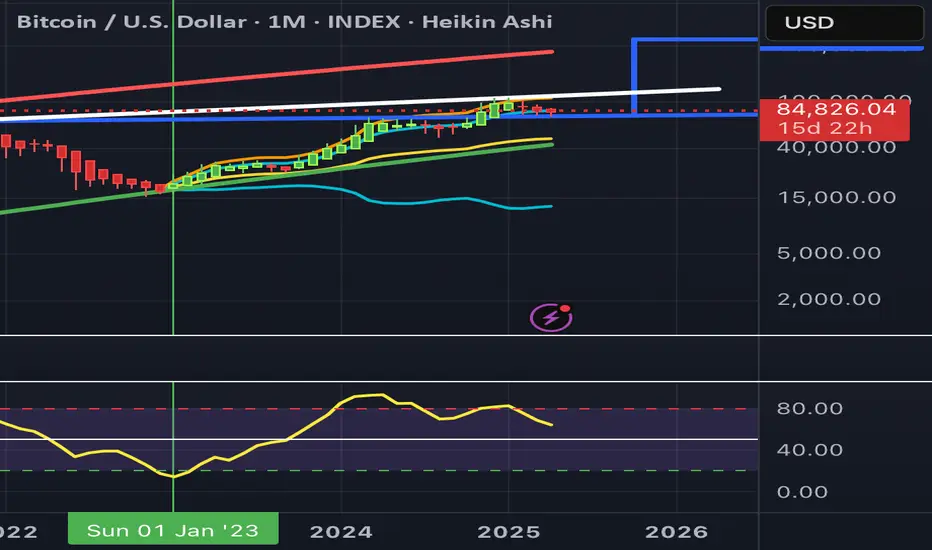
Swing Structure + Session Sweeps“Scalper-Friendly Trend & Sweep Detector”
Swing Structure + Session Sweeps with TEMA Cloud
This powerful all-in-one tool is designed for intraday traders, swing traders, and scalpers who want to spot high-probability reversals, trend continuations, and liquidity sweeps with confluence.
🔹 Core Features
Multi-layered TEMA Cloud (9, 20, 34, 50) for clear trend structure
Dynamic Bull/Bear labels when the trend flips
Centerline for TEMA 20 to visualize core trend direction
Session-based liquidity sweep detection (Asia, London, NY)
Volume and absorption dots to catch hidden pressure
Swing high/low detection (external and internal)
Visual VWAP, daily highs/lows, and customizable session zones
Optional alerts for volume spikes, absorption, and reversal sweeps
📈 Use it to:
Confirm directional bias
Anticipate pullbacks and breakouts
Identify volume-backed reversals
Align trades with session strength and swing confluence
⚙️ Built for scalpers, intraday opportunists, and precision chartists alike.

Radi IQ [TradingIQ]Introducing "Radi IQ".
Radi IQ is a comprehensive market structure indicator designed to provide traders with a detailed view of key price levels and market behavior. It combines several analytical methods—including internal and external structure analysis, fair value gaps, order blocks, breaker blocks, rejection blocks, premium discount zones, equal levels, directional liquidity grabs, and trend meters —to help users better understand areas of support and resistance, potential turning points, and liquidity events in the market.
Key Components and Their Functions
Market Structure Analysis
Internal and External Structure : The indicator evaluates market structure on two levels. The internal analysis focuses on immediate price action (e.g., recent support/resistance and swing points), while the external analysis uses a higher timeframe to provide context. This dual approach helps to confirm the strength of key levels by comparing short-term moves with the broader market trend.
Break of Structure (BoS) and Change of Character (CHoCH) : These signals highlight moments when the market shifts its behavior. A BoS indicates that a previous level of support or resistance has been overcome, while a CHoCH signals a change in the market’s character. Both are marked clearly on the chart using distinct color codes.
Break of Structure + (BoS+) and Change of Character + (CHoCH+) : These signals highlight moments when the market shifts its behavior and is confirmed by prior price action. A BoS + indicates that a previous level of support or resistance has been overcome, while price action achieves higher highs and higher lows (resistance break) or lower highs and lower lows (support break). CHoCH + signals a change in the market’s character when supported by prior price action - lower highs for a support break and higher lows for a resistance break.
BoS and CHoCH
The image above shows BoS and CHoCH identified on the price chart, and explains what each signifies.
A Break Of Structure (BoS) occurs when price decisively moves beyond a previously established support or resistance level. It indicates that the current trend or market pattern is being challenged, and the market may be ready to change direction.
A Change of Character (CHoCH) describes a shift in how the market behaves. A CHoCH occurs when, in an uptrend, a previously established support level breaks, or in a downtrend, a previously established resistance level breaks.
This break indicates that the market's typical structure is shifting, suggesting that the current trend may be losing its strength and that a reversal or a new trend could be developing.
CHoCH+
The image above explains CHoCH+ and how it forms, while highlighting an instance where a downside CHoCH+ formed following lower highs.
A Change of Character + (CHoCH+) describes a shift in how the market behaves that is supported by prior price action. For support breaks, price must form lower highs before breaking support.
The image above explains CHoCH+ for resistance breaks, while highlighting an instance where a resistance point broke that was supported by prior price action.
BoS+
The image above explains BoS+ and how it forms, while highlighting an instance where an upside BoS+ formed following higher highs and higher lows.
A BoS+ resistance break requires higher highs and higher lows prior to the resistance point being closed over.
The image above explains BoS+ support break, while highlighting an instance where a downside BoS+ formed following lower highs and lower lows.
A BoS+ support break requires lower highs and lower lows prior to the support point being closed under.
Future BoS and CHoCH
Radi IQ also displays where the next BoS and CHoCH points are located.
The image above shows the feature in action. With this, traders will always know where the next key support/resistance breakpoints are before they actually occur.
Fair Value Gaps (FVG)
The indicator identifies gaps in the price where little or no trading occurred—known as fair value gaps. These gaps can act as temporary support or resistance and may indicate areas where the market is likely to correct. FVGs are displayed with clear color gradients that differentiate between upward and downward gaps.
The image above shows an identified upside FVG. In the image, the identified upside FVG acted as a support point for price.
The image above shows an identified downside FVG. In the image, the identified downside FVG acted as a resistance point for price.
Low Volume FVG
In addition to identifying trading FVGs - Radi IQ can also specifically detect low volume fair value gaps. Ideally, these fair value gaps will form inside a low volume node on a volume profile.
Low volume node FVGs are important because these are areas where very little trading occurred and is confirmable, indicating an imbalance in supply and demand. Since few trades took place there, the market often moves quickly through these zones when revisited, which can lead to rapid price changes. This "gap" in trading activity can serve as a signal for potential reversals or fast moves, offering opportunities to enter or exit positions based on expected market behavior.
The image above shows identified FVGs that formed on low volume.
Large Area FVGs
Radi IQ is also capable of filtering out “inconsequential” FVGs. With this, Radi IQ can be enabled to only mark FVGs that cover a wide price range.
The image above shows the feature enabled, and all identified FVGs formed with a wide price range.
Large Area FVGs and Low Volume FVGs Combined
Traders can also enable Radi IQ to only mark FVGs that form on low volume and have a wide price range - allowing traders to only identify the highest quality FVGs on the chart.
Order Blocks and Premium Discount Zones
Order Blocks: Radi IQ detects areas where large orders have previously been placed by institutional traders. These blocks can act as strong levels of support or resistance, and the indicator marks bullish and bearish order blocks with dedicated colors.
What is an order block?
Order blocks are clusters of orders that institutions have executed to enter or exit a market position. They typically form when there is a period of consolidation before a significant move. For example, the last bullish candle before a strong down move may indicate a supply order block, while the last bearish candle before a sharp rally might be considered a demand order block.
Why They Form:
Institutions don’t trade in small, sporadic amounts; they accumulate or distribute large volumes of an asset. To avoid slippage and minimize market impact, they execute these orders over a zone rather than at a single price point. This creates a recognizable “block” on the chart.
Order Block Identification Types
Strength Score
The “Strength Score” order block detection mode is a TradingIQ proprietary ranking system for identified order blocks.
Purpose
The purpose of the “Strength Score” ranking system is to determine the “strength” or significance of an order block and rate the zone’s likelihood to act as support/resistance when retested in the future.
The scoring system ranks from 0 - 10, with “0” indicating a “weak” score or low likelihood of acting as a key support/resistance level when retested in the future.
A rating of “5” indicates a “moderate” score, indicating that the order block has a moderate likelihood of acting as a key support/resistance level when retested in the future.
A rating of “10” indicates a “strong” score, indicating that the order block has a strong likelihood of acting as a key support/resistance level when retested in the future.
How It Works
The score is calculated by examining the price move following the formation of an order block. The stronger the price move after an order block forms - the higher the Strength Score.
The image above shows a bearish order block with a score of “5” identified on the chart. The order block successfully operates as a resistance point when retested.
The image above shows a bullish order block with a score of “5” identified on the chart. The order block successfully operates as a resistance point when retested.
Volume-Based
The volume-based order block detection method detects traditional order blocks, but goes one step further by identifying the highest concentration point of volume for the bar and drawing the order block around this concentration point.
Key features when using the volume-based order block detection method:
The top of the order block is anchored to the top of the highest volume concentration point of the bar
The bottom of the order block is anchored to the bottom of the highest volume concentration point of the bar
The total volume that went into creation of the order block is displayed on the chart
The total volume of the order block is recorded as a percentage relative to the total volume for all order blocks on the chart
The image above shows the detection method in action.
Breaker Blocks
A breaker block is a specific type of order block that gains significance when price breaks through it and then often retests the level as a new area of support or resistance. Essentially, it’s a zone where, after the initial break, the previous level (which once acted as strong support or resistance) flips roles. For example, in an uptrend, if the price falls below a key support level, that level can become a breaker block and act as resistance if the price tries to move back up. Conversely, in a downtrend, a broken resistance level can serve as new support. Traders monitor breaker blocks because they often mark a shift in market sentiment and can provide potential entry or exit points once the market re-engages with these levels.
The image above shows a breaker block above price acting as resistance.
The image above shows a breaker block below price acting as support.
Rejection Blocks
A rejection block is a price area where the market shows a strong unwillingness to move beyond a certain level. This typically happens when price approaches a specific level but then is quickly rejected, leading to a bounce in the opposite direction. In other words, a rejection block forms when traders' orders create a barrier, causing the price to reverse rather than break through. Traders watch these areas closely, as they often signal a strong concentration of supply or demand that could provide potential entry or exit points for trades.
The image above shows both a verified upside rejection block acting as resistance, and an untested downside rejection block.
Rejection blocks are expected to function as strong support/resistance points when retested in the future.
Premium Discount Zones
Premium Discount Zones : These zones reflect areas where price is trading above (premium) or below (discount) a fair value range. They help traders gauge whether the current market price is relatively high or low compared to historical averages.
Premium Discount Zones account for recent swing highs and lows to calculate a fair value along with discount and premium prices over an intermediate time window.
The image above shows the premium and discount price zones in action.
Equal Levels
The indicator also tracks and highlights equal levels, which occur when the market repeatedly tests the same price levels. Equal levels can reinforce the significance of a support or resistance area and are represented by their own set of color markers.
The image above shows Radi IQ distinguishing equal highs and equal lows.
Equal Highs
When you see two or more highs that are approximately the same, it suggests that the market is repeatedly rejecting attempts to push higher. This signals a strong resistance level where sellers (or stop-hunters) are active.
Equal Lows
Similarly, consecutive lows at the same level indicate strong support, where buyers step in consistently, preventing further decline.
Strong Highs and Lows
Strong High
A strong high is a price level where the market repeatedly fails to push higher. Typically, it’s characterized by:
Rejection: Price approaches the high but then reverses sharply, often leaving long upper wicks on the candlestick chart.
Consolidation: Multiple bars might show highs that are very close in value (often termed "equal highs"), indicating a well-established resistance zone.
Market Sentiment: This pattern suggests that sellers are actively defending that level, preventing further upward movement.
Strong Lows
Conversely, a strong low is a price level where the market repeatedly fails to break lower. It is identified by:
Bounce Back: Price touches the low and then rebounds sharply, often leaving long lower wicks.
Consistency: Multiple lows occur around the same level (sometimes referred to as "equal lows"), marking a solid support area.
Market Sentiment: This indicates that buyers are stepping in at that level, absorbing selling pressure and supporting the price.
The image above shows Radi IQ detecting both a strong high and strong low, while the detected strong low acts as support when retested.
Liquidity Grabs
Liquidity grabs occur when the market temporarily moves to absorb liquidity, often triggering stop-loss orders and leading to rapid price movements. Radi IQ flags these events by identifying conditions where price moves against recent pivots, helping traders spot potential liquidity-related reversals or breakouts.
The image above shows Radi IQ identifying both an upside liquidity grab and a downside liquidity grab.
Upside Liquidity Grab (Bearish)
An upside liquidity grab happens when the price moves above a well-known resistance area or recent high. This move is often short-lived.
Many traders place stop-loss orders or pending buy orders just above resistance levels. Institutional players may intentionally push price upward to trigger these orders, thereby “grabbing” the liquidity available at that level.
Downside Liquidity Grab (Bullish)
A downside liquidity grab is the mirror image: the price briefly dips below a key support level or recent low.
Traders often place stop-loss orders or pending sell orders just below support levels. An intentional drop below this support can trigger these stops, allowing institutional players to capture liquidity.
Multi-Timeframe Analysis and Swings
By using data from different timeframes, Radi IQ offers a broader perspective on market trends. It highlights significant swing highs and swing lows, providing visual cues that indicate the market’s directional bias. This feature assists traders in identifying both short-term opportunities and long-term trends.
The image above shows Radi IQ detecting higher swings and lower swings.
IQ Meters / Fibometer
IQ Meters (Fibometers) are a proprietary TradingIQ tool that allows traders to easily identify the highs and lows of the current trend and where current price is relative to these points.
The image above depicts the IQ Meters—an exclusive TradingIQ tool designed to help traders evaluate trend strength and retracement opportunities.
When the lower timeframe Zig Zag IQ and the higher timeframe Zig Zag IQ are out of sync (i.e., one is uptrending while the other is downtrending, with no active positions), the meters display a neutral color as shown in the image.
The key to using these meters is to identify trend unison and pinpoint key trend retracement entry opportunities. Fibonacci retracement levels for the current trend are interlaced along each meter, and the current price is converted to a retracement ratio of the trend.
These meters can mathematically determine where price stands relative to the larger and smaller trends, aiding in identifying entry opportunities.
The top of each meter indicates the highest price achieved during the current price move.
The bottom of each meter indicates the lowest price achieved during the current price move.
When both the larger and smaller trends are in sync and uptrending, or when a long position is active, the IQ meters turn green, indicating uptrend strength.
When both meters are green, it indicates uptrend strength as both the higher timeframe trend and lower timeframe trend are in unison. Look for price to retrace to key fibonacci retracement levels during this time period.
When both trends are in sync and downtrending, or when a short position is active, the IQ meters turn red, indicating downtrend strength.
When both meters are red, it indicates downtrend strength as both the higher timeframe trend and lower timeframe trend are in unison. Look for price to retrace to key fibonacci retracement levels during this time period.
Summary
Radi IQ serves as a robust, data-driven tool for traders who seek a deeper understanding of market structure. By integrating internal and external analysis, fair value gap detection, order block identification, premium discount zoning, equal level tracking, liquidity grabs and much more into one indicator, it offers a multi-layered view of the market. This helps traders not only recognize potential turning points and areas of market stress but also manage risk more effectively and plan their trades with greater precision. The indicator’s clear visual representation and dynamic updates make it a practical addition to any trader’s toolkit.
Платный скрипт