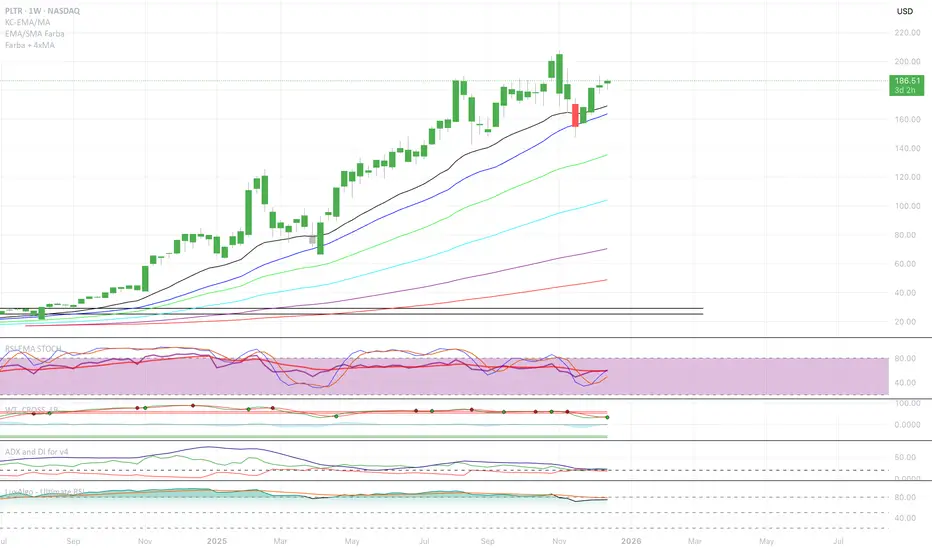
Advanced custom multi MA signals (EMA/SMA/VWMA/VWAP) Features of Multi Moving Averages
The biggest enemy in trading is "Noise." If you get swayed by minute fluctuations on the chart, you end up missing the forest for the trees.
This indicator (Advanced Custom Multi MA Signals) is not just a simple line. By combining the three core elements of Price, Time, and Volume, it acts as a navigation system that visualizes the market's "true trend." In particular, the ability to analyze 5 moving averages simultaneously across various timeframes is akin to viewing a 3D map of the battlefield.
Understanding Core Concepts
This indicator supports 4 types of moving averages. It is crucial to clearly understand the nature of each tool.
SMA (Simple Moving Average): The most basic average value. Since it produces fewer whipsaws (false signals), it is used as a baseline to judge the "long-term trend."
EMA (Exponential Moving Average): Places more weight on recent prices. It reacts sensitively to market changes, making it advantageous for identifying "entry points."
VWMA (Volume Weighted Moving Average): Incorporates "volume" into the price calculation. It acts as a "false signal filter," weeding out price moves that aren't backed by trading volume.
VWAP (Volume Weighted Average Price): The benchmark price used by institutional investors for daily trading. It is calculated based on the session, regardless of the period settings. It is considered the "lifeline" of day trading.
Indicator Settings Guide
Open the settings window and tune it to fit your trading style.
MA 01 ~ 05 (Moving Average Settings)
MA Type: Select according to your purpose. (Generally, EMA is recommended for short-term analysis, SMA/VWMA for long-term).
Length: Enter the period you wish to analyze (e.g., 20, 60, 120, 200).
Timeframe: This is the core feature. It allows you to overlay moving averages from a higher timeframe (e.g., 4-hour, Daily) onto the chart you are currently viewing (e.g., 15-minute).
Signal Option (Trading Signals)
Golden Cross (GC) / Death Cross (DC): Captures the moment the short-term line breaks through the long-term line. You can run up to 3 strategies simultaneously.
Ribbon Gradient (Trend Visualization)
Represents the gap between two moving averages with color. As the color deepens and the width expands, it indicates a powerful trend; if the width narrows, it suggests a high probability of a trend reversal.
5 Usage Strategies
The highlight of this indicator is the cross strategy utilizing the "Multi-Timeframe (MTF)" feature. Familiarize yourself with the 5 example strategies below and set up your own strategy based on your expertise.
💡 Tip 1. Do not go against the "Major Trend" (The Authority of the Weekly Candle)
Settings: Set MA5 to .
Interpretation: The Weekly 50 line is the "major trend line" managed by institutions and market makers. If the current price is above this line, maintain only a "Buy (Long)" bias; if below, maintain only a "Sell (Short)" bias. Adhering to this rule alone can help you avoid massive losses.
💡 Tip 2. Highly Reliable "Swing Signal" (Daily Golden Cross)
Settings: In Signal 1, configure the Short MA to and the Long MA to .
Interpretation: A Golden Cross where the 4-Hour 50 EMA breaks above the Daily 50 EMA often signifies a major "trend reversal" rather than a temporary rebound. This provides an ideal entry signal for office workers or swing traders who need high reliability.
💡 Tip 3. 4-Hour Candle as the Standard for "Precision Entry"
Situation: When the Daily trend is rising (Bullish alignment).
Strategy: While watching the 15-minute or 1-hour chart, set the indicator's Signal 2 to the cross of and .
Interpretation: When the Daily chart is in an uptrend, a Golden Cross occurring on the 4-Hour chart marks "the point where a correction (pullback) ends and the rise resumes." This is the entry point with the best risk-to-reward ratio.
💡 Tip 4. Filtering Out "Fake Signals" (The Secret of Volume)
Strategy: When creating a cross signal, try using VWMA (Volume Weighted) for the Long MA, even if you use EMA for the Short MA.
Reason: A Golden Cross caused simply by a rise in price can be a trap. However, if it breaks through the heavy VWMA line accompanied by volume, it is strong evidence that "genuine liquidity" has entered.
💡 Tip 5. Remember the "Hierarchy" (Higher Timeframe Priority Rule)
Principle: If a Golden Cross (Buy Signal) appears on the 4-Hour chart, but the Daily chart is in a Death Cross (Sell Signal) state, do not enter.
Interpretation: A signal from a lower timeframe cannot overcome the power of a higher timeframe. The professional approach is to trade with significant volume only when signals align (Sync) in the order of Weekly > Daily > 4-Hour. Keep this indicator's dashboard feature on and always check the status of higher timeframes.
Signal Generation Principle (Operating Mechanism)
Signals are generated when the set short-term moving average and long-term moving average cross each other.
📈 1. Golden Cross (BUY = Buy Signal)
Situation: The moment the short-term MA crosses upward from below the long-term MA.
Principle: It implies that recent buying pressure has broken through the resistance level accumulated over a long period.
📉 2. Death Cross (SELL = Sell Signal)
Situation: The moment the short-term MA crosses downward from above the long-term MA.
Principle: It implies that recent selling pressure has collapsed the long-term support line.
※ If the candles are not displaying correctly or are flickering, please set the indicator's 'Visual order' to 'Bring to front' as shown in the image below.
Investment Caution and Disclaimer
Before using this indicator for actual trading, please strictly read the contents below.
① Auxiliary indicators are a "Compass," not a "Book of Prophecy."
This indicator is merely a tool that mathematically calculates and visualizes past price data. A "magic indicator" that predicts future price fluctuations 100% accurately or guarantees profit does not exist. The signals provided are for reference only and must never be the sole basis for entry/exit decisions.
② The responsibility for all investments lies with "Yourself."
Financial investment (Cryptocurrencies, Stocks, Futures, etc.) involves high volatility and is a risky activity that can result in the loss of some or all of the principal. The final responsibility for all trading results (profits and losses) incurred by utilizing this indicator lies entirely with the investor. The distributor and developer accept no legal responsibility for investment results under any circumstances.
③ Past data does not guarantee the future.
Even a Golden Cross that fit perfectly in backtesting or past charts may operate differently in tomorrow's market situation (News, Macroeconomics, Unexpected Variables, etc.). Do not rely solely on technical analysis; you must conduct fundamental analysis and risk management in parallel.
④ Risk management is the top priority.
No matter how promising a signal appears, "all-in trading" (investing all assets in a single trade) is a shortcut to bankruptcy. More important than the indicator itself is adhering to the principles of strict scaling in (split buying) and Stop-Loss.
Скользящие средние

Custom Reversal Oscillator [wjdtks255]📊 Indicator Overview: Custom Reversal Oscillator
This indicator is a momentum-based oscillator designed to identify potential trend reversals by analyzing price velocity and relative strength. It visualizes market exhaustion and recovery through a dynamic histogram and signal dots, similar to premium institutional tools.
Key Components
Dynamic Histogram (Bottom Bars): Changes color based on momentum strength. Bright Green/Red indicates accelerating momentum, while Darker shades suggest fading strength.
Signal Line: A white line tracing the core momentum, helping to visualize the "wave" of the market.
Buy/Sell Dots: Small circles at the bottom (Mint) or top (Red) that signal high-probability reversal points when the market is overextended.
📈 Trading Strategy (How to Trade)
1. Long Entry (Buy Signal)
Condition 1: The price should ideally be near or above the 200 EMA (for trend following) or showing a Bullish Divergence.
Condition 2: The Histogram bars transition from Dark Red to Bright Green.
Condition 3: A Mint Buy Dot appears at the bottom of the oscillator (near the -25 level).
Entry: Enter on the close of the candle where the Buy Dot is confirmed.
2. Short Entry (Sell Signal)
Condition 1: The price is struggling at resistance or showing a Bearish Divergence.
Condition 2: The Histogram bars transition from Dark Green to Bright Red.
Condition 3: A Red Sell Dot appears at the top of the oscillator (near the +25 level).
Entry: Enter on the close of the candle where the Sell Dot is confirmed.
3. Exit & Take Profit
Take Profit: Close the position when the Signal Line reaches the opposite extreme or when the histogram color starts to fade (loses its brightness).
Stop Loss: Place your stop loss slightly below the recent swing low (for Longs) or above the recent swing high (for Shorts).
💡 Pro Tips for Accuracy
Watch for Divergences: The most powerful signals occur when the price makes a lower low, but the Custom Reversal Oscillator makes a higher low. This indicates "Hidden Strength" and a massive reversal is often imminent.

AI Reversal Signals Custom [wjdtks255]📊 Indicator Overview: AI Reversal Signals Custom
This indicator is a comprehensive trend-following and reversal detection tool. It combines the long-term trend bias of a 200 EMA with highly sensitive RSI-based reversal signals and momentum visualization. It is designed to capture market bottoms and tops by identifying exhaustion points in price action.
Key Features
200 EMA (Trend Filter): A gold line representing the long-term institutional trend. It helps traders distinguish between "buying the dip" and "catching a falling knife."
Reversal Buy/Sell Labels: Real-time signals that appear when the market recovers from extreme overbought or oversold conditions.
Dynamic Background Clouds: Visual indicators of trend strength changes, highlighting potential entry zones.
Momentum Histogram: Internal calculations mimic the "Bottom Bars" seen in professional suites to track the velocity of price movement.
📈 Trading Strategy (How to Trade)
1. High-Probability Long Setup (Buy)
Trend Confirmation: Price should ideally be trading above the 200 EMA for the highest success rate.
Signal: Wait for the "BUY" label to appear below the candle.
Momentum: Confirm with the Light Green background or histogram shift indicating recovery.
Entry: Enter on the close of the signal candle.
2. High-Probability Short Setup (Sell)
Trend Confirmation: Price should ideally be trading below the 200 EMA.
Signal: Wait for the "SELL" label to appear above the candle.
Momentum: Confirm with the Red background or histogram fading from green to red.
Entry: Enter on the close of the signal candle.
3. Risk Management
Stop Loss: Place your Stop Loss slightly below the recent swing low for Buy orders, or above the recent swing high for Sell orders.
Take Profit: Exit when the price reaches a major support/resistance level or when an opposing signal appears.
💡 Professional Tip
For the best results, use this indicator on the 15-minute or 1-hour timeframes. The most powerful "Ultimate Reversal" signals occur when there is a Bullish Divergence (Price making lower lows while the RSI makes higher lows) followed by a confirmed "BUY" label.

Triple Supertrend + EMA CrossoverCustomized 3 supertrend and EMA crossover which is helpful for identification of the trend.

ATR Daily & Weekly With Stop Buffer this script shows Daily & Weekly ATR and also add 10% Stop buffer calculation so you can add stop loss.


MACD Divergences + RSI/ADXMACD Divergences + RSI/ADX Indicator
This indicator combines the classic MACD divergence detection with real-time RSI and ADX monitoring in fixed corner labels.
🔹 MAIN FEATURES:
- Automatic MACD divergence detection (Classic & Hidden)
- Visual RSI and ADX labels fixed in the right corner
- Color-coded trend direction (Green: DI+ > DI- | Red: DI- > DI+)
- Customizable MACD settings (Fast/Slow Length, Signal Smoothing)
- Configurable RSI and ADX periods
- Built-in alerts for all divergence types
🔹 DIVERGENCE TYPES:
- Classic Bullish: Price makes lower lows, MACD makes higher lows (Reversal signal)
- Classic Bearish: Price makes higher highs, MACD makes lower highs (Reversal signal)
- Hidden Bullish: Price makes higher lows, MACD makes lower lows (Continuation signal)
- Hidden Bearish: Price makes lower highs, MACD makes higher highs (Continuation signal)
🔹 RSI & ADX DISPLAY:
- Fixed labels in top-right (RSI) and bottom-right (ADX) corners
- Real-time values updated on every bar
- Background color changes based on directional movement (DI+ vs DI-)
- Large, easy-to-read format
🔹 HOW TO USE:
1. Watch for divergence patterns on MACD histogram
2. Monitor RSI for overbought/oversold conditions
3. Check ADX for trend strength (>25 = strong trend)
4. Green labels = Bullish momentum (DI+ > DI-)
5. Red labels = Bearish momentum (DI- > DI+)
🔹 BEST FOR:
- Swing trading on 4H and Daily timeframes
- Trend-following strategies with mo

Bollinger Bands + MA 50/100/200📊 Bollinger Bands + MA 50 / 100 / 200 Indicator
This indicator combines Bollinger Bands with key Moving Averages (50, 100, 200) to help you spot trend direction, volatility, and potential reversal zones in one clean view.
🔹 Bollinger Bands
* Customizable length & MA type (SMA, EMA, RMA, WMA, VWMA)
* Visualizes market volatility
* Upper & lower bands help identify overbought / oversold conditions
🔹 Moving Averages
* MA 50 → Short-term trend
* MA 100 → Medium-term trend
* MA 200 → Long-term trend & major support/resistance
* Easy toggle on/off for clean charting
💡 How to use
* Price near upper band + strong MA trend → possible continuation
* Price near lower band → watch for bounce or breakdown
* MA alignment (50 > 100 > 200) → bullish trend
* MA cross & BB squeeze → potential breakout incoming
⚠️ Best used with price action & risk management
📌 Works on stocks, crypto, forex, indices

Double Cross Strategy - directional color plus golden crossCandle color changes to dark green when opening below 9/20 SMAs when 9 is below the 20 and closes above.
Candle color changes to dark red when opening above the 9/20 SMAs when the 9 is above the 20 and closes below.
Candle color changes to yellow when either of the above occurs plus crosses the vwap.

MA20 Dual Color Line IndicatorMA20 Dual Color Line Indicator
The MA20 Dual Color Line is a simple yet effective moving average indicator designed to help traders quickly visualize price trends and potential reversal points. It plots a 20-period Simple Moving Average (SMA) that changes color based on the relationship between the current closing price and the moving average itself.
🔶 How It Works
When the close price is above the MA20, the moving average line turns green, suggesting a potential bullish trend.
When the close price is below the MA20, the line turns red, indicating a possible bearish trend.
If the price is exactly at the MA20, the line remains white, highlighting a neutral or decision point.
📈 Ideal For
Identifying trend direction at a glance
Spotting support and resistance levels around the MA20
Enhancing visual analysis without cluttering the chart
🛠 Features
Clean and customizable line width
Real-time color switching based on price action
Overlay display to keep charts organized
This indicator is perfect for traders who prefer a clear, color-coded visual aid to complement their trading strategy. Whether you’re a beginner or an experienced trader, the MA20 Dual Color Line helps you stay aligned with the short-term trend.

Multiple SMAs-EMAs & CrossesMoving averages (MA) are the bedrock of trend analysis. Choosing between Simple (SMA) and Exponential (EMA) depends on whether you prioritize stability or speed.SMA vs. EMA: The Main DifferenceThe core difference lies in how they handle data.
Simple Moving Average (SMA): Treats all days equally. A 50-day SMA averages the last 50 closing prices with no bias. It is smoother and less prone to "fake-outs," making it the gold standard for identifying long-term trends (e.g., the 200-day SMA).
Exponential Moving Average (EMA): Places more weight on the most recent price data. It reacts much faster to sudden market shifts. Short-term traders (scalpers and day traders) prefer EMAs to catch trend changes early.
The Crossover Strategy
A crossover occurs when a "fast" (short-period) MA crosses a "slow" (long-period) MA. This signals a shift in market momentum.
Golden Cross: Fast MA (e.g., 50) crosses above Slow MA (e.g., 200). Bullish: Indicates a potential long-term uptrend.
Death Cross: Fast MA (e.g., 50) crosses below Slow MA (e.g., 200).Bearish: Indicates a potential long-term downtrend.
Using Multiple Moving Averages, Traders often use a "ribbon" or a stack of three MAs to filter noise: Short-term (e.g., 9 or 20): Shows immediate price direction.Medium-term (e.g., 50): Acts as a trend filter and dynamic support/resistance. Long-term (e.g., 200): Defines the "big picture" macro trend.

HTF EMA Bias BackgroundThis indicator gives you the cross over points from EMAs on the 15 min chart as a coloured background, you can then go to the 1 min chart to see the overlay. Useful for a higher time frame BIAS.

3VWMA MTF3VWMA MTF – IRONGAR plots three Volume Weighted Moving Averages (VWMA) on your chart, with multi-timeframe support.
-It is designed to help traders identify trend direction, dynamic support & resistance, and
volume-confirmed momentum across different timeframes — all in one clean indicator.
-The indicator calculates three separate VWMAs:
VWMA 7 (Green) – Short-term momentum
VWMA 25 (Blue) – Medium-term trend
VWMA 99 (Red) – Long-term structure
-You can choose:
Chart timeframe (default), or
A custom higher/lower timeframe using the VWMA Timeframe input
-Each VWMA is calculated on the selected timeframe and plotted on the current chart.
A Volume Weighted Moving Average (VWMA) gives more weight to candles with higher trading volume.
-Formula: VWMA = Σ(Price × Volume) / Σ(Volume)
This means:
High-volume moves have more influence
Low-volume noise has less impact
Best used in combination with price action and proper risk management.
-Huge shoutout to my teacher @tradecitypro for all his time and effort. I'm so grateful!
-Next, I will break down my strategy and show you how to apply it for yourself.
simple and easy :))))

MARKET CONDITIONS TOOLBOX PROMARKET CONDITIONS TOOLBOX PRO** is a visual market-state dashboard designed to summarize multiple technical conditions of the S&P 500 ETF (SPY) in a single table.
The script pulls SPY data from user-selectable higher timeframes (daily by default) and evaluates several widely used technical indicators, converting each into a simple **Bullish / Neutral / Bearish** status. The results are displayed in a compact table for quick reference.
Indicators included:
-Directional Strength (based on directional movement)
-MACD (positive vs. negative momentum)
-RSI (above or below midpoint)
-Stochastic Oscillator
-CCI
-Momentum Velocity (custom weighted momentum calculation)
-SPY daily candle direction (green/red/neutral)
Each indicator is assessed independently using objective threshold rules (for example, above or below zero or 50). No indicator is modified to repaint or look ahead.
An overall Market Condition is shown:
-Bullish when all indicators and the SPY daily candle align positively
-Bearish* when all indicators and the SPY daily candle align negatively
-Neutral when conditions are mixed
A simplified -Risk Status- (“Risk On”, “Risk Off”, or “Neutral”) mirrors this alignment to provide a high-level market context.
Key characteristics:
-Uses SPY as a broad market proxy
-Multi-timeframe capable via user inputs
-Non-predictive, informational display only
-No alerts, trade entries, exits, or signals
-Designed for market context, not automation
I use this tool really to gauge risk, when i'm paying with the direction of the market, when to risk off.

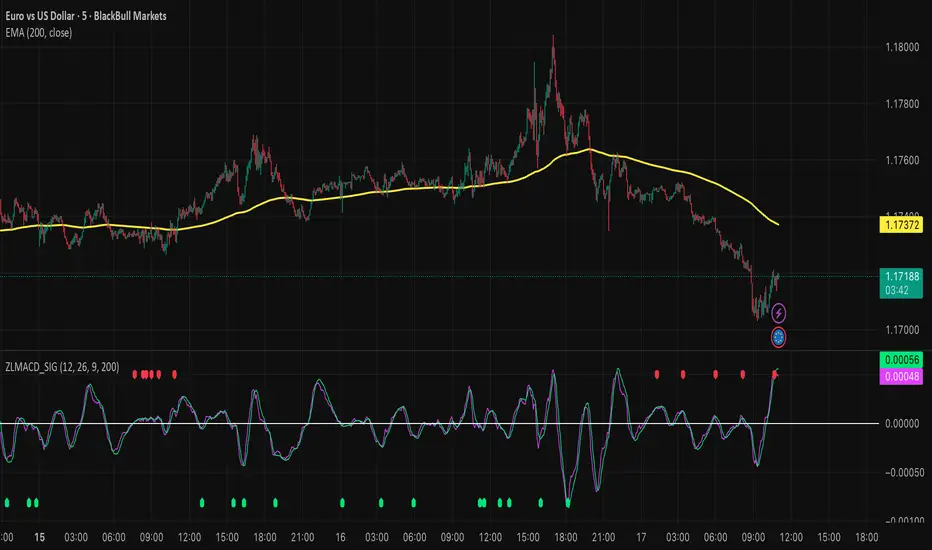
Zero Lag MACD and EMA 200 with SignalsZero Lag MACD with EMA Filter and Smart Signals
This indicator is an enhanced version of the traditional MACD that uses Zero Lag EMA calculations to provide faster and more responsive signals for scalping and day trading.
Key Features:
🎯 Zero Lag Technology - Uses double-smoothed EMA calculations to eliminate lag and provide earlier signals compared to standard MACD
📊 Clean Visualization - Displays histogram with MACD and Signal lines for clear trend analysis
🔍 Smart Signal Logic - Only shows valid trading signals based on strict conditions:
Buy Signal (Green dot at bottom): Triggers when price is above 200 EMA AND MACD crosses Signal line from below AND crossover occurs below zero line
Sell Signal (Red dot at top): Triggers when price is below 200 EMA AND MACD crosses Signal line from above AND crossover occurs above zero line
🔔 Built-in Alerts - Easy alert setup for both buy and sell signals so you never miss a trading opportunity
📈 200 EMA Filter - Incorporates trend filter to avoid counter-trend trades and improve signal quality
⚙️ Fully Customizable - Adjust all parameters:
Fast EMA Length (default: 12)
Slow EMA Length (default: 26)
Signal Length (default: 9)
EMA Filter Length (default: 200)
How to Use:
-Add the indicator to your chart
-Look for green dots (buy signals) when price is in an uptrend above 200 EMA
-Look for red dots (sell signals) when price is in a downtrend below 200 EMA
-Set up alerts by clicking "Create Alert" and selecting "Buy Signal" or "Sell Signal"
-Use signals in conjunction with your trading strategy and risk management
Best Practices:
-Works best on 1-15 minute timeframes for scalping
-Combine with support/resistance levels for confirmation
-Use proper stop-loss and take-profit levels
-Not all signals will be profitable - use proper risk management
-Signals are filtered to reduce noise and false entries
Color Scheme:
Histogram: Red (bearish) / Cyan (bullish)
MACD Line: Fuchsia/Pink
Signal Line: Lime/Green
Buy Signal: Green dot (bottom)
Sell Signal: Red dot (top)
This indicator is perfect for traders who want a cleaner, faster-responding MACD with built-in trend filtering and clear entry signals. Free to use and customize!
Besho SetupThe Moving Averages (The Colored Lines) These three lines are the backbone of this system. They are perfectly aligned for a bullish trend (Yellow > Green > Red) and act as protective shields for the price:
The Red Line (at the bottom): This is the "General Trend Line," typically the EMA 200 (200-period Exponential Moving Average).
Function: It separates the uptrend from the downtrend. As long as the price remains well above it, the trend is strongly "bullish." Notice that the price is very far from it, indicating strong momentum.
The Green Line (in the middle): This is the "Intermediate Support Line," typically the EMA 50 or EMA 100.
Function: It acts as a bounce zone (Dynamic Support) during deep corrections. The price is shown to respect this level well in the image.
The Yellow Line (closest to the price): This is the "Fast Momentum Line," typically the EMA 20 or EMA 21.
Function: It is used for quick entries and exits. As long as the candles are closing above it, the bullish wave is sharp and continuous.

RSI with 3 Separate Smoothing AveragesRSI has 3 moving averages, to help trade better
RSI period can be adjusted
Moving average has multiple selections (SMA, EMA, HMA)
moving average cross over can be used as signal for trades
Trade at your own risk

ODTE Layman Signals 📌 Script Name
Layman Options Signals – Structured BUY CALL / BUY PUT with SL & TP
📖 Overview
This indicator is a complete, finished intraday trading system designed to simplify options trading (including 0DTE and weekly options) by converting price action and market structure into clear, actionable signals.
The script performs all analysis in the background and displays only what the trader needs to execute consistently:
BUY CALL or BUY PUT
Predefined Stop Loss (SL)
Two Take Profit levels (TP1 and TP2)
Trade status and levels displayed in a live status box
The focus of this tool is execution discipline, not prediction.
🧠 Core Concepts Used (What Makes This Script Original)
This script combines multiple price-action concepts into a single, rule-based framework:
1️⃣ Opening Range Breakout (ORB)
The script calculates the opening range high and low using the first X minutes of the regular session.
Trades are only allowed above ORB high for CALLs and below ORB low for PUTs.
This filters low-quality trades during early chop.
2️⃣ Market Structure Confirmation
CALL trades require higher highs and higher lows
PUT trades require lower lows and lower highs
This prevents trading against structure.
3️⃣ Retest & Liquidity Sweep Validation
Breakouts are validated using:
ORB retests (price accepts above/below the range)
Liquidity sweeps (false breakouts that trap traders)
This helps reduce fake breakouts.
4️⃣ Volatility-Aware Risk Management
Stop losses are placed using market structure + ATR buffer
This avoids stops being placed at obvious levels.
5️⃣ Multi-Target Trade Management
TP1 = partial profit (risk reduction)
TP2 = runner target (trend continuation)
After TP1, stop loss can move to breakeven (optional)
6️⃣ Discipline Controls
Only one active trade at a time
Cooldown period after a stop loss
Prevents over-trading and revenge trading
📊 What the Indicator Displays
The script plots the following directly on the chart:
Entry level
Stop Loss (SL)
Take Profit 1 (TP1)
Take Profit 2 (TP2)
Opening Range High & Low
It also includes a Status Box that always shows one of the following states:
WAIT
BUY CALL
BUY PUT
IN TRADE
COOLDOWN
This allows traders to understand the current state at a glance without reading code.
▶️ How to Use the Indicator
Recommended Timeframes
1-minute or 2-minute charts
Intraday use only
Entry Rules
When BUY CALL appears → Buy an ATM or slightly ITM call
When BUY PUT appears → Buy an ATM or slightly ITM put
Risk Management
Exit immediately if price hits the SL line
Take partial profits at TP1
Hold remaining position for TP2 if conditions allow
When Status Shows WAIT or COOLDOWN
No trade should be taken
⚙️ Recommended Instruments
SPY / QQQ
Liquid large-cap stocks
Intraday options (0DTE / weeklies)
⚠️ Important Disclaimer
This script is provided for educational purposes only.
It is not financial advice
It does not guarantee profits
It does not place trades automatically
Options trading involves significant risk
Always test using paper trading or small size before live use.
🎯 Who This Script Is For
✔ Traders who want clear rules
✔ Traders who prefer price action over indicators
✔ Options traders who value risk management
✔ Users who want less chart clutter and more discipline
❌ Not intended for swing trading
❌ Not intended for automated trading systems
🧩 Final Notes
This is a complete, finished indicator, not a test or experimental script.
All logic is deterministic, non-repainting, and designed for real-time use.
The philosophy behind this tool is simple:
Good trading comes from structure, discipline, and risk control — not prediction.

Forked from Micha Stocks WatermarkShow Alternate data for selected symbol, ticker ID, MarkCap, SMA Below or Above Icon (red/green), ATR, Next Earning Days left, I added Float (Outstanding Number of Shares tradable)

EMA SMA Rhythmic Lite Public V1.1 by SRTEMA SMA Rhythmic Lite Public V1.1 by SRT
A clean, lightweight trend-rhythm engine designed for traders of all levels. Built on a robust combination of EMAs and SMAs, this indicator provides clear directional bias signals while remaining fully non-repainting.
Key Features:
Multi-Timeframe Friendly: Works seamlessly on M1 to Daily (D) charts. MA stacking and signal logic automatically adapt to any timeframe.
Bias Detection: Determines bullish, bearish, or neutral market conditions using a 4-MA stack.
Engulfing Bar (EB) & Long-Tail Body (LTB) Detection: Highlights strong price action setups, filtered by body size and ATR-based thresholds.
Flush Markers: Visual cues showing where price aligns with MA stack for trend confirmation.
Bias Table: Displays current MA bias and presence of LTB on the chart for at-a-glance clarity.
Advanced Alerts:
Flush Alerts: Trigger when MA stack aligns with price, signaling trend continuation.
Combo Alerts: Trigger when EB or LTB appears in alignment with MA bias.
LTB-only Alerts: For monitoring significant price action reversals.
Customizable Visualization: Colors, widths, and visibility of all MAs, labels, and flush dots can be tailored to your preference.
Why Lite?
This is the most lightweight version in the SRT rhythm series, optimized for any timeframe, from scalping to swing trading. Perfect for traders who want a clear bias engine without unnecessary complexity.
If you like this EMA SMA Rhythmic Lite, you may also explore:
▶ H1 Bias Rhythmic Lite Public (Free)
▶ SRT Premium Series
Invite-only advanced indicators with stronger bias enforcement and execution frameworks.

EMA RANGEEMA RANGE
EMA RANGE is a simple, price-focused indicator that plots an Exponential Moving Average (EMA) with a dynamic ATR-based range above and below it. The ATR bands adapt to market volatility, helping traders visualize normal price movement and identify potential expansion or compression zones.
🔹 Features
Customizable EMA length
ATR range bands plotted above and below the EMA
Adjustable ATR length and multiplier
Toggle to enable or disable ATR ranges
Fully customizable colors and line thickness from the Style tab
🔹 How It Works
The EMA serves as the central trend reference.
The Average True Range (ATR) measures volatility.
Upper and lower bands are calculated as:
EMA ± (ATR × Multiplier)
When price remains inside the range, conditions are considered normal. Moves outside the range may signal increased volatility, momentum expansion, or potential breakout conditions.
🔹 Best Use Cases
Trend continuation and pullback analysis
Volatility-based risk framing
Dynamic support and resistance visualization
Works on any market and timeframe
EMA RANGE is designed to stay clean, responsive, and easy to interpret—making it suitable for both discretionary and systematic traders.

Sell-to-Buy Pressure RatioSell/Buy Pressure Ratio
What It Measures
The Sell/Buy Pressure Ratio quantifies the aggressiveness of sellers versus buyers by comparing conviction-weighted volume on down candles versus up candles. It answers a simple question: who is more committed right now—buyers or sellers?
How It Works
The indicator examines each candle and determines directional conviction based on where price closes within the bar's range. A candle that closes near its high shows strong buyer conviction. A candle that closes near its low shows strong seller conviction. This conviction percentage is then multiplied by volume to create a weighted measure of buying and selling pressure.
The ratio divides total selling pressure by total buying pressure over a lookback period. A ratio of 1.5 means sellers are 50% more aggressive than buyers. A ratio of 0.5 means buyers are twice as aggressive as sellers.
Key Features
Conviction weighting: Not all volume is equal. A strong close near the high counts more than a weak close mid-range.
Doji handling: Indecisive candles (where open and close are nearly equal) split volume 50/50 between buyers and sellers.
Volume filtering: Low-volume bars below 60% of average are excluded to focus on meaningful activity.
Normalized output: Optional -1 to +1 scale for cross-stock comparison.
Interpretation
RatioMeaning≤ 0.5Strong buyers — accumulation, continuation setups0.5 – 0.8Buyers favored — healthy environment for longs0.8 – 1.2Balanced — equilibrium, wait for direction1.2 – 1.5Sellers favored — caution warranted≥ 1.5Strong sellers — distribution, avoid new longs
Primary Use
Timing entries within confirmed trends. The ratio identifies when selling pressure has exhausted itself, signaling safer entry points. Rather than buying strength, traders wait for the ratio to transition from elevated levels back toward equilibrium—buying when selling stops being dangerous.
What It Does Not Do
This indicator does not predict direction. It measures current pressure dynamics. Pair it with trend analysis (moving averages, price structure) to determine direction, then use the pressure ratio to time entries and exits.

EMA/SMA Full color signal candles💡 What It Does:
The indicator calculates and plots the 21-period Exponential Moving Average (EMA) and the 30-period Simple Moving Average (SMA). It then analyzes the closing price of each candle and colors the entire candlestick (body and border) according to pre-defined trend conditions.
This visualization allows traders to identify strong trend environments versus periods of consolidation or indecision at a glance, removing the need to constantly check the price relationship manually.
🎨 Color Conditions and Meaning:
The indicator uses three distinct color states to signal the market's current momentum:
Color,Condition,Market Interpretation
🟢 GREEN,Closing Price is ABOVE both the 21 EMA AND the 30 SMA.,Strong Bullish Trend: Suggests high momentum and confirmation of an uptrend. Ideal for long bias.
🔴 RED,Closing Price is BELOW both the 21 EMA AND the 30 SMA.,Strong Bearish Trend: Suggests high downward pressure and confirmation of a downtrend. Ideal for short bias.
⚫ GRAY,"Closing Price is in any other state (e.g., between the two MAs, or under one and over the other).","Neutral / Consolidation: Indicates uncertainty, low momentum, or potential trend exhaustion/reversal. Caution is advised."
🔧 Customization Options:The indicator is fully customizable, allowing users to fine-tune the periods to match their preferred trading style (e.g., scalping, swing trading).Dĺžka EMA (Length EMA): Allows you to change the period for the Exponential Moving Average (default is 21).Dĺžka SMA (Length SMA): Allows you to change the period for the Simple Moving Average (default is 30).
I added also Extra 4 EMA lines to have extra edge.