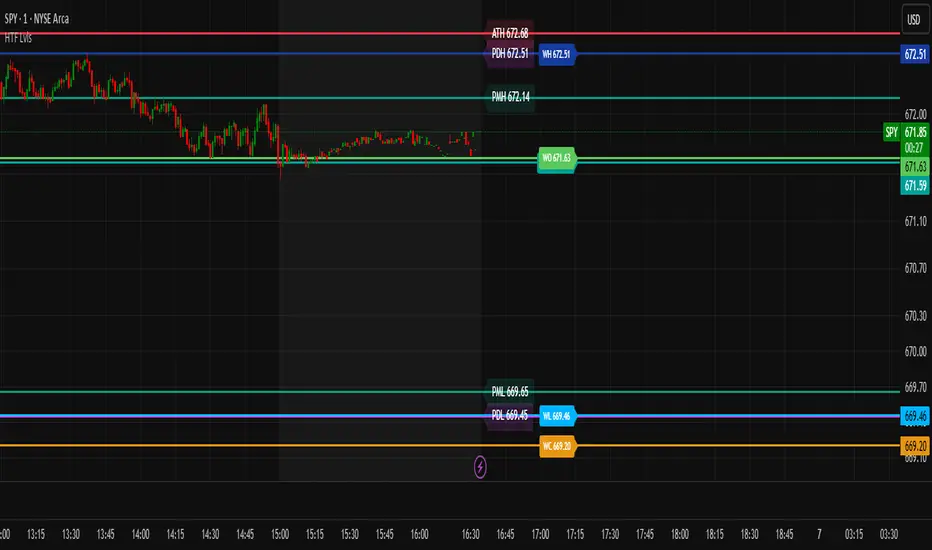
Have fun in one indicator. Many more to come.//////////////////////////////////////////////////////////////////////////////////////////////////////// ////////////////////////////////////////////////////////////////////////
Heikin ashi chart so powerful that you can understand trend direction easily. But sometimes, this type of chart doesn't update properly and make no sense on real time. So I made this script. You can now change candle stick style default to heikin ashi (default / modified version) on the real time default chart without switching heikin ashi chart. Enjoy traders!!!...
This is a visual format of regular RSI on the screen. The indicator give you the RSI level for the high and lows and average as well. So it very easy to use it as you normally do with any RSI buy point are when price reach bellow lower level and start breaking up. sell vice versa it a concept idea to make our regular RSI more effective for the common user I hope...
Price Pivots for NSE Index & F&O Stocks What is this Indicator? • This indicator calculates the price range a Stock or Index can move in a Day, Week or Month. Advantages of this Indicator • This is a Leading indicator, not Dynamic or Repaint. • Helps to identify the tight range of price movement. • Can easily identify the Options strike price. • The levels...
Objective: Can we use both VIX and MOVE relationships to indicate movement in the SPY? VIX (forward contract on SPY options) correlations are quite common as forward indicators however MOVE (forward contract on bonds) also provides a slightly different level of insight Using the Z-Score of VIX vs VVIX and MOVE vs inverted VIX (there is no M of Move so we use...
hello everybody ! ..... this indicator helps you to get a better trading setting. it's similar to the default draw tool from the trading view but the difference is you can add Trail stop and Alert . ..... It also helps to free accounts to set more than 1 Alarm !!! ..... Alert setting just remember after you see set an alert if you change stop or entry,...
Alphamax takes the power of the AlphaTrend indicator behind it, allowing signals to be received earlier without breaking the logic of AlphaTrend. It provides this with a kind of Moving Avera, which is done by a special calculation. Configuration can be provided with the AlphaMax Length entry on the indicator. It is recommended to be used by optimizing especially...
This script lets you add up to 8 EMAs (Exponential Moving Averages) that can be set to any timeframe and length. The difference between this and other EMA indicators is that it has a simple label attached to each EMA showing which timeframe it belongs to and what length it is, so you can get that information at a glance while trading without having to remember the...
What is the Indicator? • The indicator is a visualization of maximum price in which the respective index can go up to in comparison with it's Volatility Index or VIX. Who to use? • Intraday • Swing • Position • Long term Investors • Futures • Options • Portfolio Managers • Mutual Fund Managers • Index Traders • Volatility based Traders • Long term Investors...
The logic of the indicator is simple. We have a large candle for the period N. In its range there are candles with the same extremums in the direction of the trend → Alert. Important: It is not suitable for all coins and not for all TF
I made this indicator to help my friend to see the market direction and finding strike price. Regards. Lal Adidasan
An example and overview of the syminfo and tickerid functions to be able to access different tools. Here is an example of accessing the Bitfinex exchange (and requesting "instrument name") when another exchange is open (BINANCE:BTCUSDT) There is a difference in name between BINANCE:BTCUSDT and BITFINEX:BTCUSD exchanges Try swapping // T =...
This indicator determines the time (in minutes) for which a bar of the Range Bar type was formed. In order to avoid errors in the calculations, a weekend check is immediately carried out (one day if it is a holiday or two days if it is a weekend). If there are more days off, then the information on the first bar after the weekend may be incorrect. Индикатор...
This indicator plots a chart of future timevalue for all NSE index and NSE FNO Stock. It plots the difference of future and spot's 1min candle close price. Just open any index or stock spot chart in 1 min timeframe(works with higher tf also) and add the indicator.
This little scrip is used to automatically draw the most important time periods of the DAX Futures into your chart. You can use the configuration gear to adjust the position of the rectangles based on the current price level.
Hi, I have created Artharjan INDIA VIX v/s Nifty Volatility Dashboard to forecast the Annual, Quarterly, Monthly, Weekly, Daily and Hourly Volatility of NIFTY Benchmark Index based on current value of INDIA VIX. This will help Index Options Sellers to decide the range of Nifty for the given period based on current level of volatility indicated by INDIA...
AUTO SUPPORT AND RESISTANCE FROM OPTIONS STRIKE PRICES WITH PERCENTAGE GAPS This is an auto support and resistance level indicator that uses options strike prices or psychological numbers as the relevant levels. Set your starting level or strike price and input the options strike price gaps for that ticker and 15 lines in either direction will automatically...
Linearly weighted standard deviations over linearly weighted mean. The rationale of the study can be deduced from my latest publications where I go deeper into explaining the benefits of linear weighting, but in short, I can remind that by using linear weighting we are able to increase the information gain by communicating the sequential nature of time series to...