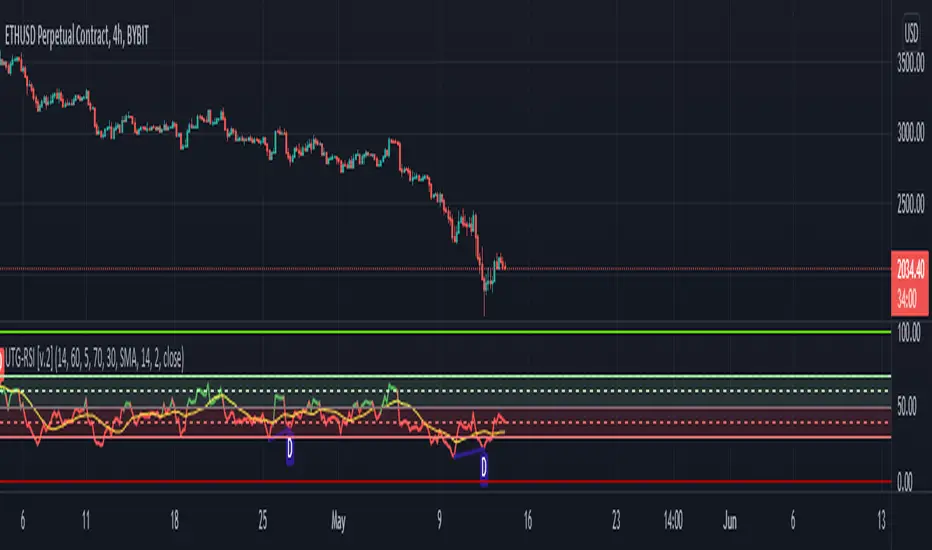
UTG - RSIWe've taken the RSI moving oscillator, given it the classic UTG flair & made it more useful.
We're always talking about how there are a few key levels on the RSI indicator that give us the indication of whether we are bullish or bearish.
- We've added those key levels into the RSI indicator.
- Added the 50 level as our key swing into the bearish or bullish territory.
- The RSI often uses the 50 level, to maintain a level of support or resistance and usually maintains this throughout its market cycle.
- Using the green and the red areas, this tool allows you to swiftly identify which market cycle the chart you're looking at is in.
- We'll be adding more functionality as times goes on!
Enjoy, it's free!
Overbought
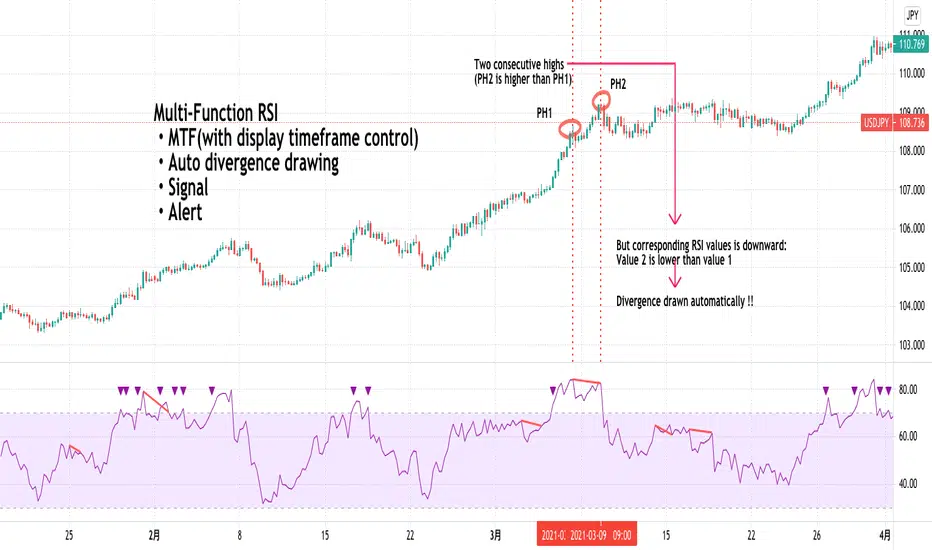
Multi-Function RSI(MTF, divergence, signal and alert)Japanese below / 日本語説明は下記
Overview
Multi-function RSI indicator with functions below.
1.MTF with display timeframe control
2.Auto divergence drawing incl. hidden divergence
3.Signal when RSI crosses over upper band/crosses under lower band
4.Color background when MTF RSI crosses over/under lower band
5.Alert when RSI crosses over upper band/crosses under lower bands
Please see the details below.
Functions:
1.MTF with display timeframe control
You can display daily, 4hour or 1 hour RSI or all of them as upper timeframe MTF RSI.
How is it different from other MTF indicators?
Problems with other MTF RSI indicators are;
-If you set higher timeframe RSI, it will also be shown on further higher timeframes.
i.e. If you set 4hour chart’s RSI on 1 hour or lower time frame charts, it will also appear on daily and weekly chart, which is not necessary.
To tackle these problems, this indicator has incorporated functions below.
-To show MTF RSI on timeframe lower than the upper timeframe you set as MTF timeframe.
For example, if you select daily timeframe for MTF RSI , the RSI will be shown only on 4 hour or lower timeframes(1H, 30M, 15M, 5M, 1M).
Left: 4hour chart, Middle: Daily chart, Right: Weekly chart
If you look at 4hour chart, daily chart’s RSI is shown(pale blue and orange) but weekly chart does not show daily chart’s RSI.
2.Auto divergence drawing incl. hidden divergence
Regular divergence line and hidden divergence line will be automatically drawn for current timeframe RSI as per the logic below.
Bearish : When two consecutive pivot highs go up but RSI values corresponding to each high go down.
Bullish: When two consecutive pivot lows go down but RSI values corresponding to each low go up.
Pivot highs(lows) are identified when those are preceded by n lower highs(lows) and proceeded by n lower highs(lows).
* n is parameterized.
See the diagram below.
Bearish : When two consecutive pivot highs go down but RSI values corresponding to each highs go up.
Bullish : When two consecutive pivot lows go up but RSI values corresponding to each low go down.
3.Signal when RSI crossing upper/lower bands
Signal will be shown when;
-RSI(current timeframe) crosses over upper band
-RSI(current timeframe) crosses under lower band
Example:
Purple triangle is signals.
4.Color background when MTF RSI crosses over/under lower band
Background color can be applied when MTF RSI crosses over upper band/under lower band.
Example:
Pale purple is daily RSI on 4 hour chart. Background color applied while daily RSI is outside upper/lower bands.
5.Alert when RSI crosses over upper band/under lower band
Alert can be set when;
-RSI crosses over upper band
-RSI crosses under lower band
How to use this indicator?
This indicator is paid indicator and invited-only indicator.
Please contact me via private chat or follow links in my signature so that I can grant the access right to the indicator.
Comment section is only for comments on the indicator or updates. Please refrain from contacting me using comments to follow TradingView house rules.
———————————————————————————————————————
多機能RSIインジケーターです。以下の機能が搭載されています。
1.マルチタイムフレーム機能(表示時間足制御機能付き)
2.ダイバージェンス自動描画機能(ヒドゥンダイバージェンス対応)
3.RSIがアッパーバンド、ロワーバンドとクロスした時にシグナル表示
4.上位足RSI(MTF RSI)がアッパーバンドより上にある時、ロワーバンドより下にある時に背景をハイライト
5.RSIがアッパーバンド、ロワーバンドとクロスした時にアラート設定
機能詳細は以下の通りです。
機能詳細
1.マルチタイムフレーム機能(表示時間足制御機能付き)
日足、4時間足、1時間足のいずれか、もしくは全てをRSIをマルチタイムフレームRSIとして表示することができます。(不要な場合は非表示可能)
他のマルチタイムフレームRSIとの違い
他のマルチタイムフレームRSIのインジケーターでは、以下の問題に直面します。
・上位足のRSIを表示すると、さらに上位足でもそのRSIが表示され見にくくなる。
例: 4時間足のRSIを下位足で表示可能な様に設定すると、日足や週足でも表示され、チャートが見にくくなる。
この問題に対して、このインジケーターでは、
・上位足のRSIを表示する時間軸を制御することで上位足で不必要な情報を表示させない。
という機能を加えることでこの問題を解決しています。
具体的には、マルチタイムフレーム用に選択した上位足のタイムフレームより小さいタイムフレームでのみ上位足のRSIが表示されるようになっています。
例えば、上位足として日足を選択した場合、日足のRSIは4時間足、1時間足、30分足、15分足、5分足、1分足にのみ表示されます。
<サンプルチャート>
左から4時間足、日足、週足です。
4時間足では日足のRSI(薄いパープルのライン)が表示されていますが、週足には表示されません。これはオシレーターが表示される時間軸を裏側のロジックで制御しているためです。
2.ダイバージェンス自動描画機能(ヒドゥンダイバージェンス対応)
以下のロジックに基づきダイバージェンスを自動描画します。(不要な場合は非表示可能)
<通常のダイバージェンス>
下降示唆:2つの連続する高値(*)が切り上げられているが、 それぞれの高値に対応するRSIの値は切り下げている場合
上昇示唆:2つの連続する安値(*)が切り下がっているが、 それぞれの安値に対応するRSIの値は切り上がっている場合
*高値(安値)は、左右n本(**)ずつのローソク足の高値(安値)より高い(低い)高値(安値)をピボットハイ・ローとして算出しています。
** nはユーザ設定値です。
<例: ダイバージェンス>
高値PH1はPH1のローソクの高値より左側にn個のより低い高値、右側にn個のより低い高値があった場合に高値として認識されます。
上記の例では高値がPH2>PH1と切り上がっていますが、対応するRSIの値はvalue2
下降継続示唆:2つの連続する高値(*)が切り下がっているが、 それぞれの高値に対応するRSIの値は切り上がっている場合
上昇継続示唆:2つの連続する安値(*)が切り上がっているが、 それぞれの安値に対応するRSIの値は切り下がっている場合
言うまでもないことですが、ダイバージェンスが出たから逆張り、などの安易な発想は避けるべきです。
環境認識の一つの要素として見るべき指標でしょう。
3.RSIがアッパーバンドを上抜いた時、ロワーバンドを下抜いた時にシグナル表示
アッパーバンド(初期値70)とロワーバンド(初期値30)の数値は変更可能です。
サンプルチャート:
4.上位足RSI(MTF RSI)がアッパーバンドより上にある時、ロワーバンドより下にある時に背景をハイライト
サンプルチャート:
日足のRSI(薄いパープルのライン)がアッパーラインより上にある時に背景がグレーがかっています。
このように上位足のRSIの状況を視覚的に認識したい時に役立つでしょう。
日足RSIラインは非表示にすることができますので、背景色だけ表示しておいて、背景に色が付き、かつダイバージェンスも出たら反転を警戒といった状況判断が可能です。
5.RSIがアッパーバンド、ロワーバンドとクロスした時にアラート設定
アラートを設定したいタイムフレームを開いた状態で、アラート設定の画面を開き以下の条件を選択することができます。
・RSIがアッパーバンドを上抜いた時
・RSIがロワーバンドを下抜いた時
インジケーターの使用について
当インジケーターは招待制インジケーター(有料)となっています。
使用を希望される方はプライベートチャットや下記リンクのDMでご連絡ください。
このページのコメント欄はインジケーターそのものに対するコメントやアップデートの記載のためのものとなっております。Tradingviewのハウスルールを守るためにもコメント欄からの連絡はご遠慮ください。
Dziwne MFI Overlay (with highlight)It is simply your traditional MFI , except that your 50 line became the actual price.
Why and how could it be useful? This indicator helps to spot more easily and efficiently divergences .
You could also use it for trend reversals as you usually do with your 50 line, but I would suggest to set a higher length for the MFI, like 155 or something like that.

CCI Overbought & OversoldThe Commodity Channel Index (CCI) is a momentum-based oscillator used to help determine when an investment vehicle is reaching a condition of being overbought or oversold
Developed by Donald Lambert, this technical indicator assesses price trend direction and strength, allowing traders to determine if they want to enter or exit a trade, refrain from taking a trade, or add to an existing position. In this way, the indicator can be used to provide trade signals when it acts in a certain way.
KEY TAKEAWAYS
The Commodity Channel Index (CCI) is a technical indicator that measures the difference between the current price and the historical average price.
When the CCI is above zero, it indicates the price is above the historic average. Conversely, when the CCI is below zero, the price is below the historic average.
The CCI is an unbounded oscillator, meaning it can go higher or lower indefinitely. For this reason, overbought and oversold levels are typically determined for each individual asset by looking at historical extreme CCI levels where the price reversed from
This script calculates Commodity Channel Index (CCI) value and fills background of price action chart with colors:
Green zone indicates oversold zone where you can enter position
Red zone indicates overbought zone where a positions should be closed

RSI PRECISIONRSI PRECISION
By Giorgos Protonotarios, Financial Analyst
(March 2021)
--------
■ SHORT DESCRIPTION
RSI PRECISION is an oscillator designed to enhance RSI with price volatility and make it much more accurate on longer time frames. The oscillator aims to identify overbought/oversold market levels, and it is ideal for analyzing volatile markets such as the cryptocurrency market.
RSI PRECISION is extensively tested and optimized to work properly with any financial-traded asset. However, there is the option to customize settings, in order to match any out-of-the-ordinary market conditions.
■ RSI PRECISION MISSION
To enhance RSI and make it more accurate on longer time frames, and especially during market tops/bottoms.
■ RSI PRECISION OBJECTIVES
The RSI PRECISION formula combines RSI readings with the periodic measurement of market volatility. The main objectives are:
(1) identify overbought/oversold market levels in a simple and user-friendly manner
(2) make precise calculations near market tops and bottoms, where price volatility is always booming
(3) make precise calculations on longer time frames (monthly, weekly) where RSI readings are hardly readable
(4) allowing traders to experiment by offering a plethora of different settings
■ RSI PRECISION CALCULATIONS
The RSI PRECISION consists of 3 components:
(a) Relative Strength Index readings
(b) Price Volatility measurement (on a periodic base and according to the selected time frame)
(c) RSI Volatility measurement (optional)
■ BASIC SETTINGS
There are plenty of parameters. Negative values are allowed in order to enhance user experimentation:
--RSI PERIODS:
The RSI is most typically used on a 14-period timeframe. However, you can perfectly use RSI PRECISION on a 21-period timeframe. By default, it is 14.
--RSI FACTOR (%)
You can adjust the weight of RSI readings in the formula. By default, it is 100%.
--PERIODIC PRICE VOLATILITY (%)
You can adjust the weight of Periodic Price Volatility in the formula. If you enter the value=0, then the formula becomes the classic RSI. By default, it is 100%.
--ADD PERIODIC RSI VOLATILITY (%)
This is an extra measurement of volatility. This time the focus is exclusively on periodic RSI volatility, not on price volatility. By default, it is 0%.
--CROSSOVER/CROSSUNDER LEVELS
You can create visual signals on any significant RSI PRECISION crossover/crossunder.
--BASE LEVEL
The base level is the level of RSI PRECISION equilibrium. Below the level of equilibrium, RSI PRECISION readings are colored in red. By default, it is 50.
Happy trading!
□ Giorgos Protonotarios
(March 2021)

Combo Backtest 123 Overbought/Oversold This is combo strategies for get a cumulative signal.
First strategy
This System was created from the Book "How I Tripled My Money In The
Futures Market" by Ulf Jensen, Page 183. This is reverse type of strategies.
The strategy buys at market, if close price is higher than the previous close
during 2 days and the meaning of 9-days Stochastic Slow Oscillator is lower than 50.
The strategy sells at market, if close price is lower than the previous close price
during 2 days and the meaning of 9-days Stochastic Fast Oscillator is higher than 50.
Second strategy
Simple Overbought/Oversold indicator
WARNING:
- For purpose educate only
- This script to change bars colors.

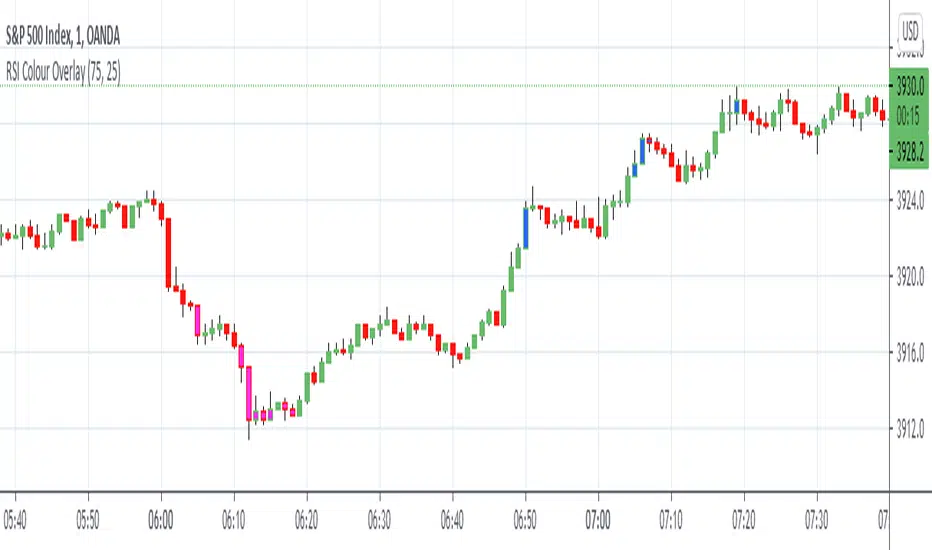
RSI Colour OverlayApplies Blue or Pink colour overlay to candles when RSI is at or over the predefined parameters. These parameters are adjustable in the settings area of the indicator. Please note RSI does not guaranteed a pivot point in price action and the colour overlay should only be used as an indication or condition not a call to buy or sell alone. The colour overlay is a useful prompt to review price action. I hope this helps and good luck with your analysis and trading.
Relative Strength Index with overbought/oversold levelsThis indicator is same as standard RSI, but it marks overbought/oversold levels.

RSI Support & Resistance by DGTRSI Sᴜᴘᴘᴏʀᴛ & Rᴇꜱɪꜱᴛᴀɴᴄᴇ ʙʏ DGT
This experimental study attempts to translate Relative Strength Index (RSI) threshold levels of oversold/overbought and bull/bear zones as probable Price Support and Resistance levels
█ OPTIONS
Support & Resistance Levels , the main aim of the study. Level calculations are based on Relative Strength Index (RSI) threshold levels of oversold/overbought and bull/bear zones, where all threshold values are customizable through the user dialog box. Background of the levels can be colored optionally
RSI Weighted Colored Bars and/or Mark Overbought/Oversold Bars , Bar colors can be painted to better emphasis RSI values. Darker colors when the oscillator is in oversold/overbought zones, light colors when oscillator readings are below/above the bull/bear zone respectively, and remain unchanged otherwise. Besides the colors, with “Display RSI Overbought/Oversold Price Bars” option little triangle shapes can be plotted on top or bottom of the bars when RSI is in oversold/overbought zones
Example usage of the study with explanations
█ OTHERS
More regarding Support & Resistance concept (definition, identifying levels, trading S&R, etc) you are kindly invited to check my previous publication
Price Action - Support & Resistance by DGT
More regarding Relative Strength Index (RSI) and Relative Strength of Volume Indicators , please check Relative Strength of Volume Indicators by DGT
Disclaimer:
Trading success is all about following your trading strategy and the indicators should fit within your trading strategy, and not to be traded upon solely
The script is for informational and educational purposes only. Use of the script does not constitute professional and/or financial advice. You alone have the sole responsibility of evaluating the script output and risks associated with the use of the script. In exchange for using the script, you agree not to hold dgtrd TradingView user liable for any possible claim for damages arising from any decision you make based on use of the script

Scalping using RSI 2 indicator with TSLThis strategy implements a simply scalping using the RSI (calculated on two periods), the slopes of two MAs ( EMA or SMA ) having different lengths (by default, I use 50 and 200).
A trailing stop loss (%) is used.
Entry conditions:
.) Fast MA > Slow MA and Price > Slow MA and RSI < Oversold Threshold ------> go Long
.) Fast MA < Slow MA and Price < Slow MA and RSI > Overbought Threshold ------> go Short
Exit conditions:
.) Long entry condition is true and (close >= TP or close <= TSL ) ----> close short position
.) Short entry condition is true and (close <= TP or close >= TSL ) ----> close long position
The strategy performed best on Bitcoin and the most liquid and capitalized Altcoins but works excellent on volatile assets, mainly if they often go trending.
Works best on 3h - 4h time frame.
There's also an optional Volatility filter, which opens the position only if the difference between the two slopes is more than a specific value, which can be set in the study inputs. The purpose is not opening positions if the price goes sideways and the noise is way > than the signal.
Note:
.) the RSI length is 2;
.) the oversold Threshold is 90%;
.) the overbought Threshold is 10%;
.) by default, the trailing stop loss per cent is 1%;
.) by default, the fast MA length is 50;
.) by default, the slow MA length is 200;
.) by default, the MA used is EMA.
Cheers.

Scalping using RSI 2 indicator with TP and TSLThis study implements a simply scalping using the RSI (calculated on two periods), the slopes of two MAs (EMA or SMA) having different lengths (by default, I use 50 and 200).
A take profit (%) and a trailing stop loss (%) are used.
Entry conditions:
.) Fast MA > Slow MA and Price > Slow MA and RSI < Oversold Threshold ------> go Long
.) Fast MA < Slow MA and Price < Slow MA and RSI > Overbought Threshold ------> go Short
Exit conditions:
.) Long entry condition is true and (close >= TP or close <= TSL) ----> close short position
.) Short entry condition is true and (close <= TP or close >= TSL) ----> close long position
The strategy performed best on Bitcoin and the most liquid and capitalized Altcoins but works excellent on volatile assets, mainly if they often go trending.
Works best on 3h - 4h time frame.
There's also an optional Volatility filter, which opens the position only if the difference between the two slopes is more than a specific value, which can be set in the study inputs. The purpose is not opening positions if the price goes sideways and the noise is way > than the signal.
Note:
.) the RSI length is 2;
.) the oversold Threshold is 90%;
.) the overbought Threshold is 10%;
.) by default, the take profit per cent is 0.5%;
.) by default, the trailing stop loss per cent is 0.5%;
.) by default, the fast MA length is 50;
.) by default, the slow MA length is 200;
.) by default, the MA used is EMA.
Cheers.

RSS - RSI(OB/OS)This indicator draws a visual RSI signal on to your chart. You can use it to set RSI alerts when the market enters an extreme RSI condition.

Multi Band Channel - Oversold/Overbought OscillatorIf your trading strategy is to sell the RIPs and buy the DIPs, this is an indicator for you.
This is based on the multi band indicator present here:
Code is simplified to generate as many bands as possible and hence divide price into as many states as possible based on these bands. Moving Average Type defines what moving average to be considered for Bollinger Band/Keltner Channel. This is based on
Once we derive price state based on multi bollinger band/keltner channel levels, we then look for highest and lowest levels in LoopbackPeriod .
Overbought level = Highest Level - Offset
Oversold level = Lowest Level + Offset
Blue line indicates current state.

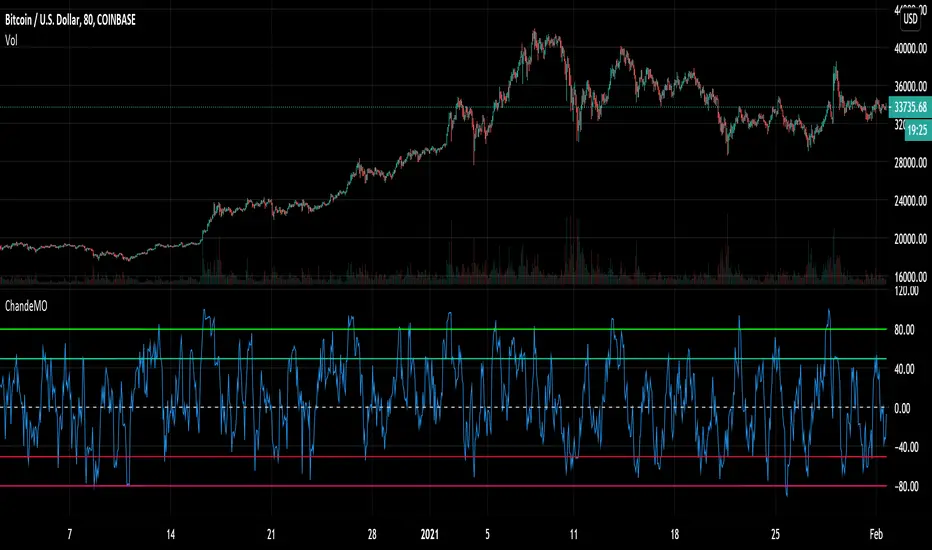
Chande Momentum Oscillator - Alerts and RegionsIt seemed weird to me that the default Chande didn't have overbought and oversold regions, despite them being described for Chande Momentum and working very well. So I added the lines and alert conditions. I've used this to very good results in my day trading.
My strategy involved 4 timeframes of candlestick, each with 4 timeframes of Chande overlaid. Candlesticks are 5 min, 20 min, 80 min, 320 min and Chandes are x1, x2, x4 and x8 of the relevant time zone. Give it a shot. Use the 5 min Chande as Buy and Sell signal with the other timeframes for trend confirmation. You may get a lot of extra alerts with this setup, but it's almost impossible to really miss an opportunity if you use it right. It will take up all your free time though, as a warning. Using this strat made me go crazy.
Use the chande crossing over the lines as the signal, not just being in the region, as that will make you buy early.
Confirmation (Expo)
Confirmation (Expo) is a trading confirmation tool that can confirm any indicator, trend, setup, signal, or strategy. Once you have chosen the input source (any indicator) you can use the tool to confirm the trend, trend strength, overbought/oversold areas, retracements, and reversals. This tool is built for traders that already have a strategy or preferred indicator that they want to confirm. As a default, the indicator oscillates between overbought (or strong positive trend)/oversold (or strong negative trend). However, depending on the settings and input source many different layouts can occur.
Real-Time Alerts
No Repainting
Works on any market and in any timeframe
HOW TO USE
To confirm any indicator, trend, setup, signal, or strategy
INDICATOR IN ACTION
4 hour - chart
I hope you find this indicator useful , and please comment or contact me if you like the script or have any questions/suggestions for future improvements. Thanks!
I will continually work on this indicator, so please share your experience and feedback as it will enable me to make even better improvements. Thanks to everyone that has already contacted me regarding my scripts. Your feedback is valuable for future developments!
-----------------
Disclaimer
Copyright by Zeiierman.
The information contained in my scripts/indicators/strategies/ideas does not constitute financial advice or a solicitation to buy or sell any securities of any type. I will not accept liability for any loss or damage, including without limitation any loss of profit, which may arise directly or indirectly from the use of or reliance on such information.
All investments involve risk, and the past performance of a security, industry, sector, market, financial product, trading strategy, or individual’s trading does not guarantee future results or returns. Investors are fully responsible for any investment decisions they make. Such decisions should be based solely on an evaluation of their financial circumstances, investment objectives, risk tolerance, and liquidity needs.
My scripts/indicators/strategies/ideas are only for educational purposes!
ACCESS THE INDICATOR
• Contact me on TradingView or use the links below

Multi-Timeframe Stoch RSIGood evening folks!
Today I want to share with you a simple variant of the Stochastic-RSI built-in indicator.
Nothing too complex: by enabling the relative checkbox and setting the desired (k, d or the RSI ) source and timeframes, you can see higher timeframes data plotted on your screen.
Everything you need to do is enabling the indicator on the lowest timeframe (in this case 15 minutes), then you will see in YELLOW the information retrieved from the next higher timeframe (in this case 30 minutes) and in RED the information retrieved from the highest timeframe (in this case 45 minutes).
IT'S IMPORTANT THAT YOU DISPLAY THE INDICATOR ON THE LOWEST TIMEFRAME!
You can play with the overbought and oversold heights in order to have the best configuration you want (in oversold conditions is suggested to buy while in overbought conditions is suggested to sell)
The higher timeframes data are retrieved avoiding repainting since the method used for taking them is the 10th method described in this PineCoders Article , so, if you want to enable alerts, you SHOULD ignore the disclaimer message related to it without any problem.
Good Trading!

[JRL] Pivot Regression OscillatorIntroducing the Pivot Regression Oscillator. This oscillator uses a similar formula to the Stochastic Oscillator. However, instead of comparing the closing price to the lowest price of a period, it compares the distance between current price and the current pivot point. By basing our oscillator on pivot levels, we incorporate a much more relevant and consequential price point around which to base our comparisons.
The indicator can give reliable overbought and oversold signals, and it plots two exponential moving averages as output, which provides crossover signals that can be used to help time trades.
The Pivot Regression Oscillator can be effective for timing re-entries into a trend and seems to be able to avoid some of the false signals of other indicators.
Let me know if you find this useful. Cheers!

[blackcat] L1 MACD with Overbought and Oversold DetectionLevel: 1
Background
This MACD is designed with unique oversold and overbought detections, which you may not sell or buy immedidately. You may need to watch the trend movements and decide to buy or sell on current or next goldcross and deadcross respectively.
Function
Add oversold and overbought detections for MACD to locate proper entry point.
Key Signal
diff--> MACD fast line
dea --> MACD slow line
macdhisto --> MACD histogram
overbought --> overbought signal
oversold --> oversold signal
Pros and Cons
It assits you to locate a rough zone for overbought and oversold in classic MACD indicator. Classic MACD indicator does not have this function.
Remarks
Since we cannot look into the future, so it does not inform you on exact entries but alerts of current or next cross may be a good opportunity.
Readme
In real life, I am a prolific inventor. I have successfully applied for more than 60 international and regional patents in the past 12 years. But in the past two years or so, I have tried to transfer my creativity to the development of trading strategies. Tradingview is the ideal platform for me. I am selecting and contributing some of the hundreds of scripts to publish in Tradingview community. Welcome everyone to interact with me to discuss these interesting pine scripts.
The scripts posted are categorized into 5 levels according to my efforts or manhours put into these works.
Level 1 : interesting script snippets or distinctive improvement from classic indicators or strategy. Level 1 scripts can usually appear in more complex indicators as a function module or element.
Level 2 : composite indicator/strategy. By selecting or combining several independent or dependent functions or sub indicators in proper way, the composite script exhibits a resonance phenomenon which can filter out noise or fake trading signal to enhance trading confidence level.
Level 3 : comprehensive indicator/strategy. They are simple trading systems based on my strategies. They are commonly containing several or all of entry signal, close signal, stop loss, take profit, re-entry, risk management, and position sizing techniques. Even some interesting fundamental and mass psychological aspects are incorporated.
Level 4 : script snippets or functions that do not disclose source code. Interesting element that can reveal market laws and work as raw material for indicators and strategies. If you find Level 1~2 scripts are helpful, Level 4 is a private version that took me far more efforts to develop.
Level 5 : indicator/strategy that do not disclose source code. private version of Level 3 script with my accumulated script processing skills or a large number of custom functions. I had a private function library built in past two years. Level 5 scripts use many of them to achieve private trading strategy.

Non-Rescaled RSI█ OVERVIEW
Relative Strength Index is a momentum oscillator developed by J. Wilder. The original version of RSI rescaled the relative strength measurement to range. While the rescaling is useful for readability, This non-rescaled version tells the exact average relative strength of the movement for the past period, and give another way to put the relative strength reading into context of current market condition.
█ Description & How To Use
1. The (+/-) in relative strength value indicates the direction
Example 1: Relative Strength of 2.33 means average gain is 2.33 bigger than average loss for the past period (Equivalent to RSI 70)
Example 2: Relative Strength of -2.33 means average loss is 2.33 bigger than average gain for the past period (Equivalent to RSI 30)
Example 3: Relative Strength of 0 means average gain is equal to average loss for the past period (Equivalent to RSI 50)
Look at comparison below:
2. You can use it exactly how you would use RSI: Overbought/Oversold state, Divergence, Trend identification, Failure Swings etc..
█ Features
- Overbought/Oversold line still maintainable as standard RSI level (70,30) in user input screen. The script will recalculate and plot the ob/os level accordingly
- Value Label to indicate the RSI and RS value
- Custom Gradient Color Scheme
█ Limitation
The Relative Strength absolute value is capped at 20 to avoid ratio value too big(or too small). This is enough to get accurate equivalent of RSI reading between 5-95
█ Disclaimer
Past performance is not an indicator of future results.
My opinions and research are my own and do not constitute financial advice in any way whatsoever.
Nothing published by me constitutes an investment/trading recommendation, nor should any data or Content published by me be relied upon for any investment/trading activities.
I strongly recommends that you perform your own independent research and/or speak with a qualified investment professional before making any financial decisions.

Momentum Strategy for cryptos (V7.B.4)Here's a strategy for low time frames (30min suggested) for BTC, based on momentum Analysis using Stochastic RSI
By default the strategy will use the 50% of the specified capital for each trade; if "Gamble Sizing" is enabled, it will add the specified amount of capital (25% by default, until reaching the 100% limit or lower) for the next trade after having detected a loss in the previous trade; if the next trade is successful, the size for the next trade comes back to 50%
• Trend Filter LONG: If the fast exponential moving average is UNDER the slow exponential moving average, it won't open LONG positions
• Trend Filter SHORT: If the fast exponential moving average is ABOVE the slow exponential moving average, it won't open SHORT positions
• Bars delay: the strategy will wait the specified amount of bars before closing the current position; the counter is triggered as soon as the closing trade condition is verified
BY MAKING USE OF THIS STRATEGY, YOU ACKNOWLEDGE AND AGREE THAT: (1) YOU ARE AWARE OF THE RISKS ASSOCIATED WITH TRANSACTIONS OF DIGITAL CURRENCIES AND THEIR DERIVATIVES; (2) YOU SHALL ASSUME ALL RISKS RELATED TO THE USE OF THIS STRATEGY AND TRANSACTIONS OF DIGITAL CURRENCIES AND THEIR DERIVATIVES; AND (3) I SHALL NOT BE LIABLE FOR ANY SUCH RISKS OR ADVERSE OUTCOMES.

TradeChartist RSI Donchian Channels™TradeChartist RSI Donchian Channels is a helpful RSI based indicator that helps visualize the RSI trend (using 4 plot styles including RSI Candles) by plotting Donchian Channels of user preferred length.
===================================================================================================================
Features of ™TradeChartist RSI Donchian Channels
===========================================
Plots RSI using user preferred plot style (RSI Candles, Line, Histogram and Area).
Plots RSI Donchian Channels of user preferred DC Length (Default - 14, Min - , based on RSI source price (Default - ohlc4), RSI Length (Default - 14) and EMA smoothing of RSI (Default - 5)
Option to highlight Overbought and Oversold zones.
Highlights Bull and Bear RSI Trend of RSI Donchian Channels.
Displays various RSI Zones using Background fill.
Helps visualize Divergences by plotting RSI Highs and Lows.
The indicator's Trend Identifier Connects to ™TradeChartist Plug and Trade or other compatible TV Scripts as Oscillatory Signal to Generate trade entries, Targets etc. This feature is purely for testing purposes and shouldn't be used on its own for trading.
Note: The RSI Donchian Channels trend alone as a standalone indicator cannot be used for trades as non-trending zones and divergence zones will have significant drawdowns on higher time frames. Also, every asset/timeframe shows different but stable dynamic with RSI Donchian Channels in my limited research. Works very well for certain assets on 4hr for Forex pairs. Nevertheless, it is a very good addon to use to confirm RSI Trend especially for RSI based traders.
===================================================================================================================
Example Charts
1. EUR-USD 4hr chart using RSI Source - hl2, RSI Length - 14, Smoothing - 10 and DC Length - 21 connected to Plug and Trade.
2. BTC-USD Daily chart using RSI Source - close, RSI Length - 14, Smoothing - 5 and DC Length - 21 connected to Plug and Trade.
===================================================================================================================
Best Practice: Test with different settings first using Paper Trades before trading with real money
===================================================================================================================

Screener - Mean Reversion Channel█ OVERVIEW
This is Screener script for Mean Reversion Channel Indicator
█ Description & How To Use
The screener works by scanning through up to 40 symbols and list down symbols that are currently within Overbought/Oversold Zone as defined by Mean Reversion Channel indicator.
The Overbought/Oversold Zone are further categorized and sorted by:
Strong : Indicated by "(Strong)" next to the symbol name
Normal : Indicated by the absence of "(Strong)" or "(Weak)" next to the symbol name
Weak : Indicated by "(Weak)" next to the symbol name
Notes: Refer to chart above to see how the Zone are categorized.
Notes: If the screener displays "Nothing Interesting". It simply means none of the screened assets are within the Overbought/Oversold Zone.
█ Features
- Scan up to 40 symbols at a time (By default, no asset is define. Once configured all the symbols you required, remember to save as default to save you from pain of configuring it again in the future)
- Options to scan by zones
- Custom Timeframe
█ Limitation
Due to multiple use of security() function required to call other symbols, expect the screener to be slow at certain times
█ Disclaimer
Past performance is not an indicator of future results.
My opinions and research are my own and do not constitute financial advice in any way whatsoever.
Nothing published by me constitutes an investment recommendation, nor should any data or Content published by me be relied upon for any investment/trading activities.
I strongly recommends that you perform your own independent research and/or speak with a qualified investment professional before making any financial decisions.
Any ideas to further improve this indicator are welcome :)
Credit: QuantNomad for his script idea on custom screener

Everything RSIThis indicator includes:
RSI Candles set to the default 14 length (un check Borders in the Style tab to see the candlesticks better)
I like using the wicks as an early warning for a possible trend change, which is generally in the opposite direction of the wicks.
It's also easier for me to draw trend lines using the RSI Candles vs the rsi plot line.
40 ema of the RSI Candles
2nd RSI set to the 20 length , which plots just inside the wicks of the RSI Candles. This RSI also highlights Oversold and Overbought levels.
I sometimes leave the RSI Candle Borders checked and use the 20 RSI plot with the wicks of the RSI Candles
Signals to look for Short or Long opportunities , which use the 5 sma of the RSI Candles crossing under the overbought and over the
oversold levels. If you'd like to plot the 5 sma, remove the // at the beginning of the code on line 72.
3nd RSI set to the default 14 length which can be set to a different timeframe as the current chart. Default setting is the 1h.
This RSI plots a + at the top of the indicator when it's above the 50 level and an x at the bottom of the indicator when it's below the 50 level.
For me, this is just a visual aid when I'm scalping on lower timeframes.
If the 1h RSI is above the 50 level, I focus on long scalps. If the 1h RSI is below the 50 level, I focus on short scalps.
RSI Cloud which is formed by filling in the area between the 14 ema of both the 7 RSI and 28 RSI.
I used part of @FnM_Capital 's Trend-Sniper script for my RSI Candles. Thank you! You're extremely talented and deserve all of the credit for your work.
I'd also like to thank @SeanNance for answering all of my random coding questions!!!
I've added the indicator to the example twice to show a couple of the ways I view the RSI's.
The top indicator shows the RSI Candle Borders "un checked" and without the 2nd RSI plot.
The bottom indicator shows RSI Candle Borders "checked", using 2nd RSI plot with the RSI Candle Wicks.
