HaP D-RSIHaP D-RSI (HaP Dual RSI) This code shares the dual RSI structure and divergences of hakan çift rsi-most indicator as open source. It is designed for simple, understandable, and effective use.
()
HaP D-RSI is a comprehensive oscillator that powerfully enhances the classic Relative Strength Index (RSI) indicator. By adding a 9-period EMA on top of the standard RSI(14), it smooths the momentum for clearer readability, while dynamic area filling between the short RSI(10) and long RSI(14) visually emphasizes trend strength. Its strongest feature is the automatic detection of regular (normal) and hidden positive/negative divergences, marked with clear labels. This provides opportunities to catch both trend reversals and continuations early.The indicator operates in a separate panel and includes overbought/oversold levels (70/30/50). With multi-timeframe support, you can display RSI values from a higher timeframe on your current chart.Main FeaturesDual RSI Calculation: Short-period RSI(10) and long-period RSI(14) are calculated separately.
EMA Smoothing: A 9-period EMA is applied to RSI(14) to reduce noise and clarify signals.
Dynamic Area Filling: Dynamic colored filling between RSI(10) and RSI(14)-EMA (blue tones for bullish, red tones for bearish momentum).
Fixed-intensity area between RSI(10) and RSI(14) (emphasizes trend strength).
Overbought/Oversold Lines: Dashed lines at 70 (overbought), 30 (oversold), and 50 (midline).
Full Divergence Detection:Positive Divergence (pu): Price makes a lower low while RSI makes a higher low → Potential bullish reversal.
Hidden Positive Divergence (gpu): Trend continuation signal (buying opportunity after pullback).
Negative Divergence (nu): Price makes a higher high while RSI makes a lower high → Potential bearish reversal.
Hidden Negative Divergence (gnu): Bearish trend continuation signal.
Customizable Pivot Settings: Adjust divergence sensitivity with lookback left/right and distance range.
Multi-Timeframe Support: Ability to pull RSI data from a different timeframe.
Usage InstructionsAdd to Chart: When added, it opens a separate RSI panel.
Settings: Change the short RSI (default 10) and long RSI (default 14) periods as needed.
Adjust the EMA period (default 9) to suit your needs.
If the timeframe is left blank, it uses the current chart timeframe; otherwise, select a higher timeframe.
You can toggle divergence types (positive/negative, hidden/regular) on/off.
Increase pivot lookback values for stronger (fewer signals) divergences.
Signal InterpretationBuy Opportunity: When "pu" or "gpu" labels appear (especially around the 30 level).
Sell Opportunity: When "nu" or "gnu" labels appear (especially around the 70 level).
Area filling colors support momentum direction: Blue tones indicate bullish pressure, red tones indicate bearish pressure.
For best results, use in combination with support/resistance levels, volume, or trend filters (e.g., EMA).
Why Use This Indicator?Powerful Divergence Detection: Automatically and accurately captures both regular (reversal) and hidden (continuation) divergences – a feature missing in many standard RSI indicators.
Visual Clarity: Dynamic colored areas and labels ensure you don't miss signals.
Flexibility: Suitable for all markets (stocks, forex, crypto) and timeframes.
Early Warning System: Divergences often signal before price reversals, providing high-probability entries.
Add this indicator to your strategies to elevate your momentum-based trading.
This indicator is free. Feel free to leave comments with your feedback and improvement suggestions. If you like it, don't forget to add it to favorites and share! Happy trading!
Индикаторы и стратегии

Delta Volume Bubble [Quant Z-Score] by tncylyvDelta/Volume Bubble by tncylyv
This indicator is a quantitative order flow tool designed to visualize statistically significant volume and delta anomalies directly on the price chart. By moving away from raw, noisy volume numbers and utilizing Z-Score (Standard Score) statistics, this tool adapts to changing market volatility to highlight areas of heavy institutional interest or exhaustion.
It combines statistical analysis with Price Action concepts (Effort vs. Result) to detect "Absorption"—market conditions where high volume occurs with very little price movement.
1. Core Concepts & Methodology
A. Adaptive Z-Score (The "Quant" Logic)
Raw volume data is often difficult to interpret because volume fluctuates wildly between sessions (e.g., the Asian session typically has lower volume than the New York Open).
Instead of using a fixed volume threshold (e.g., "Alert me if volume > 1000"), this script calculates the Z-Score.
It measures how many Standard Deviations (
σ
) the current volume is from the historical average.
Significance: A Z-Score of +2.0 or higher puts the current candle in the top 5% of statistical occurrences, filtering out noise and highlighting true anomalies.
B. Absorption Detection (Effort vs. Result)
This feature identifies "Trapped Traders."
The Logic: If the Z-Score indicates extremely high volume (High Effort), but the price candle has a very small body (Low Result), it implies that aggressive market orders are being absorbed by passive limit orders.
Visual: These specific anomalies can be highlighted with a unique halo effect, signaling a potential reversal or stop-hunt area.
C. Intra-Bar True VWAP (Smart Placement)
Standard indicators usually plot symbols at the High, Low, or Close of a candle.
This script utilizes request.security_lower_tf to analyze the Lower Timeframe (LTF) structure of the specific bar.
It calculates the exact Volume Weighted Average Price (VWAP) of that single candle.
Benefit: The bubble is drawn exactly where the heaviest volume occurred inside the candle, providing a more accurate level for future Support/Resistance tests.
2. Key Features
Dual Data Modes: Switch seamlessly between Volume Delta (Buying vs. Selling pressure) or standard Total Volume.
Dynamic Sizing: Bubble sizes (Small, Medium, Large) scale automatically based on the intensity of the Z-Score.
Absorption Logic: Automatically flags candles where volume is high but price progression is stalled.
Adaptive Visuals: Colors and opacity can fade dynamically based on the strength of the signal, or remain solid based on user preference.
Alert System: Fully configurable alerts for Z-Score breakouts and Absorption detection.
3. How to Use
This tool is best used to identify Reversals and Breakout Validation.
Trend Exhaustion (Climax):
If price is trending up and a large "Bullish" bubble appears at the highs with a long upper wick or small body (Absorption), it may indicate buying exhaustion and passive selling.
Breakout Confirmation:
If price breaks a key support/resistance level accompanied by a Large Bubble (High Z-Score), it confirms institutional backing for the move.
Support/Resistance Defense:
The "True VWAP" location of the bubble often acts as a re-test level. If price retraces to the center of a previous large bubble, observe for a reaction.
4. Settings Guide
Data Settings
Calculation Source: Choose between Volume Delta (Up/Down tick analysis) or Regular Volume.
Lower TF Granularity: The timeframe used to calculate the specific "True VWAP" location inside the bar (e.g., 1S or 1M).
Statistical Lookback: The number of bars used to calculate the baseline Average and Standard Deviation (Default: 60).
Quant Logic
Calculation Mode:
Adaptive (Z-Score): Triggers based on relative statistical anomalies (Recommended).
Fixed: Triggers based on raw volume numbers.
Z-Score Threshold: The sensitivity level. 2.0 is standard; higher values (e.g., 3.0) will show fewer, more extreme signals.
Absorption Logic
Detect Absorption: Enables the calculation for small-bodied high-volume candles.
Absorption Ratio: Defines how "small" the body must be relative to the average to qualify as absorption (0.1 to 1.0).
Visuals
Theme: Switch between Dark (Mint/Coral) and Light (Royal/Sunset) themes.
Scale Size: If enabled, bubbles grow larger as the Z-Score increases.
Glow Effect: Adds a neon glow for better visibility on dark backgrounds.
________________________________________
Risk Disclaimer:
This indicator is for informational and educational purposes only. Volume and Delta analysis are subjective interpretation methods. Past performance, or statistical anomalies shown by this script, do not guarantee future results. Always manage your risk appropriately.

Pivot Levels [BigBeluga]🔵 OVERVIEW
The Pivot Levels indicator automatically detects and draws key market pivot levels across multiple sensitivity settings. Each pivot level represents a significant local high or low in price structure, acting as potential zones of support and resistance. Traders can visualize short-, medium-, and long-term pivot layers simultaneously, helping to identify where price may react, reverse, or break out.
🔵 CONCEPTS
Different pivot lengths provide multi-length sensitivity on the same timeframe — shorter lengths detect local micro-swings, while longer lengths capture broader swing structure within the current chart.
ATR-based color logic marks active, bullish, or bearish pivot zones dynamically.
Lines can extend to the right or both sides to track reactions over time.
🔵 FEATURES
Detects up to four custom pivot levels simultaneously.
Each pivot level has independent settings for length , style , and extension mode .
Auto-colors each pivot as support (green), resistance (orange), or active zone (blue).
Displays dual-width line layers: a solid base and a transparent overlay for visual depth.
Dynamic price labels show exact pivot levels for clarity.
Fully customizable line styles: dashed (--), solid (-), or dotted (..).
Extends lines to the right for future reaction tracking or both directions for structure alignment.
🔵 HOW TO USE
Enable or disable pivot levels (1–4) to control how many layers of structure you want visible.
Use shorter pivot lengths for intraday turning points and longer ones for macro structure.
Watch for multiple pivot lines clustering in the same region — these often mark strong reversal zones.
Observe color changes: green = support, orange = resistance, blue = active neutral zone.
Combine with price action or volume analysis to confirm reactions near major pivots.
🔵 CONCLUSION
The Pivot Levels indicator provides a clean, multi-layered visualization of market structure.
By tracking pivots of varying lengths, traders can easily identify overlapping support and resistance regions, gauge breakout strength, and align trades with the dominant structural zones visible across multiple time horizons.

Impulsive Trend Detector [dtAlgo]This advanced Pine Script indicator identifies and tracks impulsive price movements based on Break of Structure (BOS) and Change of Character (CHoCH) concepts from Smart Money trading methodology.
The indicator automatically detects pivot highs and lows, then monitors when price breaks these key levels to signal potential impulsive moves. BOS indicates continuation in the current trend direction, while CHoCH signals potential trend reversals. Each detected move is measured from the break point to the next opposing pivot, providing accurate percentage calculations that match TradingView's measuring tool.
Impulsive moves are categorized into four levels based on magnitude (Level 1: 5-10%, Level 2: 10-15%, Level 3: 15-20%, Level 4: 20%+), with color-coded visual labels and connecting lines displayed directly on the chart.
Comprehensive Session Analysis:
Track moves across 11 distinct trading sessions in Eastern Time: Pre-London/NY, London/NY overlap, NY (with Power Hour and End subdivisions), Sydney, Asia, Sake Time, Asia/London overlap, London, Weekend, and No Session periods.
Three Dynamic Tables provide:
Real-time statistics (bullish/bearish, BOS/CHoCH, levels)
Session breakdown with move counts and average percentages
Event log showing last 10 moves with date, day, session, direction, type, level, percentage, duration, and bar count
Perfect for Smart Money traders seeking data-driven insights into market structure behavior across global trading sessions.


Smart Money Concepts with EMA + RSI - DrSafDescription
This indicator combines LuxAlgo’s Smart Money Concepts (SMC) framework with a trend and momentum confluence system.
Core Features:
Swing & internal BOS / CHoCH
Order blocks, fair value gaps, equal highs/lows
Premium & discount zones
Multi-timeframe high/low levels
Added Filters:
EMA 21 / 50 / 200 trend alignment
Optional RSI 50 momentum filter
Clear long/short signals based on:
Swing CHoCH
Higher-timeframe trend alignment
Momentum confirmation
Signal Logic
Long: Bullish CHoCH + EMA bullish structure + RSI confirmation
Short: Bearish CHoCH + EMA bearish structure + RSI confirmation
Designed for non-repainting execution, clean chart structure or systematic trading.
Indicator plots EMA 21, EMA 50, and EMA 200 to define trend structure and dynamic support/resistance.
EMA 200: overall trend bias
EMA 21 and EMA 50: pullback support for high probability trend entries.
EMA 21/50 crosses highlight momentum shifts but are not intended as standalone entry signals.
License
Based on LuxAlgo Smart Money Concepts
CC BY-NC-SA 4.0 (Non-Commercial)

IDAHL | QuantEdgeBIDAHL | QuantEdgeB
🔍 Overview
The IDAHL indicator builds adaptive, volatility-aware threshold bands from two separate ALMA lines—one smoothed from recent highs, the other from recent lows—then uses percentiles of those lines to define a dynamic “high/low” channel. Price crossing above or below that channel triggers clear long/short signals, with on-chart candle coloring, fills, optional labels and even a built-in backtest table.
✨ Key Features
• 📈 Dual ALMA Bands (with DEMA pre-smoothing)
o High ALMA: ALMA applied to DEMA-smoothed highs (high → DEMA(30) → ALMA).
o Low ALMA: ALMA applied to DEMA-smoothed lows (low → DEMA(30) → ALMA).
• 📊 Percentile Thresholds
o Computes a high threshold at the Xth percentile of the High ALMA over a lookback window.
o Computes a low threshold at the Yth percentile of the Low ALMA.
o Shifts each threshold forward by a small period to reduce repainting.
• ⚡ Dynamic Channel Logic
o When price closes above the high percentile line, the “final” threshold flips down to the low percentile line (and vice versa), creating an adaptive channel that only moves when the outer bound is violated.
o Inside the channel, the threshold holds its last value to avoid whipsaw.
• 🎨 Visual & Alerts
o Plots the two percentile lines and fills between them with a color that reflects the current regime (green for long, yellow for neutral, orange for short).
o Colors your candles to match the active signal.
o Optional “Long”/“Short” labels on confirmed flips.
o Alert conditions fire on each long/short crossover.
• 📊 On-Chart Backtest Metrics
o Toggle on a small performance table—complete with win-rate, net P/L, drawdown—from your chosen start date, without any extra code.
⚙️ How It Works
1. Adaptive Smoothing (ALMA)
o Uses ALMA (Arnaud Legoux Moving Average) for smooth, low-lag filtering. In this script, the inputs are additionally pre-smoothed with DEMA(30) to reduce noise before ALMA is applied—improving stability on highs/lows.
2. Percentile Lines
o The High ALMA series feeds a linear-interpolation percentile function to generate the upper bound; the Low ALMA produces the lower bound.
o These lines are offset by a small look-ahead (X bars) to reduce repaint behavior.
3. Channel Logic
o Breakout Flip: When the selected source (default: Close) closes above the upper bound, the active threshold “jumps” to the lower bound—locking in a new channel until price next crosses.
o Breakdown Flip: Conversely, a close below the lower bound flips the threshold to the upper bound.
4. Signal Generation
o Long while the source is above the current “final” threshold.
o Short while below.
o Neutral inside the channel before any flip.
5. Visualization & Alerts
o Dynamic fills between the two percentile lines change hue as the regime flips.
o Candles adopt the regime color.
o Optional pinned “Long”/“Short” labels at flip bars.
o Alerts on every signal crossover of the zero-based regime line.
6. Backtest Table
o From your chosen start date, a mini-table displays cumulative P/L, win rate and drawdown for this strategy—handy for quick in-chart validation.
🎯 Who Should Use It
• Breakout Traders hunting for adaptive channels that auto-recenter on new highs/lows.
• Volatility Traders who want thresholds that expand and contract with market turbulence.
• Trend-Chasers seeking a fresh take on high/low channels with built-in smoothing.
• Systematic Analysts who appreciate on-chart backtesting without leaving TradingView.
⚙️ Default Settings
• ALMA Length: 14
• Percentile Length: 35 bars
• Percentile Lookback Period (offset): 4 bars
• Upper Percentile: 92%
• Lower Percentile: 50%
• Threshold Source: Close
• Visuals: Candle coloring on, labels off by default, “Strategy” palette
• Backtest Table: on by default (toggleable)
• Start Date (Backtest): 09 Oct 2017
📌 Conclusion
IDAHL blends two smooth, low-lag ALMA filters (fed by DEMA-smoothed highs/lows) with percentile-based channel construction for a self-rewiring high/low envelope. It gives you robust breakout/breakdown signals, immediate visual context via colored fills and candles, optional labels, alerts, and even performance stats—everything you need to spot and confirm regime shifts in one compact script.
🔹 Disclaimer : Past performance is not indicative of future results. Always backtest and align settings with your risk tolerance and objectives before live trading.
🔹 Strategic Advice : Always backtest, optimize, and align parameters with your trading objectives and risk tolerance before live trading.

TwinSmooth ATR Bands | QuantEdgeBTwinSmooth ATR Bands | QuantEdgeB
🔍 Overview
TwinSmooth ATR Bands | QuantEdgeB is a dual-smoothing, ATR-adaptive trend filter that blends two complementary smoothing engines into a single baseline, then builds dynamic ATR bands around it to detect decisive breakouts. When price closes above the upper band it triggers a Long regime; when it closes below the lower band it flips to Short—otherwise it stays neutral. The script enhances clarity with regime-colored candles, an active-band fill, and an optional on-chart backtest table.
✨ Key Features
1. 🧠 Twin-Smooth Baseline (Dual Engine Blend)
- Computes two separate smoothed baselines (a slower “smooth” leg + a faster “responsive” leg).
- Blends them into a single midpoint baseline for balanced stability + speed.
- Applies an extra EMA smoothing pass to produce a clean trend_base.
2. 📏 ATR Volatility Bands
- Builds upper/lower bands using ATR × multiplier around the trend_base.
- Bands expand in volatile conditions and contract when markets quiet down—auto-adapting without manual tweaks.
3. ⚡ Clear Breakout Regime Logic
- Long when close > upperBand.
- Short when close < lowerBand.
- Neutral otherwise (no forced signals inside the band zone).
4. 🎨 Visual Clarity
- Plots only the active band (lower band in long regime, upper band in short regime).
- Fills between active band and price for instant regime context.
- Colors candles to match the current state (bullish / bearish / neutral).
- Multiple color palettes + transparency control.
💼 Use Cases
• Trend Confirmation Filter: Use the regime as a higher-confidence trend gate for entries from other indicators.
• Breakout/Breakdown Trigger: Trade closes outside ATR bands to catch momentum expansions.
• Volatility-Aware Stops/Targets: Bands naturally reflect volatility, making them useful as adaptive reference levels.
• Multi-Timeframe Alignment: Confirm higher-timeframe regime before executing on lower timeframes.
🎯 For Who
• Trend Traders who want clean regime shifts without constant whipsaw.
• Breakout Traders who prefer confirmation via ATR expansion rather than raw MA crossovers.
• System Builders needing a simple, robust “state engine” (Long / Short / Neutral) to plug into larger strategies.
• Analysts who want quick on-chart validation with a backtest table.
⚙️ Default Settings
• SMMA Length (Base Smooth Leg): 24
• TEMA Length (Base Responsive Leg): 8
• EMA Extra Smoothing: 14
• ATR Length: 14
• ATR Multiplier: 1.1
• Color Mode: Alpha
• Color Transparency: 30
• Backtest Table: On (toggleable)
• Backtest Start Date: 09 Oct 2017
• Labels: Off by default
📌 Conclusion
TwinSmooth ATR Bands | QuantEdgeB merges a dual-speed smoothing core into a single trend baseline, then wraps it with ATR-based bands to deliver clean, volatility-adjusted breakout signals. With regime coloring, active-band plotting, and optional backtest stats, it’s a compact, readable tool for spotting momentum shifts and trend continuation across any market and timeframe.
🔹 Disclaimer: Past performance is not indicative of future results. Always backtest and align settings with your risk tolerance and objectives before live trading.
🔹 Strategic Advice: Always backtest, optimize, and align parameters with your trading objectives and risk tolerance before live trading.

SD-Range Oscillator | QuantEdgeBSD-Range Oscillator | QuantEdgeB
🔍 Overview
SD-Range Oscillator | QuantEdgeB (SDRO) is a normalized momentum oscillator that compresses a low-lag trend core into a 0–100 style range using standard-deviation (SD) bands. It builds a smooth baseline from a fast triple-smoothed average, wraps it with ±2×SD volatility bounds, then normalizes the core value inside that envelope. Clear Long/Short regimes trigger when the normalized value crosses user-defined thresholds, with optional labels, regime-colored candles, and intuitive filled zones.
✨ Key Features
1.⚡ Low-Lag Core (Triple-Smooth Engine)
- Uses a fast, low-lag triple-smoothed average as the oscillator’s primary signal input.
- Helps keep momentum readings responsive while filtering noise.
2. 📏 SD Volatility Envelope (±2×SD)
- Builds a volatility channel around a smoothed baseline using standard deviation.
- Automatically adapts to changing market turbulence.
3. 🧮 Normalized Range Output
- Converts the core signal into a normalized value by mapping it between the upper/lower SD bounds.
- Makes readings consistent across assets and timeframes.
4. 🎯 Threshold-Based Regimes
- Long when the normalized value exceeds the Long threshold.
- Short when it falls below the Short threshold.
- Includes an additional safety filter to reduce “forced” longs when price is already extended near the upper envelope.
5. 🎨 Visual Clarity & Zones
- Regime-colored oscillator line and candles.
- Filled SD bands around the baseline for quick volatility context.
- Optional highlight fills between the oscillator and thresholds to show active long/short phases.
- Extra OB/OS background zones for quick overextension awareness.
6. 🔔 Signals & Alerts
- Optional “Long/Short” labels on confirmed regime flips.
- Alert conditions fire on long/short regime crossovers.
💼 Use Cases
• Momentum Confirmation: Validate breakouts by requiring SDRO to hold above the Long threshold.
• Mean-Reversion Awareness: Watch for extreme normalized readings near upper/lower bounds.
• Regime Filtering: Use SDRO state (Long/Short/Neutral) to filter trades from other systems.
• Cross-Market Comparison: Normalization makes it easier to compare momentum across different tickers.
🎯 For Who
• Trend traders who want a clean momentum filter with adaptive volatility context.
• System builders needing a simple regime variable (1 / -1 / neutral) to gate entries.
• Discretionary traders who like visual confirmation (fills, candle coloring, threshold zones).
• Multi-asset traders who benefit from normalized, comparable oscillator readings.
⚙️ Default Settings
• TEMA Period: 7
• Base Length (SMMA): 25
• Long Threshold: 55
• Short Threshold: 45
• SD Multiplier: 2× (fixed in code)
• Color Mode: Alpha
• Color Transparency: 60
• Labels: Off by default
📌 Conclusion
SD-Range Oscillator | QuantEdgeB blends a low-lag triple-smoothed core with an adaptive SD envelope to produce a normalized, easy-to-read momentum signal. With clear threshold regimes, volatility-aware context, and strong visuals (fills + candle coloring), SDRO helps separate meaningful momentum shifts from noise across any asset or timeframe.
🔹 Disclaimer: Past performance is not indicative of future results. Always backtest and align settings with your risk tolerance and objectives before live trading.
🔹 Strategic Advice: Always backtest, optimize, and align parameters with your trading objectives and risk tolerance before live trading.

Adaptive ML Trailing Stop [BOSWaves]Adaptive ML Trailing Stop – Regime-Aware Risk Control with KAMA Adaptation and Pattern-Based Intelligence
Overview
Adaptive ML Trailing Stop is a regime-sensitive trailing stop and risk control system that adjusts stop placement dynamically as market behavior shifts, using efficiency-based smoothing and pattern-informed biasing.
Instead of operating with fixed ATR offsets or rigid trailing rules, stop distance, responsiveness, and directional treatment are continuously recalculated using market efficiency, volatility conditions, and historical pattern resemblance.
This creates a live trailing structure that responds immediately to regime change - contracting during orderly directional movement, relaxing during rotational conditions, and applying probabilistic refinement when pattern confidence is present.
Price is therefore assessed relative to adaptive, condition-aware trailing boundaries rather than static stop levels.
Conceptual Framework
Adaptive ML Trailing Stop is founded on the idea that effective risk control depends on regime context rather than price location alone.
Conventional trailing mechanisms apply constant volatility multipliers, which often results in trend suppression or delayed exits. This framework replaces static logic with adaptive behavior shaped by efficiency state and observed historical outcomes.
Three core principles guide the design:
Stop distance should adjust in proportion to market efficiency.
Smoothing behavior must respond to regime changes.
Trailing logic benefits from probabilistic context instead of fixed rules.
This shifts trailing stops from rigid exit tools into adaptive, regime-responsive risk boundaries.
Theoretical Foundation
The indicator combines adaptive averaging techniques, volatility-based distance modeling, and similarity-weighted pattern analysis.
Kaufman’s Adaptive Moving Average (KAMA) is used to quantify directional efficiency, allowing smoothing intensity and stop behavior to scale with trend quality. Average True Range (ATR) defines the volatility reference, while a K-Nearest Neighbors (KNN) process evaluates historical price patterns to introduce directional weighting when appropriate.
Three internal systems operate in tandem:
KAMA Efficiency Engine : Evaluates directional efficiency to distinguish structured trends from range conditions and modulate smoothing and stop behavior.
Adaptive ATR Stop Engine : Expands or contracts ATR-derived stop distance based on efficiency, tightening during strong trends and widening in low-efficiency environments.
KNN Pattern Influence Layer : Applies distance-weighted historical pattern outcomes to subtly influence stop placement on both sides.
This design allows stop behavior to evolve with market context rather than reacting mechanically to price changes.
How It Works
Adaptive ML Trailing Stop evaluates price through a sequence of adaptive processes:
Efficiency-Based Regime Identification : KAMA efficiency determines whether conditions favor trend continuation or rotational movement, influencing stop sensitivity.
Volatility-Responsive Scaling : ATR-based stop distance adjusts automatically as efficiency rises or falls.
Pattern-Weighted Adjustment : KNN compares recent price sequences to historical analogs, applying confidence-based bias to stop positioning.
Adaptive Stop Smoothing : Long and short stop levels are smoothed using KAMA logic to maintain structural stability while remaining responsive.
Directional Trailing Enforcement : Stops advance only in the direction of the prevailing regime, preserving invalidation structure.
Gradient Distance Visualization : Gradient fills reflect the relative distance between price and the active stop.
Controlled Interaction Markers : Diamond markers highlight meaningful stop interactions, filtered through cooldown logic to reduce clustering.
Together, these elements form a continuously adapting trailing stop system rather than a fixed exit mechanism.
Interpretation
Adaptive ML Trailing Stop should be interpreted as a dynamic risk envelope:
Long Stop (Green) : Acts as the downside invalidation level during bullish regimes, tightening as efficiency improves.
Short Stop (Red) : Serves as the upside invalidation level during bearish regimes, adjusting width based on efficiency and volatility.
Trend State Changes : Regime flips occur only after confirmed stop breaches, filtering temporary price spikes.
Gradient Depth : Deeper gradient penetration indicates increased extension from the stop rather than imminent reversal.
Pattern Influence : KNN weighting affects stop behavior only when historical agreement is strong and remains neutral otherwise.
Distance, efficiency, and context outweigh isolated price interactions.
Signal Logic & Visual Cues
Adaptive ML Trailing Stop presents two primary visual signals:
Trend Transition Circles : Display when price crosses the opposing trailing stop, confirming a regime change rather than anticipating one.
Stop Interaction Diamonds : Indicate controlled contact with the active stop, subject to cooldown filtering to avoid excessive signals.
Alert generation is limited to confirmed trend transitions to maintain clarity.
Strategy Integration
Adaptive ML Trailing Stop fits within trend-following and risk-managed trading approaches:
Dynamic Risk Framing : Use adaptive stops as evolving invalidation levels instead of fixed exits.
Directional Alignment : Base execution on confirmed regime state rather than speculative reversals.
Efficiency-Based Tolerance : Allow greater price fluctuation during inefficient movement while enforcing tighter control during clean trends.
Pattern-Guided Refinement : Let KNN influence adjust sensitivity without overriding core structure.
Multi-Timeframe Context : Apply higher-timeframe efficiency states to inform lower-timeframe stop responsiveness.
Technical Implementation Details
Core Engine : KAMA-based efficiency measurement with adaptive smoothing
Volatility Model : ATR-derived stop distance scaled by regime
Machine Learning Layer : Distance-weighted KNN with confidence modulation
Visualization : Directional trailing stops with layered gradient fills
Signal Logic : Regime-based transitions and controlled interaction markers
Performance Profile : Optimized for real-time chart execution
Optimal Application Parameters
Timeframe Guidance:
1 - 5 min : Tight adaptive trailing for short-term momentum control
15 - 60 min : Structured intraday trend supervision
4H - Daily : Higher-timeframe regime monitoring
Suggested Baseline Configuration:
KAMA Length : 20
Fast/Slow Periods : 15 / 50
ATR Period : 21
Base ATR Multiplier : 2.5
Adaptive Strength : 1.0
KNN Neighbors : 7
KNN Influence : 0.2
These suggested parameters should be used as a baseline; their effectiveness depends on the asset volatility, liquidity, and preferred entry frequency, so fine-tuning is expected for optimal performance.
Parameter Calibration Notes
Use the following adjustments to refine behavior without altering the core logic:
Excessive chop or overreaction : Increase KAMA Length, Slow Period, and ATR Period to reinforce regime filtering.
Stops feel overly permissive : Reduce the Base ATR Multiplier to tighten invalidation boundaries.
Frequent false regime shifts : Increase KNN Neighbors to demand stronger historical agreement.
Delayed adaptation : Decrease KAMA Length and Fast Period to improve responsiveness during regime change.
Adjustments should be incremental and evaluated over multiple market cycles rather than isolated sessions.
Performance Characteristics
High Effectiveness:
Markets exhibiting sustained directional efficiency
Instruments with recurring structural behavior
Trend-oriented, risk-managed strategies
Reduced Effectiveness:
Highly erratic or event-driven price action
Illiquid markets with unreliable volatility readings
Integration Guidelines
Confluence : Combine with BOSWaves structure or trend indicators
Discipline : Follow adaptive stop behavior rather than forcing exits
Risk Framing : Treat stops as adaptive boundaries, not forecasts
Regime Awareness : Always interpret stop behavior within efficiency context
Disclaimer
Adaptive ML Trailing Stop is a professional-grade adaptive risk and regime management tool. It does not forecast price movement and does not guarantee profitability. Results depend on market conditions, parameter selection, and disciplined execution. BOSWaves recommends deploying this indicator within a broader analytical framework that incorporates structure, volatility, and contextual risk management.

BulletProof Long Wick Reversal Markers with LinesThis custom Pine Script indicator for TradingView identifies and marks potential reversal points on your chart based on long wick candles at swing highs (tops) and lows (bottoms). It focuses on candles where the wick is significantly longer than the body (e.g., shooting stars or hammers) and where the subsequent price reversal exceeds a minimum percentage move. Markers appear as colored circles (green for tops, red for bottoms), with horizontal lines extending from each marker to the current bar for easy reference as support/resistance levels.Key Features and InterpretationMarkers (Dots): Green circles at tops: Indicate a potential bearish reversal where price was pushed down after a long upper wick candle.
Red circles at bottoms: Indicate a potential bullish reversal where price was pushed up after a long lower wick candle.
These only appear if the wick-to-body ratio meets the threshold (default 2.0) and the reversal move is at least the minimum percentage (default 1%).
Lines: Horizontal lines extend from each marker to the current bar (updating in real-time). Use these as dynamic levels—e.g., a green top line might act as resistance, while a red bottom line could be support. Lines do not extend into the future blank space on the chart.
Time Filtering: By default, only markers from the last 7 days are shown to reduce clutter. Set to 0 to display all historical ones.
Best Used On: 1-hour charts as per your request, but it works on any timeframe. It's ideal for spotting reversals in trending markets or confirming entries/exits with other indicators.

Harmonic Patterns [kingthies]Harmonic Patterns
This indicator scans price swings for classic X-A-B-C-D harmonic patterns and plots the structure plus a PRZ (Potential Reversal Zone) to help you frame areas where reactions are statistically more likely. It supports both bullish and bearish setups and can trigger alerts when a new D pivot confirms a pattern.
What it does
Builds a pivot-based swing map (ZigZag-style) using a configurable Pivot Length .
Evaluates the most recent 5 swing points (X, A, B, C, D) against harmonic ratio rules with a user-defined tolerance .
Detects: Gartley, Bat, Butterfly, Crab, Deep Crab, Cypher, Shark (loose) .
Draws the pattern legs (X-A-B-C-D), labels the detection with ratio readouts, and projects a PRZ using 3 target levels (derived from XA/BC logic per pattern).
Offers two rendering modes:
Best only : picks the closest match (lowest score) to reduce clutter.
Show all : plots every valid match (uses filled PRZ boxes to keep object usage under control).
PRZ (Potential Reversal Zone)
PRZ is built from three target levels and expanded into a zone.
Optional padding uses ATR (ATR multiplier) to widen/narrow the zone for volatility.
Display modes: Off, Box, Lines, Both .
Zones can be extended forward by a configurable number of bars to keep the area visible as price develops.
How to use
Start with Confirm only when D pivot forms enabled (recommended) to reduce false positives while patterns are still forming.
Adjust Pivot Length based on timeframe:
Lower values = more swings, more signals, more noise.
Higher values = cleaner structures, fewer signals.
Use Ratio Tolerance to control strictness:
Lower tolerance = fewer, higher-confidence matches.
Higher tolerance = more matches, potentially lower quality.
Treat harmonics as context , not a standalone entry system:
Look for confluence (HTF levels, structure, volume, momentum/RSI divergence, etc.).
Use your own confirmation and risk plan (invalidations beyond PRZ / beyond D).
Settings overview
Swings (Pivot ZigZag)
Pivot Length: pivot sensitivity.
Use Wicks: uses High/Low; if off, uses Close.
Max Stored Swings: limits stored pivots for performance/object control.
Harmonic Detection
Ratio Tolerance (%): allowed deviation around ideal ratios.
Confirm only when D pivot forms: reduces repaint-like behavior.
When multiple match: Best only vs Show all.
Pattern Filters enable/disable each pattern type.
PRZ
PRZ Display: Off / Box / Lines / Both.
PRZ Padding (ATR multiplier): volatility-adjusted zone padding.
PRZ Extend (bars): how far to project the zone.
Visuals
Draw Legs: draws X-A-B-C-D.
Show Pattern Label: prints pattern name, direction, ratios, and score.
Label Offset: shift label forward if you want more space.
Alerts
“Bullish/Bearish Harmonic (Any)” triggers on any detected pattern.
Per-pattern alerts are included for each supported pattern type.
Notes
This indicator is educational and intended to assist with pattern recognition and confluence mapping.
Harmonic patterns do not guarantee reversals—always manage risk and confirm with your own process.

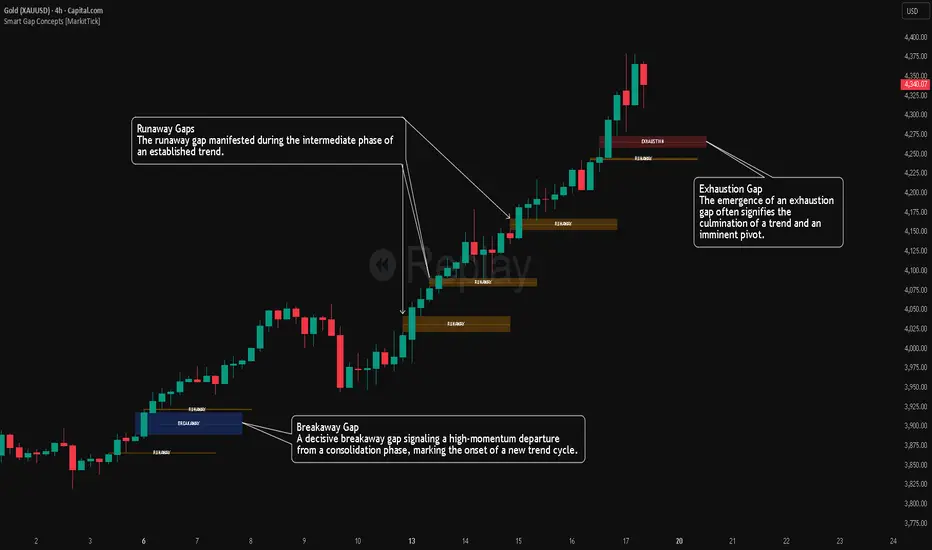
Smart Gap Concepts [MarkitTick]💡 This indicator automates the identification and classification of price gaps, commonly known as Fair Value Gaps (FVG) or Imbalances, by integrating market structure and volume analysis. Unlike standard gap detectors that simply highlight empty space on a chart, this script applies algorithmic filters to categorize gaps into three distinct phases of market movement: Breakaway, Runaway, and Exhaustion. This helps traders understand the potential context of a move rather than just seeing a support or resistance zone.
● Originality and Utility
The primary innovation of this tool is its dynamic classification system. It moves beyond visual detection by checking the "why" behind the gap. By referencing Swing Highs and Swing Lows (Market Structure) alongside Volume efficiency, it determines if a gap represents a breakout, a trend continuation, or a climatic end to a move. Additionally, the script features an automated mitigation tracking system that removes gaps from the chart once price has re-tested the midpoint, ensuring the visual workspace remains clean and relevant to current price action.
● Methodology
The script operates on a multi-stage logic engine:
• Gap Detection
It first identifies the core imbalance where the Low of the current bar does not overlap with the High of the bar two periods prior (for bullish gaps), ensuring the intervening candle represents a strong displacement.
• Structural Analysis (Breakaway Gaps)
The script monitors Pivot Highs and Lows. If a gap occurs simultaneously with a close beyond a key structural Pivot, it is classified as a "Breakaway Gap." This signals the potential start of a new trend.
• Volume and Time Analysis (Exhaustion Gaps)
To identify potential reversals, the script looks for "Trend Maturity." If a gap forms after a long duration since the last pivot and is accompanied by a volume spike (defined by the Volume Spike Multiplier), it is labeled as an "Exhaustion Gap."
• Continuation (Runaway Gaps)
If a gap is valid but meets neither the Breakaway nor Exhaustion criteria, it is considered a "Runaway Gap," typically found in the middle of an established trend.
• Dynamic Cleanup
The script tracks the midpoint of every active gap. If price creates a lower low (for bullish gaps) or higher high (for bearish gaps) beyond this midpoint, the gap is considered mitigated and is removed from the screen.
📖 How to Use
Traders can utilize the color-coded classifications to gauge market intent:
Breakaway (Default Blue): Watch these zones for potential trend initiations. These are often high-probability areas for a retest entry after a structure break.
Runaway (Default Orange): These indicate strong momentum. They can be used to trail stop-losses or add to winning positions, as price should ideally not close below these gaps in a healthy trend.
Exhaustion (Default Red): Be cautious when these appear. They suggest the current move is overextended and a reversal or complex pullback may be imminent.
• Exhaustion Gap : A Practical Case Study
• Breakaway Gap: A Practical Case Study
• Runaway Gap : A Practical Case Study
⚙️ Inputs and Settings
Min Gap Size (Points): Filters out insignificant gaps smaller than this threshold.
Structure Lookback: Defines the sensitivity of the Pivot detection (Swing High/Low).
Volume Avg Length & Multiplier: Determines what qualifies as a "Volume Spike" for exhaustion logic.
Trend Maturity: The minimum number of bars required to consider a trend "old" enough for an exhaustion signal.
Visual Settings: Custom colors for each gap type and box extension length.
● Disclaimer
All provided scripts and indicators are strictly for educational exploration and must not be interpreted as financial advice or a recommendation to execute trades. I expressly disclaim all liability for any financial losses or damages that may result, directly or indirectly, from the reliance on or application of these tools. Market participation carries inherent risk where past performance never guarantees future returns, leaving all investment decisions and due diligence solely at your own discretion.
Market Acceptance Zones [Interakktive]Market Acceptance Zones (MAZ) identifies statistical price acceptance — areas where the market reaches agreement and price rotates rather than trends.
Unlike traditional support/resistance tools, MAZ does not assume where price "should" react. Instead, it highlights regions where multiple internal conditions confirm balance: directional efficiency drops, effort approximately equals result, volatility contracts, and participation remains stable.
This is a market-state diagnostic tool, not a signal generator.
█ WHAT THE ZONES REPRESENT
MAZ (ATF) — Chart Timeframe Acceptance
A MAZ marks an area where price displayed rotational behaviour and the auction temporarily agreed on value. These zones often act as compression regions, fair-price areas, or boundaries of consolidation where impulsive follow-through is less likely.
Use ATF MAZs to:
- Identify rotational environments
- Avoid chasing price inside balance
- Frame consolidation prior to expansion
MAZ • HTF / MAZ • 2/3 — Multi-Timeframe Acceptance (AMTF)
When Multi-Timeframe mode is enabled, MAZ evaluates acceptance on:
- The chart timeframe
- Two higher structural timeframes
If the minimum consensus threshold is met (default: 2 of 3), the zone is classified as AMTF. These zones represent stronger agreement and typically decay more slowly than single-timeframe acceptance.
AMTF zones are structurally stronger and are useful for:
- Higher-quality rotation areas
- Pullback framing within trends
- Context alignment across timeframes
H • MAZ — Historic Acceptance Zones
Historic MAZs represent older acceptance that has transitioned out of active relevance. These zones are hidden by default and can be enabled to provide long-term memory context.
█ AUTO MULTI-TIMEFRAME LOGIC
When MTF Mode is set to Auto, MAZ uses a deterministic structural mapping based on the current chart timeframe:
- 5m → 15m + 1H
- 15m → 1H + 4H
- 1H → 4H + 1D
- 4H → 1D + 1W
- 1D → 1W + 1M
This ensures consistent higher-timeframe context without manual configuration. Advanced users may switch to Manual mode to define custom timeframes.
█ ZONE LIFECYCLE
MAZ zones are dynamic and maintain an internal lifecycle:
- Active — Acceptance remains relevant
- Aging — Acceptance quality is degrading
- Historic — Retained only for memory context
Zones track price interaction and re-acceptance, which can stabilise or strengthen them. Weak or stale zones are automatically removed to keep the chart clean.
█ HOW TRADERS USE MAZ
MAZ is designed to provide structure, not entries.
Common applications include:
- Avoiding chop when price is inside acceptance
- Framing expansion after clean breaks from MAZ
- Identifying higher-quality rotational pullbacks (AMTF zones)
- Defining objective invalidation using zone boundaries
█ SETTINGS OVERVIEW
Market Acceptance Zones — Core
- Acceptance Lookback
- ATR Length
- Zone Frequency (Conservative / Balanced / Aggressive)
Market Acceptance Zones — Zones
- Maximum Zones
- Fade & Stale Bars
- Historic Zone Visibility (default OFF)
Market Acceptance Zones — Timeframes
- MTF Mode (Off / Auto / Manual)
- Manual Higher Timeframes
- Minimum Consensus Requirement
Market Acceptance Zones — Visuals
- Neon / Muted Theme
- Zone Labels & Consensus Detail
- Optional Midline Display
█ DISCLAIMER
This indicator is a market context and diagnostic tool only.
It does not generate trade signals, entries, or exits.
Past acceptance behaviour does not guarantee future price action.
Always combine with independent analysis and proper risk management.

Hurst-Optimized Adaptive Channel [Kodexius]Hurst-Optimized Adaptive Channel (HOAC) is a regime-aware channel indicator that continuously adapts its centerline and volatility bands based on the market’s current behavior. Instead of using a single fixed channel model, HOAC evaluates whether price action is behaving more like a trend-following environment or a mean-reverting environment, then automatically selects the most suitable channel structure.
At the core of the engine is a robust Hurst Exponent estimation using R/S (Rescaled Range) analysis. The Hurst value is smoothed and compared against user-defined thresholds to classify the market regime. In trending regimes, the script emphasizes stability by favoring a slower, smoother channel when it proves more accurate over time. In mean-reversion regimes, it deliberately prioritizes a faster model to react sooner to reversion opportunities, similar in spirit to how traders use Bollinger-style behavior.
The result is a clean, professional adaptive channel with inner and outer bands, dynamic gradient fills, and an optional mean-reversion signal layer. A minimalist dashboard summarizes the detected regime, the current Hurst reading, and which internal model is currently preferred.
🔹 Features
🔸 Robust Regime Detection via Hurst Exponent (R/S Analysis)
HOAC uses a robust Hurst Exponent estimate derived from log returns and Rescaled Range analysis. The Hurst value acts as a behavioral filter:
- H > Trend Start threshold suggests trend persistence and directional continuation.
- H < Mean Reversion threshold suggests anti-persistence and a higher likelihood of reverting toward a central value.
Values between thresholds are treated as Neutral, allowing the channel to remain adaptive without forcing a hard bias.
This regime framework is designed to make the channel selection context-aware rather than purely reactive to recent volatility.
🔸 Dual Channel Engine (Fast vs Slow Models)
Instead of relying on one fixed channel, HOAC computes two independent channel candidates:
Fast model: shorter WMA basis and standard deviation window, intended to respond quickly and fit more reactive environments.
Slow model: longer WMA basis and standard deviation window, intended to reduce noise and better represent sustained directional flow.
Each model produces:
- A midline (basis)
- Outer bands (wider deviation)
- Inner bands (tighter deviation)
This structure gives you a clear core zone and an outer envelope that better represents volatility expansion.
🔸 Rolling Optimization Memory (Model Selection by Error)
HOAC includes an internal optimization layer that continuously measures how well each model fits current price action. On every bar, each model’s absolute deviation from the basis is recorded into a rolling memory window. The script then compares total accumulated error between fast and slow models and prefers the one with lower recent error.
This approach does not attempt curve fitting on multiple parameters. It focuses on a simple, interpretable metric: “Which model has tracked price more accurately over the last X bars?”
Additionally:
If the regime is Mean Reversion, the script explicitly prioritizes the fast model, ensuring responsiveness when reversals matter most.
🔸 Optional Output Smoothing (User-Selectable)
The final selected channel can be smoothed using your choice of:
- SMA
- EMA
- HMA
- RMA
This affects the plotted midline and all band outputs, allowing you to tune visual stability and responsiveness without changing the underlying decision engine.
🔸 Premium Visualization Layer (Inner Core + Outer Fade)
HOAC uses a layered band design:
- Inner bands define the core equilibrium zone around the midline.
- Outer bands define an extended volatility envelope for extremes.
Gradient fills and line styling help separate the core from the extremes while staying visually clean. The midline includes a subtle glow effect for clarity.
🔸 Adaptive Bar Tinting Strength (Regime Intensity)
Bar coloring dynamically adjusts transparency based on how far the Hurst value is from 0.5. When market behavior is more decisively trending or mean-reverting, the tint becomes more pronounced. When behavior is closer to random, the tint becomes more subtle.
🔸 Mean-Reversion Signal Layer
Mean-reversion signals are enabled when the environment is not classified as Trending:
- Buy when price crosses back above the lower outer band
- Sell when price crosses back below the upper outer band
This is intentionally a “return to channel” logic rather than a breakout logic, aligning signals with mean-reversion behavior and avoiding signals in strongly trending regimes by default.
🔸 Minimalist Dashboard (HUD)
A compact table displays:
- Current regime classification
- Smoothed Hurst value
- Which model is currently preferred (Fast or Slow)
- Trend flow direction (based on midline slope)
🔹 Calculations
1) Robust Hurst Exponent (R/S Analysis)
The script estimates Hurst using a Rescaled Range approach on log returns. It builds a returns array, computes mean, cumulative deviation range (R), standard deviation (S), then converts RS into a Hurst exponent.
calc_robust_hurst(int length) =>
float r = math.log(close / close )
float returns = array.new_float(length)
for i = 0 to length - 1
array.set(returns, i, r )
float mean = array.avg(returns)
float cumDev = 0.0
float maxCD = -1.0e10
float minCD = 1.0e10
float sumSqDiff = 0.0
for i = 0 to length - 1
float val = array.get(returns, i)
sumSqDiff += math.pow(val - mean, 2)
cumDev += (val - mean)
if cumDev > maxCD
maxCD := cumDev
if cumDev < minCD
minCD := cumDev
float R = maxCD - minCD
float S = math.sqrt(sumSqDiff / length)
float RS = (S == 0) ? 0.0 : (R / S)
float hurst = (RS > 0) ? (math.log10(RS) / math.log10(length)) : 0.5
hurst
This design avoids simplistic proxies and attempts to reflect persistence (trend tendency) vs anti-persistence (mean reversion tendency) from the underlying return structure.
2) Hurst Smoothing
Raw Hurst values can be noisy, so the script applies EMA smoothing before regime decisions.
float rawHurst = calc_robust_hurst(i_hurstLen)
float hVal = ta.ema(rawHurst, i_smoothHurst)
This stabilized hVal is the value used across regime classification, dynamic visuals, and the HUD display.
3) Regime Classification
The smoothed Hurst reading is compared to user thresholds to label the environment.
string regime = "NEUTRAL"
if hVal > i_trendZone
regime := "TRENDING"
else if hVal < i_chopZone
regime := "MEAN REV"
Higher Hurst implies more persistence, so the indicator treats it as a trend environment.
Lower Hurst implies more mean-reverting behavior, so the indicator enables MR logic and emphasizes faster adaptation.
4) Dual Channel Models (Fast and Slow)
HOAC computes two candidate channel structures in parallel. Each model is a WMA basis with volatility envelopes derived from standard deviation. Inner and outer bands are created using different multipliers.
Fast model (more reactive):
float fastBasis = ta.wma(close, 20)
float fastDev = ta.stdev(close, 20)
ChannelObj fastM = ChannelObj.new(fastBasis, fastBasis + fastDev * 2.0, fastBasis - fastDev * 2.0, fastBasis + fastDev * 1.0, fastBasis - fastDev * 1.0, math.abs(close - fastBasis))
Slow model (more stable):
float slowBasis = ta.wma(close, 50)
float slowDev = ta.stdev(close, 50)
ChannelObj slowM = ChannelObj.new(slowBasis, slowBasis + slowDev * 2.5, slowBasis - slowDev * 2.5, slowBasis + slowDev * 1.25, slowBasis - slowDev * 1.25, math.abs(close - slowBasis))
Both models store their structure in a ChannelObj type, including the instantaneous tracking error (abs(close - basis)).
5) Rolling Error Memory and Model Preference
To decide which model fits current conditions better, the script stores recent errors into rolling arrays and compares cumulative error totals.
var float errFast = array.new_float()
var float errSlow = array.new_float()
update_error(float errArr, float error, int maxLen) =>
errArr.unshift(error)
if errArr.size() > maxLen
errArr.pop()
Each bar updates both error histories and computes which model has lower recent accumulated error.
update_error(errFast, fastM.error, i_optLookback)
update_error(errSlow, slowM.error, i_optLookback)
bool preferFast = errFast.sum() < errSlow.sum()
This is an interpretable optimization approach: it does not attempt to brute-force parameters, it simply prefers the model that has tracked price more closely over the last i_optLookback bars.
6) Winner Selection Logic (Regime-Aware Hybrid)
The final model selection uses both regime and rolling error performance.
ChannelObj winner = regime == "MEAN REV" ? fastM : (preferFast ? fastM : slowM)
rawMid := winner.mid
rawUp := winner.upper
rawDn := winner.lower
rawUpInner := winner.upper_inner
rawDnInner := winner.lower_inner
In Mean Reversion, the script forces the fast model to ensure responsiveness.
Otherwise, it selects the lowest-error model between fast and slow.
7) Optional Output Smoothing
After the winner is selected, the script optionally smooths the final channel outputs using the chosen moving average type.
smooth(float src, string type, int len) =>
switch type
"SMA" => ta.sma(src, len)
"EMA" => ta.ema(src, len)
"HMA" => ta.hma(src, len)
"RMA" => ta.rma(src, len)
=> src
float finalMid = i_enableSmooth ? smooth(rawMid, i_smoothType, i_smoothLen) : rawMid
float finalUp = i_enableSmooth ? smooth(rawUp, i_smoothType, i_smoothLen) : rawUp
float finalDn = i_enableSmooth ? smooth(rawDn, i_smoothType, i_smoothLen) : rawDn
float finalUpInner = i_enableSmooth ? smooth(rawUpInner, i_smoothType, i_smoothLen) : rawUpInner
float finalDnInner = i_enableSmooth ? smooth(rawDnInner, i_smoothType, i_smoothLen) : rawDnInner
This preserves decision integrity since smoothing happens after model selection, not before.
8) Dynamic Visual Intensity From Hurst
Transparency is derived from the distance of hVal to 0.5, so stronger behavioral regimes appear with clearer tints.
int dynTrans = int(math.max(20, math.min(80, 100 - (math.abs(hVal - 0.5) * 200))))

MACD-v Bullish/Bearish DivergenceMACD-v Bullish/Bearish Divergence
Overview This indicator is a specialized divergence detector based on the MACD-v (Volatility Normalized Momentum) concept. Unlike standard MACD which uses absolute price differences, MACD-v normalizes values against volatility (ATR), allowing for fixed, universal Overbought/Oversold thresholds across all assets and timeframes.
Recommendation: This script is highly effective when paired with the original MACD-v by Alex Spiroglou. While this indicator focuses on identifying and visualizing divergence entries, using the original oscillator alongside it provides the best visual context for the overall momentum structure.
How It Works
This tool uses a dual-signal mechanism (Raw Line + Signal Smooth) to identify specific divergence setups:
Setup (Yellow/Blue Dots): Identifies when price momentum has extended significantly into extreme zones (Overbought/Oversold).
Trigger (Red/Green Dots): Fires when price fails to make a new momentum extreme despite price action (classic divergence/failure swing).
Active State (Background Color): Once a trigger fires, the background highlights (Red for Bearish, Green for Bullish) to indicate an active divergence play.
Reset (Exit): The signal state clears when momentum returns to the neutral "safe zone."
Important Note: Momentum Washout
The colored background persists as long as the divergence trade remains valid. Traders should note the concept of "Momentum Washout":
Signal End: The background color turns off when the MACD returns to the neutral range, indicating the primary high-velocity impulse is over.
Performance Continuation: Significant positive or negative price performance can often continue even after the background signal ends. This period allows the remaining momentum to "wash out" or drift before the next major impulse.
Strategy Tip: The indicator is designed to capture the high-volatility portion of the reversal. Do not assume the end of the signal is the absolute top or bottom of the trend; it simply marks the normalization of momentum.
Strategy Recommendation: Multi-Timeframe Analysis
Divergence signals are most powerful when confirmed across timeframes. It is highly recommended to look for alignment before taking a trade:
Trend Confirmation: If you see a signal on a lower timeframe (e.g., 5m or 15m), check a higher timeframe (e.g., 1H or 4H). A bullish divergence on the 5m is significantly more reliable if the 1H momentum is already bullish or oversold.
Signal Stacking: Valid signals often appear sequentially—first on the 1m, then the 5m, and finally the 15m. Waiting for this "cascade" can filter out false reversals.
Visual Guide
🔵 Blue Dot: Bullish Divergence Setup (Watch for entry).
🟢 Green Dot: Bullish Divergence Trigger (Long Entry).
🟡 Yellow Dot: Bearish Divergence Setup (Watch for entry).
🔴 Red Dot: Bearish Divergence Trigger (Short Entry).
Background Color: Indicates an active trade (Red = Bearish / Green = Bullish).
Settings
Auto-Detect: Automatically switches between Scalping settings (tighter thresholds) for low timeframes and Swing settings for high timeframes.
Strict Invalidation: If enabled, cancels a setup if momentum pushes too far in the opposite direction before triggering.
Active Signal Multiplier: Dynamically smooths the signal line only when a trade is active to prevent premature exits during choppy corrections.
Disclaimer: This tool is for educational purposes and trend analysis only. Always manage your risk appropriately.

Strat Structure Engine + Trapped TradersStrat Structure Engine + Trapped Traders – Detailed Description
This script identifies high-probability market structure patterns known as “The Strat” setups, specifically focusing on 3-bar → Failed 2, 2-bar → Failed 2, and Failed 2 → Failed 2 (“Dragon’s Tail”) sequences. It is designed to help traders visualize potential reversals, trapped traders, and exhaustion points directly on the chart, combining price action, volatility, and volume metrics to grade signal strength.
Key Features:
3-Bar → Failed 2 (Tiered Scoring):
Detects a 3-bar structure followed immediately by a strict Failed 2 bar.
Evaluates the setup using four criteria:
3-bar range relative to ATR
Failed 2 close position relative to the 3-bar midpoint
Failed 2 body-to-range ratio
Volume relative to recent average
Assigns a tier (A+, A, B, or —) to indicate reliability, giving traders a graded view of signal strength.
2-Bar → Failed 2 (A+ Only):
Identifies strict 2-bar structures immediately followed by a Failed 2 bar.
Uses a similar evaluation system as 3→F2 but filters only for the strongest A+ setups.
Highlights signals where price shows strong directional rejection and high probability for reversal.
Dragon’s Tail – Failed 2 → Failed 2:
Captures consecutive Failed 2 bars in opposite directions, a classic trapped-trader scenario.
Signals both bullish and bearish sequences on bar close, helping traders spot potential quick reversals.
How It Works:
Uses ATR to contextualize bar ranges and volatility.
Incorporates volume averaging to detect unusually high trading activity that validates the strength of a Failed 2 setup.
Strict bar evaluation ensures only fully-formed, confirmed patterns are labeled, reducing noise and false signals.
Optional labels and alerts allow traders to track these structures in real-time or on bar close.
Practical Trading Use:
Ideal for spotting short-term exhaustion points, trapped traders, and reversal zones.
Can be used alongside liquidity zones, VWAP, and fair value gaps to refine entries and exits.
Traders can focus on high-tier signals (A+ / A) for higher probability trades, while lower-tier signals (B) indicate caution or context setups.
Customization Options:
Toggle visibility for each pattern type (3→F2, 2→F2, F2→F2).
Adjust ATR length and volume average period for different instruments or timeframes.
Alerts are available for all major setups, enabling integration with automated monitoring or manual execution strategies.
Summary:
The Strat Structure Engine + Trapped Traders script combines price action structure, volatility, and volume analysis to visualize high-probability reversal setups. By highlighting both strict pattern confirmations and tiered reliability, it provides traders with actionable insight into potential turning points, trapped trader scenarios, and high-conviction market moves without relying on external scripts or assumptions.

Trend Stress Quant [MarkitTick]💡This indicator combines a liquidity-based stress model with a dynamic linear regression channel to identify potential market exhaustion points and assess trend quality. By merging volume impact analysis with statistical deviation, this tool aims to highlight moments where price action may be overextended relative to the underlying liquidity conditions.
● Originality and Utility
Standard volatility indicators often rely solely on price range (like Bollinger Bands). This script introduces a Stress Engine that normalizes the relationship between Price Range (True Range) and Volume. This helps distinguish between healthy price movements and liquidity-stress events (illiquidity). Furthermore, instead of using a fixed-length channel, this tool offers a Dynamic Mode that anchors the regression channel to recent pivot points, ensuring the statistical analysis aligns with the current market structure rather than an arbitrary timeframe.
● Methodology
The script operates on two distinct mathematical models:
• Illiquidity Stress Engine
The core formula calculates a raw illiquidity metric based on the log-normal distribution of the ratio between True Range and Volume. A Z-Score (standard score) is then derived from this data over a specific lookback period. High Z-Scores indicate that price is moving disproportionately fast relative to the available volume, often a signature of panic selling or euphoric buying (exhaustion).
• Linear Regression Channel
The script calculates an Ordinary Least Squares (OLS) regression line (the line of best fit) to determine the mean price trend.
Standard Deviation Bands are plotted parallel to this mean.
Pearson Correlation Coefficient (R) is calculated to quantify the strength of the linear trend. Values closer to 1 or -1 indicate a strong trend, while values near 0 indicate a chaotic or ranging market.
📑 How to Use
Traders can utilize the visual outputs for mean reversion or trend continuation context:
• Exhaustion Signals (SE / BE Labels)
SE (Seller Exhaustion): Appears when the market is in a downtrend, but the Stress Engine detects a statistical anomaly (High Z-Score) on a down candle. This suggests panic selling may be peaking.
BE (Buyer Exhaustion): Appears when the market is in an uptrend, but the Stress Engine detects high stress on an up candle, suggesting a potential blow-off top.
• Regression Channel
The dashed middle line represents the fair value (mean) of the current trend.
The outer bands represent statistical extremes. Price interacting with the outer bands (default 2 Standard Deviations) while coincident with an Exhaustion Signal provides a high-confluence area of interest.
• Metrics Dashboard
A dashboard displays the current Trend Regime, Exhaustion Status, and Channel Width (volatility percentage).
● Settings
• Exhaustion Model
Trend Filter Length: Sets the baseline EMA to determine if the market is bullish or bearish.
Stress Threshold (Sigma): The Z-Score required to trigger an exhaustion signal (default is 2.0).
• Channel Configuration
Dynamic Pivot Mode: If enabled, automatically calculates the channel length based on recent pivots. If disabled, uses the Fixed Length.
Standard Deviations: Controls the width of the inner and outer channel bands.
📖This guide explains how to interpret and utilize signals for trading:
The script is designed primarily for Mean Reversion and Exhaustion trading strategies.
● The Core Strategy: Volatility Exhaustion
The script uses a "Stress Engine" to identify when price movement is statistically overextended relative to the available liquidity (Volume).
• Setup A: The "Seller Exhaustion" (Bullish Bounce)
Look for this setup during a downtrend to catch a temporary bottom or a reversal.
Trend Condition: The dashboard shows Bearish (Price is below the trend filter).
Trigger: The label SE (Seller Exhaustion) appears below a candle.
Why? This indicates that selling pressure was intense but likely panic-driven (High Z-Score/Stress) and may be drying up.
Confluence: Ideally, this signal appears when the price is touching or piercing the Lower Channel Band (dotted or solid lines).
Action: Traders often use this as a signal to close Short positions or enter a speculative Long (counter-trend) targeting the middle line.
• Setup B: The "Buyer Exhaustion" (Bearish Pullback)
Look for this setup during an uptrend to catch a local top.
Trend Condition: The dashboard shows Bullish .
Trigger: The label BE (Buyer Exhaustion) appears above a candle.
Why? This indicates euphoric buying on low liquidity or extreme volatility that is statistically unsustainable.
Confluence: Look for price rejection at the Upper Channel Band.
Action: Traders often use this to close Long positions or enter a Short targeting the mean.
● The Filter: Trend & Correlation
The script includes a Linear Regression Channel that quantifies the quality of the trend.
• Channel Slope
If the channel is angling steeply up or down, the trend is strong.
• Pearson R (Correlation)
The script calculates the Pearson R coefficient.
Weak Correlation: If the channel turns Gray/Neutral (or the fill becomes weak), it means the correlation is below the threshold (default 0.5).
Trading Rule: Avoid trading exhaustion signals when the channel is Gray/Neutral, as the market is likely chopping sideways with no clear direction.
● Risk Management & Targets
• Stop Loss
Since this is a volatility tool, a common technique is to place stops just outside the Outer Deviation Band (the widest line). If price expands beyond the outer band with no exhaustion signal, the trend may be entering a "runaway" phase.
• Take Profit
Target 1: The Middle Regression Line (The dashed center line). Prices tend to revert to this mean after an exhaustion event.
Target 2: The opposite channel band (e.g., if you bought at the bottom, hold until the top).
● Summary of Dashboard Metrics
The table on your chart provides a quick snapshot:
Trend Regime: Tells you if you should fundamentally look for Shorts (Bearish) or Longs (Bullish).
Seller/Buyer Status: Alerts you if the current bar is EXHAUSTED or Normal .
Channel Width %: Indicates volatility. If the width is very low (percentage is small), a breakout might be imminent (squeezing). If high, be careful of chop.
⚙️ Indicator settings
• Signal Parameters
Exhaustion & Stress Model: Controls signal sensitivity.
Trend Filter: Decides if the market is Bullish or Bearish.
Stress Threshold (Sigma): Higher values (e.g., 2.5) make the script stricter, showing fewer but potentially stronger signals.
• Channel Configuration
Dynamic Pivot Mode: If ON, the channel length auto-adjusts to recent market pivots. If OFF, it uses the Fixed Length you set.
Channel Bands: Adjusts the channel width.
Outer Deviation: The boundary for "extreme" moves. Price hitting this often signals a reversal.
• Quality Filter
Filter Weak Correlations: If enabled, the channel turns gray during choppy/sideways markets to warn you not to trust trend signals.
• Visuals
Display Options: Toggles the "Stats" dashboard and adjusts volatility coloring.
● Disclaimer
All provided scripts and indicators are strictly for educational exploration and must not be interpreted as financial advice or a recommendation to execute trades. I expressly disclaim all liability for any financial losses or damages that may result, directly or indirectly, from the reliance on or application of these tools. Market participation carries inherent risk where past performance never guarantees future returns, leaving all investment decisions and due diligence solely at your own discretion.

ICT SMT Divergence (Synced)ICT SMT Divergence Indicator (Synced)
This Pine Script indicator for TradingView is designed to identify Smart Money Tool (SMT) Divergences, a core concept within the Inner Circle Trader (ICT) methodology. SMT divergences highlight discrepancies in price action between two highly correlated assets, often signaling potential market reversals by revealing the footprint of institutional (smart money) activity.
Unlike traditional indicator divergences, SMT focuses on the price action (Highs and Lows) of two related instruments. This "Synced" version significantly improves accuracy by accounting for minor timing differences in pivot formations between the correlated assets.
How it Works:
The indicator operates by focusing on the price structure of your main chart's asset and comparing it to the price extremes of a user-defined correlated asset within a specific time window.
Main Chart Pivot Detection:
The script first identifies a significant Pivot High or Pivot Low on your current chart's asset (high and low series) using standard lookback periods (defined by Pivot Left and Pivot Right bars).
Comparison Symbol Price Retrieval (Synchronized):
Once a pivot is confirmed on the main chart, the indicator does not wait for a pivot on the comparison symbol. Instead, it actively searches for the extreme price (highest high for a pivot high, lowest low for a pivot low) of the Comparison Symbol within a defined Time Sync Error range (e.g., ±3 bars) around the main chart's pivot. This ensures that even if the correlated asset's peak or trough occurs a few bars earlier or later, it will still be considered for the SMT analysis.
Structural Comparison:
It then compares the price structure (Higher High, Lower High, Higher Low, Lower Low) of the main chart's current pivot against its previous pivot, and similarly for the comparison symbol's relevant extreme prices. An SMT divergence is identified when these structural moves contradict each other.
Types of SMT Divergence Detected:
The indicator identifies two primary types of SMT Divergence:
Bullish SMT (Bottom Divergence):
Indication: Suggests a potential market bottom and reversal upwards.
Scenario 1 (Classic): Your Main Chart asset makes a Lower Low (LL), while the Comparison Symbol makes a Higher Low (HL) within the Time Sync Error range. (The main chart sweeps liquidity, but the comparison symbol shows underlying strength by refusing to make a new low).
Scenario 2 (Inverse): Your Main Chart asset makes a Higher Low (HL), while the Comparison Symbol makes a Lower Low (LL) within the Time Sync Error range. (The comparison symbol sweeps liquidity, but the main chart shows underlying strength by refusing to make a new low).
Visualization: Marked with teal/bullish lines and labels.
Bearish SMT (Top Divergence):
Indication: Suggests a potential market top and reversal downwards.
Scenario 1 (Classic): Your Main Chart asset makes a Higher High (HH), while the Comparison Symbol makes a Lower High (LH) within the Time Sync Error range. (The main chart sweeps liquidity, but the comparison symbol shows underlying weakness by failing to make a new high).
Scenario 2 (Inverse): Your Main Chart asset makes a Lower High (LH), while the Comparison Symbol makes a Higher High (HH) within the Time Sync Error range. (The comparison symbol sweeps liquidity, but the main chart shows underlying weakness by failing to make a new high).
Visualization: Marked with red/bearish lines and labels.
Input Settings:
Comparison Symbol: Enter the ticker of the correlated asset you wish to compare with your current chart.
Examples: If your chart is CME_MINI:NQ1! (Nasdaq E-mini Futures), you might use CME_MINI:ES1! (S&P 500 E-mini Futures) or CME_MINI:YM1! (Dow Jones E-mini Futures).
If your chart is FX_IDC:EURUSD, you might use FX_IDC:GBPUSD (positively correlated) or TVC:DXY (US Dollar Index) (negatively correlated – understanding inverse logic is key here).
Pivot Lookback Left / Right: Defines the number of bars to the left and right that the ta.pivothigh and ta.pivotlow functions will look to determine a pivot on the main chart.
Higher values (e.g., 20) will result in fewer, but potentially more significant, SMT signals.
Lower values (e.g., 5) will result in more frequent, but potentially less reliable, signals.
Time Sync Error (Bars): This crucial parameter allows for slight timing differences between the peaks/troughs of the two assets. It defines how many bars before and after the main chart's pivot point the indicator will search for the extreme price in the comparison symbol.
A value of 3 means it will search within a window of pivot_bar_index ± 3 bars.
Adjust this based on the volatility and correlation strength of the assets you are trading.
Visuals:
Show Bullish SMT / Show Bearish SMT: Toggle visibility of each type of divergence.
Bullish Color / Bearish Color: Customize the line and label colors.
Line Width: Adjust the thickness of the divergence lines.
Usage Tips:
Confluence Tool: SMT Divergence is best used as a confluence factor or confirmation signal, not as a standalone entry signal.
Context is Key: Always combine SMT with your higher timeframe bias, liquidity concepts (e.g., liquidity sweeps), Fair Value Gaps (FVG), Order Blocks (OB), and Market Structure Shifts (MSS).
Timeframes: While applicable on any timeframe, SMT often provides clearer and more reliable signals on higher intraday timeframes (e.g., 15-minute, 1-hour) or daily charts, as lower timeframes can be noisy.
Correlations: Be mindful of the correlation (positive or negative) between your chosen assets.
Positively correlated: NQ vs. ES.
Negatively correlated: EURUSD vs. DXY (A Bullish SMT on EURUSD might mean DXY made a HH while EURUSD made a HL, indicating DXY's strength is fading).

PyraTime FVG [Pro] | Smart Anchored Price ActionPyraTime FVG is a professional-grade institutional trading suite designed to declutter price action analysis. Unlike standard indicators that flood the chart with infinite zones, this tool uses a proprietary "Velcro" Anchoring Engine that physically snaps Fair Value Gaps (FVGs) and Order Blocks to the exact candle geometry.
This tool replaces 4 separate indicators (FVG, Market Structure, Order Blocks, and Trend Dashboard) with a single, performance-optimized Pine Script v6 script.
🎯 Key Features
1. The "Velcro" FVG Engine Most FVG indicators draw boxes that extend infinitely, making charts messy.
Smart Extension: Zones extend to the right but automatically "snap" and cut off the moment price mitigates (fills) them.
Precision Anchoring: Boxes are drawn from the exact wick/body limits of the originating candles—no floating pixels.
Mitigation Tracking: Mitigated zones are instantly dimmed and archived, keeping your chart clean for current price action.
2. Intelligent Structure Mapping (BOS & CHoCH) The script distinguishes between trend continuation and trend reversals:
BOS (Break of Structure): Marked with Dotted Lines. Signals that the current trend is healthy and continuing.
CHoCH (Change of Character): Marked with Solid Lines. Signals a potential major trend reversal (e.g., the first Lower Low after an uptrend).
3. Multi-Timeframe (MTF) Scanner A non-intrusive dashboard in the bottom-right corner scans the 1H, 4H, and Daily timeframes in real-time.
IN BULL GAP: Price is currently inside a Higher Timeframe Buying Zone.
IN BEAR GAP: Price is currently inside a Higher Timeframe Selling Zone.
CLEAR: No major HTF obstacles nearby.
📚 How to Trade With This Tool (Tutorial)
Step 1: Check the "Big Picture" Look at the MTF Scanner (Bottom Right).
If the 1H and 4H say "IN BEAR GAP" (Gold), you know the higher timeframe bias is Down. You should prioritize selling opportunities.
Step 2: Wait for Price to Visit a Zone On your current chart (e.g., 5m or 15m), wait for price to enter a Gold FVG (Resistance).
Note: The box will be bright gold. Once price touches it, the script will snap the box to that candle, confirming the test.
Step 3: Confirm with Structure Don't sell blindly. Wait for a CHoCH Label (Change of Character) to appear. This confirms that the short-term uptrend has broken and sellers are stepping in.
Step 4: Target the Opposing Zone Aim for the next unmitigated Teal FVG (Bullish Support) or Order Block below.
⚙️ Settings & Customization
Filter Small Gaps: Uses an ATR filter (default 0.5) to ignore insignificant noise. Increase to 1.0 for a cleaner "Swings Only" view.
Show Midpoint: Toggles a dotted 50% equilibrium line inside every active gap.
Visual Style: Fully customizable colors. Default scheme is PyraTime Desert Gold & Oasis Teal.

S&D Trend Pullback StrategyThis is simple indicator for myself to alert me when in trend pullback and entry.
Use in M5 chart.
SL put 30-50pips
TP can set 30-90pips

virgin wick theorybased off of www.youtube.com strategy.
shows levels for the next HTF period to trade off of
make sure to check your htf to double check as the max lookback doesnt cover some levels occasionally

Dragon Flow Arrows (LITE)🚀 DRAGON FLOW ARROWS | Smart Trend Engine + Clean Reversal Arrows
A lightweight but highly-optimized trend system designed for clean charts, powerful visual signals, and no-noise directional flow. Built for traders who want simplicity, clarity, and professional-level momentum-filtered signals without over-complication.
🔥 Dragon Channel (Clean 3-Line Ribbon)
A smooth adaptive channel formed from ATR + EMA, giving you structural trend zones without clutter.
✅ Dragon Flow Gradient
A horizontal, color-shifted flow:
🟢 Bull flow → green glow
🔴 Bear flow → red glow
Automatic blend based on trend direction
Smooth visual transitions (no vertical stripes)
✅ Momentum-Filtered Arrows
BUY/SELL arrows only print when:
Price breaks outside the Dragon Channel
Momentum confirms (RSI + MACD filters)
Trend flips → one clean arrow per direction
✅ Smart Header Panel
At the top of your chart:
📌 Trend: Uptrend / Downtrend / Neutral
⚡ Impulse Strength: Weak / Normal / Strong
📊 How to Use
Entry:
- BUY Setup
Price moving above baseline
Dragon Flow turns bullish (cyan side)
Arrow appears below channel
- SELL Setup
Price breaks below baseline
Dragon Flow turns bearish (magenta side)
Arrow pops above channel
Exit / Filter:
Opposite arrow
Flow color shift
Trend panel flips
Works on Forex, Crypto, Stocks, Indices — all timeframes (just adjust the channel length).
Happy trading!
