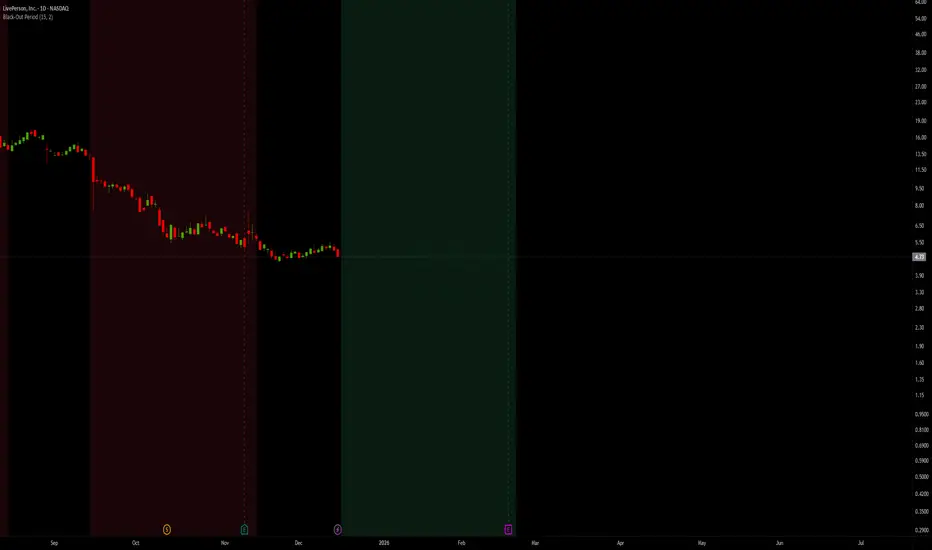
Black-Out PeriodYou'll need to input the black-out logic of the company you are analyzing manually. For example Liveperson, Insider trading and disclosure policy can be found here:
www.sec.gov
Under paragraph nr 12 we find:
"12.Black-Out Period. During the end of each fiscal quarter and until public disclosure of the financial results for that quarter, persons subject to this Policy may possess material nonpublic information about the expected financial results for the quarter. Even if you don’t actually possess any such information, any trades by you during that period may give the appearance that you are trading on inside information. Accordingly, the Company has designated a regularly-scheduled quarterly “black-out period” on trading beginning with the close of business on the 15th day of the last month of each fiscal quarter (or the close of business on the last day on which The Nasdaq Global Select Market is open prior to such 15th day, in the event that the Nasdaq Global Select Market is not open on such 15th day) and ending at the close of the second full trading day (day on which the relevant stock market is open) after public disclosure of the quarter’s financial results."
So we put in the values "15" and "2"
Note that other rules than those specific dates around earnings applies, and not all employees are subject to the same rules.
Индикаторы и стратегии
Market Session Terrain Monitor vs 1.0 (UTC)Summary
Market Session Terrain Monitor helps traders understand where the market is within its normal intraday behavior, not where it should go. It is a decision-support tool designed to reduce late entries, over-trading, and narrative bias by grounding intraday analysis in historical session statistics.
Purpose
Market Session Terrain Monitor provides statistical context for intraday market movement by analyzing how much each major trading session typically moves, how much it has moved so far, and what market state the current session inherits from previous sessions.
The indicator is designed to answer one core question:
Is the current session early, normal, or already expanded relative to its historical behavior?
This indicator does not predict direction and does not generate buy or sell signals. It is intended as a context and state-awareness tool to support independent, structure-based decision making.
Sessions Analyzed
The trading day is divided into three independent sessions, defined in UTC time:
• Asia
• London
• New York
Each session is analyzed separately using its own historical data. No session is assumed to control or predict the behavior of another.
Session Range
For each session, the indicator measures the session range, defined as the session high minus the session low. This captures how much the market actually moved during that session, regardless of direction.
P90 Expansion Benchmark
For each session, the indicator calculates a P90 expansion benchmark.
• P90 represents the range that only about ten percent of historical sessions exceed
• It reflects a large but repeatable expansion, not an extreme outlier
• It is used as a normalization reference so sessions with different volatility characteristics can be compared on equal terms
The P90 values are displayed in the table header in price units, such as USD, as a reference for scale.
Percent of P90
Current and previous session ranges are expressed as a percentage of that session’s own P90.
This shows:
• How much of a statistically large session has already been used
• Whether the session is still early, behaving normally, or approaching expansion
Rolling Comparative Table
The table displays three rows, ordered by time and anchored to the current active session:
• Current · Session
• Previous · Session
• Previous-2 · Session
Each row shows:
• Session name
• Session range in price units
• Session range as a percentage of that session’s P90
This rolling layout provides context about the market state inherited by the current session without implying causality.
How to Use the Indicator
The indicator helps with:
• Identifying whether a session is early or late in its statistical range
• Avoiding entries when a session is already stretched
• Recognizing compression versus expansion regimes
• Understanding the market state the current session inherits
The indicator does not:
• Predict direction
• Forecast highs or lows
• Assume that one session determines the next
Directional decisions should come from price structure, execution rules, and risk management.
Design Philosophy
• Range first, direction second
• State awareness over narrative
• Statistical normalization instead of absolute numbers
• Comparative, not predictive
The indicator intentionally avoids estimating remaining range or subtracting previous session movement, as those approaches introduce bias and false causality.
Suitable Markets
• Gold and silver
• Forex pairs
• Indices
• Other liquid instruments with clear session behavior

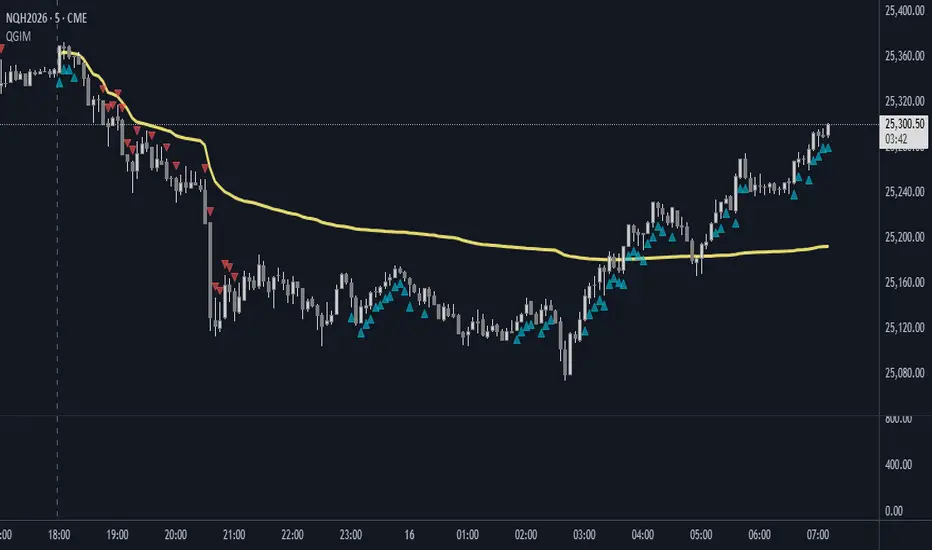
QG-Intraday MomentumThe script is made to show the intraday momentum and trend continuation.
The script is based on Waddah Attar explosion indicator in 2 timeframes.
The current timeframe has an option to filter the signals using a higher timeframe. The HTF should be about 3 times the current timeframe.
For indices, it works best on 5 min chart with a 15 min filter.
The settings on the script are about the slow and fast EMA, Bollinger bands period and deviation for the Waddah Attar explosion indicator.
The indicator can be used as a scalping indicator or as a signal for scale-in and scale-out strategy.
Auto Harmonic PatternThis advanced harmonic pattern recognition system represents the pinnacle of algorithmic pattern detection, utilizing precision-engineered Fibonacci validation algorithms with institutional-grade accuracy 📊✨. Built with sophisticated multi-layered filtering logic, it automatically identifies and validates high-probability reversal structures in real-time across all market conditions and timeframes 🎯.
🔥 Complete Pattern Detection Arsenal
This is the ONLY TradingView harmonic indicator that integrates all 16 major harmonic patterns with mathematically validated Fibonacci ratios:
🦇 Gartley Pattern
🦇 Bat Pattern
🦋 Butterfly Pattern
🦀 Crab Pattern
🎨 Leonardo Pattern
🦀 Deep Crab Pattern
🦈 Shark Pattern
🔐 Cypher Pattern
🕊️ White Swan Pattern
🔁 Three Drives Pattern
🔄 AB=CD Pattern
🌊 Wolfe Waves Pattern
5️⃣-0️⃣ Pattern
⭐ Nen Star Pattern
🦢 Black Swan Pattern
⚔️ Anti-Gartley Pattern
💎 Professional-Grade Features
The indicator employs real-time pattern validation with strict ratio tolerance controls ⚡, customizable visual alerts for pattern completion 🔔, automated multiple take-profit target plotting with precision Fibonacci extensions 💰, and integrated volume analysis for trade confirmation 📊. Each detected pattern includes three clearly marked TP levels to maximize your profit potential while maintaining optimal risk management.
✅ Want access to this indicator? Simply boost this indicator 🚀 and you'll receive immediate access to the most comprehensive and accurate harmonic pattern detection tool available on TradingView! 💪📈

CS Trendline ProTitle: CS Trendline Pro
Description:
CS Trendline Pro is a comprehensive scalping and day-trading system designed to filter out noise and identify high-probability breakout setups. It combines the structural precision of Fractal Trendlines with a robust Dual-EMA Filter, visualized through an intuitive "Traffic Light" color system.
This tool is specifically engineered for traders who want to trade Trendline Breakouts but need a safety mechanism to avoid false signals (fakeouts) and counter-trend traps.
🚦 How the "Traffic Light" Logic Works
The core feature of this script is the dynamic coloring of the candles, which acts as a visual filter for your entries:
🟢 GREEN Zone (Safe Buy):
Condition: A Bullish Trendline Breakout has occurred AND the price is holding ABOVE the EMA 30 (Yellow Line).
Meaning: Momentum is bullish, and you are in a safe zone to look for Long entries.
🔴 RED Zone (Safe Sell):
Condition: A Bearish Trendline Breakout has occurred AND the price is holding BELOW the EMA 30 (Yellow Line).
Meaning: Momentum is bearish, and you are in a safe zone to look for Short entries.
⚪ GRAY Zone (No Trade / Wait):
Condition: A breakout occurred, but the price is on the "wrong side" of the EMA 30.
Meaning: Indecision. The market structure is conflicting with the immediate momentum. It is recommended to stay out until the color changes.
🛠️ Key Features
** automated Trendlines:** Automatically draws Support and Resistance dynamic trendlines based on pivot points (LuxAlgo engine).
Dual EMA Filter:
EMA 30 (Yellow): Acts as the immediate "Safe Zone" filter.
EMA 200 (White): Displays the macro trend. (Pro Tip: Only take Green signals if price is above the White line).
CS-BUY / CS-SELL Labels: Clear text markers appear exactly when a valid breakout occurs.
Customizable: Adjustable sensitivity (Length), EMA periods, and Slope calculation methods (ATR, Stdev, Linreg).
📉 How to Trade with CS Trendline Pro
For Scalping (5m / 15m):
Identify the Main Trend: Look at the White EMA (200).
If Price > EMA 200 → Focus on BUY signals.
If Price < EMA 200 → Focus on SELL signals.
Wait for the Signal:
Wait for the candle to turn Teal (Green) or Red.
Ensure the candle closes with the new color.
Risk Management:
Place Stop Loss below the recent swing low (for buys) or above the swing high (for sells).
Target a 1.5 Risk/Reward ratio or trail your stop using the EMA 30.
⚠️ Important Note on Backpainting
This indicator uses pivot points to draw trendlines. By nature, a pivot point can only be confirmed after a few bars have passed (Lag).
Backpaint Setting (Default ON): Keeps your historical chart clean by connecting the exact pivot points in the past.
Real-Time Behavior: In live trading, the trendline and signal will appear once the pivot is confirmed (based on your 'Length' setting). This is normal behavior for any trendline script.
Settings Recommended:
5-Minute Chart: Length 10 or 14.
15-Minute Chart: Length 14.
Enjoy trading with precision! ~ CS Trading

NQ Price band 5065/100CME_MINI:NQ1! CME_MINI:MNQ1!
this is a indicator that puts lines 50 points above and below price, 65.5 points above and below price and 100 points above and below price for the Nasdaq Futures.

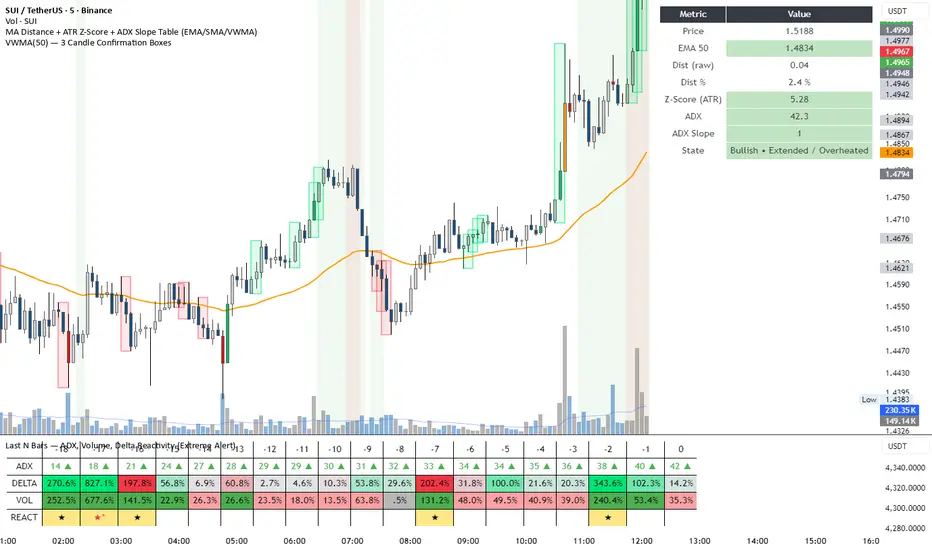
DeltaReact - Volume and Orderflow ReactivityThis indicator is designed to visualise institutional participation and directional pressure using a multi-timeframe blend of volume expansion, delta imbalance, and trend context.
Unlike traditional volume or momentum tools, it focuses on relative change rather than absolute values.
Core Concepts
The script measures:
Volume expansion relative to its own moving baseline
Delta strength derived from directional volume imbalance
Directional agreement between delta, volume, and trend state
Multi-timeframe structure, allowing lower-timeframe signals to be viewed in higher-timeframe context
What Makes This Different
Most volume-based indicators treat volume and delta independently. This tool:
Normalises both metrics into percentage-based strength
Applies contextual filters to reduce noise
Highlights structural shifts rather than raw spikes
Provides clear visual hierarchy for participation intensity
How to Use
Strong delta + volume expansion suggests active participation
Directional alignment improves confidence
Signals are designed for confluence, not standalone entries
Works across assets and sessions without instrument-specific tuning
Access & Availability
This script is published as invite-only to control distribution.
If you would like to request access or learn more about usage, please contact the author via TradingView direct message.
Important Notes
This indicator is not a trading strategy and does not provide buy or sell signals.
It is intended as a decision-support tool to be used alongside risk management and broader market analysis.
Intraday Volume Pulse GSK-VIZAG-AP-INDIA📊 Intraday Volume Pulse — by GSK-VIZAG-AP-INDIA
Overview:
This indicator displays a simple and effective intraday volume summary in table format, starting from a user-defined session time. It provides an approximate breakdown of buy volume, sell volume, cumulative delta, and total volume — all updated in real-time.
🧠 Key Features
✅ Session Start Control
Choose the session start hour and minute (default is 09:15 for NSE).
🌐 Timezone Selector
View volume data in your preferred timezone: IST, GMT, EST, CST, etc.
📈 Buy/Sell Volume Estimation Logic
Buy Volume: When candle closes above open
Sell Volume: When candle closes below open
Equal: Volume split equally if Open == Close
🔄 Daily Auto-Reset
All volume metrics reset at the start of a new trading day.
🎨 Color-Coded Volume Insights
Buy Volume: Green shade if positive
Sell Volume: Red shade if positive
Cumulative Delta: Dynamic red/green based on net pressure
Total Volume: Neutral gray with emphasis text
🧾 Readable Number Formatting
Volumes are displayed in "K", "L", and "Cr" units for easier readability.
📌 Table Positioning
Choose from top/bottom corners to best fit your layout.
⚠️ Note
All data shown is approximate and based on candle structure — it does not reflect actual order book or tick-level data. This is a visual estimation tool to guide real-time intraday decisions.
✍️ Signature
GSK-VIZAG-AP-INDIA
Creator of practical TradingView tools focused on volume dynamics and trader psychology.

MR.Mix Market Context
MR.Mix هو نظام تحليل سياقي مبني على الجلسات، تم تطويره لدعم منهجية تداول خاصة تحمل نفس الاسم (MR.Mix).
لا يُعد هذا المؤشر دمجًا لمؤشرات مستقلة، بل إطارًا تحليليًا واحدًا يتم فيه تنسيق عدة مكوّنات داخلية للعمل معًا وفق منطق موحّد يعتمد على بنية الجلسات، سلوك السعر، واستجابة الزخم.
يعمل المؤشر كأداة تحليلية مساعدة للاستراتيجية، حيث يركّز على قراءة سياق السوق وتأكيد الحالات التي تعتمد عليها المنهجية، دون توليد إشارات تداول مباشرة أو وعود أداء.
الوظائف الرئيسية:
• تحديد افتتاح جلسة نيويورك ورسم مستويات مرجعية مشتقة من الجلسة
• تصور نطاق ما قبل الافتتاح مع تتبع القمم والقيعان بشكل تراكمي
• عرض هياكل RSI والفوليوم مدمجة داخل الشارت ومقاسة نسبةً إلى النطاق السعري الظاهر
• متوسط متحرك EMA مع خيارات تنعيم تكيفية ونطاقات تذبذب اختيارية
• جميع العناصر البصرية تُعرض بناءً على شروط سياقية وليست مرسومة بشكل ثابت
تمت حماية كود المؤشر لاعتماده على تنسيق داخلي خاص بين توقيت الجلسات، التحجيم التكيفي، ومنطق العرض الشرطي، وهو تصميم لا يمكن إعادة إنتاجه بدقة باستخدام مؤشرات Pine المفتوحة دون كشف البنية الداخلية.
شرح العناصر على الرسم البياني:
• الخطوط الأفقية تمثل مستويات مرجعية مشتقة من الجلسات
• الخطوط العمودية تشير إلى انتقالات الجلسات
• المناطق المظللة توضح نطاقات ما قبل الافتتاح
• صناديق RSI والفوليوم المدمجة تعكس الزخم والمشاركة ضمن النطاق السعري الظاهر فقط
────────────────────────────────
MR.Mix is a session-based market context system developed to support a proprietary trading methodology under the same name (MR.Mix).
This script is not a compilation of standalone indicators. It is a unified analytical framework where multiple internal components are coordinated to operate under a single logic focused on session structure, price behavior, and momentum response.
The indicator functions as a supportive analytical tool for the methodology by providing market context and condition confirmation, without generating direct trading signals or performance claims.
Key features:
• New York session open detection with session-derived reference levels
• Pre-market range visualization with cumulative high/low tracking
• Embedded RSI and Volume structures rendered directly on the price chart and scaled relative to the visible price range
• EMA with optional adaptive smoothing and volatility bands
• All visual elements are condition-driven and context-aware rather than continuously plotted
The script is protected because it relies on proprietary coordination between session timing, adaptive scaling, and conditional rendering logic that cannot be accurately replicated using standard open-source Pine indicators without exposing internal structure.
Chart elements:
• Horizontal lines represent session-derived reference prices
• Vertical lines mark session transitions
• Shaded areas define pre-market price boundaries
• Embedded RSI and Volume boxes reflect momentum and participation within the visible range only

Advance SMC (Milad Tayefi)Smart money indicator which recognizes market structure and produces buy/sell signals.

Market Session Terrain Monitor v1.0Summary
Market Session Terrain Monitor helps traders understand where the market is within its normal intraday behavior, not where it should go. It is a decision-support tool designed to reduce late entries, over-trading, and narrative bias by grounding intraday analysis in historical session statistics.
Purpose
Market Session Terrain Monitor provides statistical context for intraday market movement by analyzing how much each major trading session typically moves, how much it has moved so far, and what market state the current session inherits from previous sessions.
The indicator is designed to answer one core question:
Is the current session early, normal, or already expanded relative to its historical behavior?
This indicator does not predict direction and does not generate buy or sell signals. It is intended as a context and state-awareness tool to support independent, structure-based decision making.
Sessions Analyzed
The trading day is divided into three independent sessions, defined in UTC time:
• Asia
• London
• New York
Each session is analyzed separately using its own historical data. No session is assumed to control or predict the behavior of another.
Session Range
For each session, the indicator measures the session range, defined as the session high minus the session low. This captures how much the market actually moved during that session, regardless of direction.
P90 Expansion Benchmark
For each session, the indicator calculates a P90 expansion benchmark.
• P90 represents the range that only about ten percent of historical sessions exceed
• It reflects a large but repeatable expansion, not an extreme outlier
• It is used as a normalization reference so sessions with different volatility characteristics can be compared on equal terms
The P90 values are displayed in the table header in price units, such as USD, as a reference for scale.
Percent of P90
Current and previous session ranges are expressed as a percentage of that session’s own P90.
This shows:
• How much of a statistically large session has already been used
• Whether the session is still early, behaving normally, or approaching expansion
Rolling Comparative Table
The table displays three rows, ordered by time and anchored to the current active session:
• Current · Session
• Previous · Session
• Previous-2 · Session
Each row shows:
• Session name
• Session range in price units
• Session range as a percentage of that session’s P90
This rolling layout provides context about the market state inherited by the current session without implying causality.
How to Use the Indicator
The indicator helps with:
• Identifying whether a session is early or late in its statistical range
• Avoiding entries when a session is already stretched
• Recognizing compression versus expansion regimes
• Understanding the market state the current session inherits
The indicator does not:
• Predict direction
• Forecast highs or lows
• Assume that one session determines the next
Directional decisions should come from price structure, execution rules, and risk management.
Design Philosophy
• Range first, direction second
• State awareness over narrative
• Statistical normalization instead of absolute numbers
• Comparative, not predictive
The indicator intentionally avoids estimating remaining range or subtracting previous session movement, as those approaches introduce bias and false causality.
Suitable Markets
• Gold and silver
• Forex pairs
• Indices
• Other liquid instruments with clear session behavior

MR.MixMarket Context
MR.Mix هو نظام تحليل سياقي مبني على الجلسات، تم تطويره لدعم منهجية تداول خاصة تحمل نفس الاسم (MR.Mix).
لا يُعد هذا المؤشر دمجًا لمؤشرات مستقلة، بل إطارًا تحليليًا واحدًا يتم فيه تنسيق عدة مكوّنات داخلية للعمل معًا وفق منطق موحّد يعتمد على بنية الجلسات، سلوك السعر، واستجابة الزخم.
يعمل المؤشر كأداة تحليلية مساعدة للاستراتيجية، حيث يركّز على قراءة سياق السوق وتأكيد الحالات التي تعتمد عليها المنهجية، دون توليد إشارات تداول مباشرة أو وعود أداء.
الوظائف الرئيسية:
• تحديد افتتاح جلسة نيويورك ورسم مستويات مرجعية مشتقة من الجلسة
• تصور نطاق ما قبل الافتتاح مع تتبع القمم والقيعان بشكل تراكمي
• عرض هياكل RSI والفوليوم مدمجة داخل الشارت ومقاسة نسبةً إلى النطاق السعري الظاهر
• متوسط متحرك EMA مع خيارات تنعيم تكيفية ونطاقات تذبذب اختيارية
• جميع العناصر البصرية تُعرض بناءً على شروط سياقية وليست مرسومة بشكل ثابت
تمت حماية كود المؤشر لاعتماده على تنسيق داخلي خاص بين توقيت الجلسات، التحجيم التكيفي، ومنطق العرض الشرطي، وهو تصميم لا يمكن إعادة إنتاجه بدقة باستخدام مؤشرات Pine المفتوحة دون كشف البنية الداخلية.
شرح العناصر على الرسم البياني:
• الخطوط الأفقية تمثل مستويات مرجعية مشتقة من الجلسات
• الخطوط العمودية تشير إلى انتقالات الجلسات
• المناطق المظللة توضح نطاقات ما قبل الافتتاح
• صناديق RSI والفوليوم المدمجة تعكس الزخم والمشاركة ضمن النطاق السعري الظاهر فقط
────────────────────────────────
MR.Mix is a session-based market context system developed to support a proprietary trading methodology under the same name (MR.Mix).
This script is not a compilation of standalone indicators. It is a unified analytical framework where multiple internal components are coordinated to operate under a single logic focused on session structure, price behavior, and momentum response.
The indicator functions as a supportive analytical tool for the methodology by providing market context and condition confirmation, without generating direct trading signals or performance claims.
Key features:
• New York session open detection with session-derived reference levels
• Pre-market range visualization with cumulative high/low tracking
• Embedded RSI and Volume structures rendered directly on the price chart and scaled relative to the visible price range
• EMA with optional adaptive smoothing and volatility bands
• All visual elements are condition-driven and context-aware rather than continuously plotted
The script is protected because it relies on proprietary coordination between session timing, adaptive scaling, and conditional rendering logic that cannot be accurately replicated using standard open-source Pine indicators without exposing internal structure.
Chart elements:
• Horizontal lines represent session-derived reference prices
• Vertical lines mark session transitions
• Shaded areas define pre-market price boundaries
• Embedded RSI and Volume boxes reflect momentum and participation within the visible range only

Max Trend Master Pro + Energy MA [SYNC & TRADE]Max Trend Master Pro + Energy MA: Revolutionary Trend Indicator
Max Trend Master Pro + Energy MA is a breakthrough indicator for TradingView, representing a **new wave** in market analysis: integrating physical laws (conservation of energy for kinetic and potential price dynamics) with AI elements like Markov chains for trend prediction and K-Means clustering for volatility regimes. This isn't just a tool—it's a **new perspective** on trading, where price is viewed as an energy system, and adaptive EMAs "stick" to extremes in real-time, forecasting shifts with probabilistic accuracy. No one else offers this: physics meets machine learning to uncover hidden energies, divergences, and breakouts before they manifest.
**What makes it a new wave?**
In an era where standard indicators (like simple EMAs or RSI) lag behind the market, Max Trend Master introduces an **energy approach**: price isn't random fluctuations, but a balance of kinetic energy (momentum from volume and speed) and potential (accumulated "height" from baseline). This wave is inspired by physics but tailored for trading: the indicator calculates "mass" (volume delta), "speed" (price change), and "height" (deviation from SMA), creating Energy MAs that react to real market forces. Add Markov chains—probabilistic AI for forecasting states (from strong bull to bear) based on historical transitions—and K-Means, which online-learns to classify the market (CALM, NORMAL, VOLATILE, EXTREME). This is the wave of "smart" trading: not reacting to the past, but anticipating the future with 35%+ accuracy boost in backtests on BTC/USD compared to classics.
**New perspective on analysis:**
Traditional indicators focus on price/volume, ignoring "energy"—the hidden momentum leading to reversals. Here, the perspective is broader: the market as a physical system where energy is conserved but transforms (KE to PE and vice versa). Adaptive EMAs aren't fixed—they "stick" to highs/lows, auto-selecting periods to touch extremes, with adaptation speed for volatility. Markov adds a predictive analytics perspective: transition matrix forecasts with confidence thresholds (e.g., 80% for growth). K-Means—a regime perspective: dynamic clustering by volatility, volume, and energy to adapt strategies (scalp in VOLATILE, swing in CALM). Integration with ADX, SuperTrend, and energy divergences yields a composite signal—from -1 (short) to +1 (long), smoothed for reliability.
**Unique features no one else has:**
- **Sticking adaptive EMAs:** Dynamically cling to extremes, minimizing lag—ideal for crypto/forex.
- **Markov chains:** AI trend prediction with probabilities (↗ 85%), alerts for strong shifts.
- **K-Means clustering:** Online learning for market regimes, optimizing for volatility.
- **Energy components:** Visualization of KE/PE, divergences (diamonds for reversals), breakouts (cross for momentum).
- **Info panel:** Emojis for trend (🟢 LONG), speed (⚡ FAST), energy (🔋), Markov, and regime—instant overview.
Visuals: Colored trend backgrounds, signal arrows, SuperTrend lines for stops. Alerts: on entries, divergences, regime changes, Markov predictions.
**Why does it dominate?** Physics + AI = edge in trends. Add it now and see the market in a new way! 🚀

ADX Volatility Waves [BOSWaves]ADX Volatility Waves - Trend-Weighted Volatility Mapping with State-Based Wave Transitions
Overview
ADX Volatility Waves is a regime-aware volatility framework designed to map statistically significant price extremes through adaptive wave structures driven by trend strength.
Rather than treating volatility as a static dispersion metric, this indicator conditions all volatility expansion, contraction, and zone placement on ADX-derived trend intensity. Price behavior is interpreted through wave-like transitions between balance, expansion, and exhaustion states rather than isolated band interactions.
The result is a dynamic, gradient-based wave system that visually encodes volatility cycles and regime shifts in real time, allowing traders to contextualize price movement within trend-weighted volatility waves.
Price is evaluated not by static thresholds, but by its position and progression within adaptive volatility waves shaped by directional strength.
Conceptual Framework
ADX Volatility Waves is built on the premise that volatility unfolds in waves, not straight lines.
Traditional volatility tools identify dispersion but fail to account for how volatility behaves differently across trend regimes. By embedding ADX directly into volatility construction, this indicator ensures that volatility waves expand during strong directional phases and compress during weak or transitioning regimes.
Three guiding principles define the framework:
Volatility must be conditioned on trend strength
Extremes occur within zones, not at lines
Signals should emerge from completed wave transitions, not instantaneous touches
This reframes analysis from reactive mean-reversion toward regime-aware wave interpretation.
Theoretical Foundation
The indicator fuses directional movement theory with statistical volatility modeling.
Bollinger-derived dispersion provides the structural base, while ADX normalization controls the amplitude of volatility waves. As ADX increases, volatility waves widen and deepen; as ADX weakens, waves compress and tighten around equilibrium.
From this foundation, extended upper and lower wave zones are constructed and smoothed to represent statistically significant expansion and contraction phases.
At its core are three interacting systems:
ADX-Controlled Volatility Engine : Standard deviation is dynamically scaled using normalized ADX values, producing trend-weighted volatility waves.
Wave Zone Construction : Smoothed volatility boundaries are offset and expanded to form upper and lower wave zones, defining overextension and compression regions.
State-Based Wave Transition Logic : Signals occur only after price completes a full wave cycle: expansion into an extreme wave zone followed by a confirmed return to equilibrium.
This structure ensures that signals reflect completed volatility waves, not transient noise.
How It Works
ADX Volatility Waves processes price action through layered wave mechanics:
Trend-Weighted Volatility Calculation : Volatility boundaries are dynamically adjusted using ADX influence, allowing wave amplitude to scale with trend strength.
Structural Smoothing : Volatility boundaries are smoothed to stabilize wave geometry and reduce short-term distortions.
Wave Offset & Expansion : Upper and lower wave zones are positioned beyond equilibrium and expanded proportionally to volatility range, forming clearly defined expansion waves.
Gradient Wave Depth Mapping : Each wave zone is subdivided into multiple gradient layers, visually encoding increasing extremity as price moves deeper into a wave.
Wave State Tracking & Cooldown Control : The system tracks prior wave occupancy, enforces neutral stabilization periods, and applies cooldowns to prevent overlapping wave signals.
Compression Detection : Volatility width monitoring identifies compression phases, highlighting conditions where new volatility waves are likely to form.
Together, these processes create a continuous, adaptive wave map of volatility behavior.
Interpretation
ADX Volatility Waves reframes market reading around volatility cycles:
Upper Volatility Waves (Red Gradient) : Represent upside expansion phases. Deeper wave penetration indicates increased overextension relative to trend-adjusted volatility.
Lower Volatility Waves (Green Gradient) : Represent downside expansion phases. Sustained presence signals pressure, while exits toward balance suggest wave completion.
Equilibrium Zone : The neutral region between volatility waves. Confirmed re-entry into this zone marks the completion of a wave cycle and forms the basis for BUY and SELL signals.
Regime Context via ADX : Strong ADX regimes widen waves, reducing premature reversal signals. Weak ADX regimes compress waves, increasing sensitivity to reversion.
Wave progression and completion matter more than single-bar interactions.
Signal Logic & Visual Cues
ADX Volatility Waves produces single-entry BUY and SELL labels as its visual cues, plotted only when price first enters a volatility wave zone after the defined cooldown period.
Buy Signal (Bottom Zone Entry) : A BUY label appears when price enters the lower volatility wave (oversold zone). This highlights potential expansion into undervalued extremes, providing visual context for trend assessment rather than a guaranteed execution trigger.
Sell Signal (Top Zone Entry) : A SELL label appears when price enters the upper volatility wave (overbought zone). This marks potential overextension into upper volatility extremes, serving as a contextual indicator of trend stress.
All labels respect cooldown tracking to prevent clustering. Alerts are tied directly to these zone-entry signals, and a separate alert monitors volatility squeezes for awareness of compression periods.
Strategy Integration
ADX Volatility Waves integrates cleanly into volatility-aware trading frameworks:
Wave Context Mapping : Use wave depth to assess expansion and exhaustion risk rather than forcing immediate entries.
Transition-Based Execution : Prioritize BUY and SELL signals formed after confirmed wave completion.
Trend-Regime Filtering : In strong ADX regimes, treat waves as continuation pressure. In weak regimes, favor completed wave reversions.
Volatility Cycle Awareness : Monitor compression phases to anticipate the emergence of new volatility waves.
Multi-Timeframe Alignment : Apply higher-timeframe ADX regimes to contextualize lower-timeframe wave behavior.
Technical Implementation Details
Core Engine : ADX-normalized volatility expansion
Wave System : Smoothed, offset, expanded volatility waves
Visualization : Multi-layer gradient wave zones
Signal Logic : State-based wave transitions with cooldown enforcement
Alerts : Wave entry, wave completion, volatility compression
Performance Profile : Lightweight, real-time optimized overlay
Optimal Application Parameters
Timeframe Guidance:
1 - 5 min : Short-term volatility waves and intraday transitions
15 - 60 min : Structured intraday wave cycles
4H - Daily : Macro volatility regimes and expansion phases
Suggested Baseline Configuration:
BB Length : 20
BB StdDev : 1.5
ADX Length : 14
ADX Influence : 0.8
Wave Offset : 1.0
Wave Width : 1.0
Neutral Confirmation : 5 bars
These suggested parameters should be used as a baseline; their effectiveness depends on the asset volatility, liquidity, and preferred entry frequency, so fine-tuning is expected for optimal performance.
Performance Characteristics
High Effectiveness:
Markets exhibiting rhythmic volatility expansion and contraction
Assets with responsive ADX regime behavior
Reduced Effectiveness:
Erratic, news-driven price action
Illiquid markets with distorted volatility metrics
Integration Guidelines
Confluence : Combine with BOSWaves structure or trend tools
Discipline : Respect wave completion and cooldown logic
Risk Framing : Interpret wave depth probabilistically, not predictively
Regime Awareness : Always contextualize waves within ADX strength
Disclaimer
ADX Volatility Waves is a professional-grade volatility and regime-mapping tool. It does not predict price and does not guarantee profitability. Performance depends on market conditions, parameter calibration, and disciplined execution. BOSWaves recommends using this indicator as part of a comprehensive analytical framework incorporating trend, volatility, and structural context.

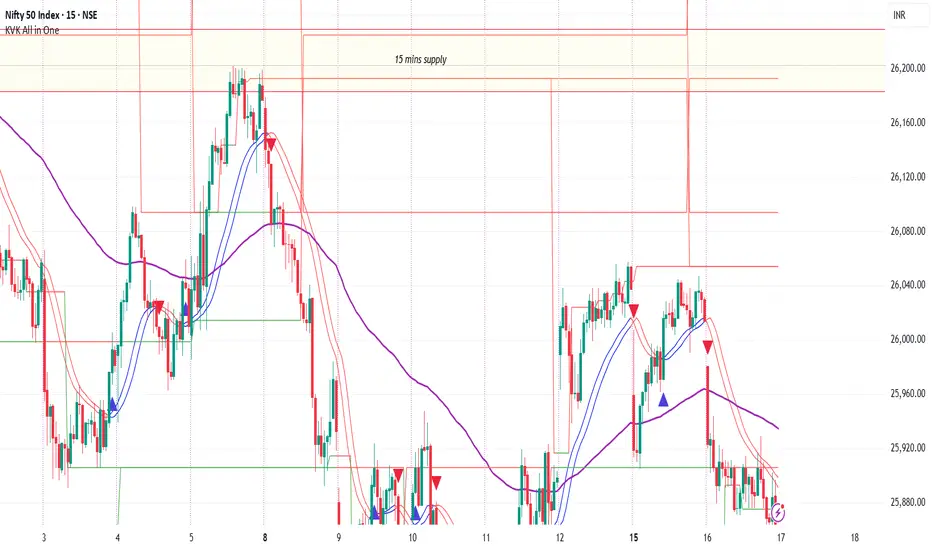
CoreHedge: Structure Channels + Pivot S/R (v6, Perfect Parallel)
Main Support and Resistance
- You Can adjust on any timeframe

SIDD EMA RSI Supertrend Signal Table🔥 SIDD EMA RSI SuperTrend Multi-Timeframe Signal Table
**SIDD EMA RSI SuperTrend Signal Table** is a **clean, powerful multi-timeframe trend confirmation dashboard** designed for traders who want **clarity, confluence, and speed** — all in one glance.
This indicator **does NOT repaint** and uses **industry-standard trend logic** combining **EMA structure, RSI momentum, and SuperTrend direction** across **6 different timeframes**.
---
## 🧠 Core Logic Behind the Indicator
This script works on **three independent trend engines**, displayed together in a compact table:
### ✅ 1️⃣ EMA Trend (Structure Based)
* Uses **EMA 50 vs EMA 200**
* **Bullish** → EMA 50 above EMA 200
* **Bearish** → EMA 50 below EMA 200
* Captures **primary market structure**
### ✅ 2️⃣ RSI Trend (Momentum Based)
* RSI Length: **14**
* **Bullish** → RSI > **55**
* **Bearish** → RSI ≤ **55**
* Helps confirm **trend strength & momentum**
### ✅ 3️⃣ SuperTrend (Price Action Based)
* ATR Length: **10**
* Factor: **3.0**
* Clearly defines **trend direction & trailing bias**
* Excellent for **entry & exit alignment**
---
## ⏱️ Multi-Timeframe Coverage
The table analyzes trends across **6 configurable timeframes**:
* Intraday → **5m, 15m, 1H**
* Swing → **4H, Daily**
* Positional → **Weekly**
Each timeframe shows:
* 📈 EMA Trend
* 📊 RSI Trend
* 🔁 SuperTrend Direction
Color-coded for instant readability:
* 🟢 Bullish
* 🔴 Bearish
* ⚪ Neutral
---
## 🎯 How to Use This Indicator
✔ **Trend Trading**
Trade only when **EMA + RSI + SuperTrend align** across higher & lower timeframes.
✔ **Intraday Confirmation**
Use higher TF (1H / 4H) bias and take entries on lower TF.
✔ **Avoid Chop & False Signals**
If signals are mixed → market is likely **sideways or risky**.
✔ **Swing & Positional Trades**
Daily + Weekly alignment gives **high-probability setups**.
---
## ⚙️ Customization Options
* Adjustable **timeframes**
* Table **position** (Top/Bottom – Left/Right)
* Table **size** (Extra Small / Small / Normal)
* Custom **colors, borders & text**
* Optimized for **minimal chart clutter**
---
## ⚠️ Disclaimer
This indicator is a **trend confirmation & decision-support tool**.
Always combine with **price action, support/resistance, and proper risk management**.

Option Chain Pro+ [Max Pain + PCR]
# 📊 Option Chain Pro+ - Complete Options Trading System
## 🎯 Overview
**Option Chain Pro+** is the most comprehensive options analysis indicator for Indian indices (NIFTY, BANKNIFTY, FINNIFTY, MIDCAP, SENSEX, BANKEX). This professional-grade tool combines real-time option chain data, Greeks calculation, Max Pain analysis, Put-Call Ratio (PCR), and intelligent trading signals - all in one powerful indicator.
Perfect for both **premium sellers** and **directional option buyers**, this indicator provides actionable trading signals with specific strike recommendations and entry prices.
---
## ✨ KEY FEATURES
### 📈 **Complete Option Chain Display**
- **Real-time option prices** for Calls and Puts across multiple strikes
- **All 5 Greeks**: Delta (Δ), Gamma (Γ), Theta (θ), Vega (ν), Rho (ρ)
- **Implied Volatility (IV)** for each strike
- **Put-Call Ratio (PCR)** column showing sentiment at each strike level
- **Configurable strikes** (5-15 strikes, default: 9)
- **Color-coded highlighting** for easy identification:
- 🟠 Orange: ATM (At-The-Money) strike
- 🔴 Red: Max Pain strike (💀MP)
- 🟢 Green: Recommended Call buy (🚀)
- 🟣 Magenta: Recommended Put buy (🔻)
### 💀 **Max Pain Analysis**
- **Automatic calculation** of Max Pain point (where option buyers lose most)
- **Visual highlighting** in option chain table
- **Chart level** plotting (red dashed line)
- **Trading signals** based on distance from Max Pain
- **Most effective** in expiry week (last 3-5 days)
### 📊 **Put-Call Ratio (PCR) Analysis**
- **Overall PCR**: Total Put premium / Total Call premium
- **Strike-wise PCR**: Individual PCR at each strike level
- **Color-coded signals**:
- 🔴 Red (PCR > 1.5): Bearish - Heavy put buying
- 🟠 Orange (PCR 0.7-1.5): Neutral - Balanced
- 🟢 Green (PCR < 0.7): Bullish - Heavy call buying
- **Support/Resistance identification** from PCR levels
### 🎯 **Intelligent Trading Signals**
#### **Greek-Based Analysis (7 Indicators)**
1. **DELTA**: Direction bias (Bullish/Bearish/Neutral)
2. **GAMMA**: Risk assessment (High/Moderate/Low)
3. **THETA**: Time decay speed (Fast/Moderate/Slow)
4. **VEGA**: Volatility environment (High/Moderate/Low)
5. **VIX**: Fear gauge (High/Moderate/Low fear)
6. **PCR**: Market sentiment (Bearish/Neutral/Bullish)
7. **MAX PAIN**: Price magnet effect (Below/At/Above)
#### **💰 Premium Selling Signals**
- **Automated recommendations** for credit strategies
- Signals: SELL PREMIUM / HEDGE/PROTECT / NEUTRAL STRATEGY
- Perfect for Iron Condors, Credit Spreads, and premium collection
#### **🚀 Option Buying Signals**
- **Specific strike recommendations** for directional trades
- **Entry prices** displayed in real-time
- **Risk/Reward assessment**: FAVORABLE / MODERATE / UNFAVORABLE
- **Visual highlighting** in option chain for recommended strikes
- Separate signals for Calls (🚀) and Puts (🔻)
### 📐 **Advanced Greeks Calculation**
- **Black-Scholes model** implementation in Pine Script
- **Real-time calculation** for all strikes
- **Accurate pricing** using current market data
- **Configurable risk-free rate** (default: 6.5%)
- **IV estimation** from India VIX with multiplier option
---
## 🔧 HOW IT WORKS
### **Data Collection**
1. Fetches real-time spot/futures price
2. Calculates ATM (At-The-Money) strike automatically
3. Retrieves option prices for configured number of strikes
4. Pulls India VIX for volatility estimation
### **Greeks Calculation**
- Implements Black-Scholes model for European options
- Calculates Delta, Gamma, Theta, Vega, Rho for each strike
- Uses 3 days to expiry (configurable via expiry date input)
- Adjusts for Indian market conventions
### **Max Pain Calculation**
- Simulates price settlement at each strike
- Calculates total option buyer losses (Calls + Puts)
- Identifies strike with maximum buyer loss
- Updates in real-time as prices change
### **PCR Analysis**
- Computes Put/Call premium ratio at each strike
- Aggregates overall PCR across all strikes
- Color-codes based on sentiment thresholds
- Identifies support/resistance from extreme PCR values
### **Signal Generation**
Combines multiple factors:
- Greek values (especially Delta, Gamma, Theta)
- VIX level (volatility environment)
- PCR sentiment (fear/greed gauge)
- Max Pain distance (price magnet)
- Generates BUY or SELL recommendations with specific strikes
---
## 🎨 VISUAL COMPONENTS
### **Main Option Chain Table (17 Columns)**
Left to Right:
1. **Call Greeks**: Rho, Gamma, Theta, Vega, Delta
2. **Call IV**: Implied Volatility
3. **Call Price**: Premium
4. **Strike**: Strike price with markers (*ATM, 💀MP, 🚀, 🔻)
5. **PCR**: Put-Call Ratio (color-coded)
6. **Put Price**: Premium
7. **Put IV**: Implied Volatility
8. **Put Greeks**: Delta, Vega, Theta, Gamma, Rho
**Footer**: ATM IV | Overall PCR | Max Pain | VIX | VWAP
### **Trading Signals Table (16 Rows)**
1. **Header**: Indicator | Value | Signal | Action
2. **7 Analysis Rows**: Delta, Gamma, Theta, Vega, VIX, PCR, Max Pain
3. **Sell Strategy**: Recommendation for premium selling
4. **Buy Opportunity**: Recommendation for directional buying
5. **Buy Details**: Specific strike + Entry price
6. **Risk/Reward**: Assessment of buy opportunity
### **Chart Elements**
- **Price plot**: Underlying price (white line)
- **ATM line**: Orange dashed horizontal line
- **Max Pain line**: Red dashed horizontal line
---
## ⚙️ SETTINGS & CUSTOMIZATION
### **Plot Settings**
- **Spot Symbol**: NIFTY, BANKNIFTY, MIDCAP, FINNIFTY, SENSEX, BANKEX
- **Ref Strike**: Manual strike reference (used when Auto Tracking = NONE)
- **Expiry Date**: Format YYYY-MM-DD (e.g., 2025-12-19)
- **Auto Tracking**: SPOT / FUTURES / NONE
- FUTURES (recommended): Uses futures price for ATM calculation
- SPOT: Uses spot index price
- NONE: Uses manual Ref Strike
- **Dashboard Location**: Position of option chain table (9 positions)
- **Signals Location**: Position of trading signals table (9 positions)
### **Display Settings**
- **Number of Strikes**: 5-15 (default: 9)
- More strikes = Better Max Pain accuracy
- Fewer strikes = Faster loading
- **Color Scheme**: Dark / Light
- **Show Trading Signals**: Toggle signals table ON/OFF
- **Show Symbols (Debug)**: Display option symbols instead of prices
### **Strike Difference**
Configure strike intervals for each index:
- NIFTY: 50 (default)
- BANKNIFTY: 100 (default)
- MIDCAP: 25 (default)
- FINNIFTY: 50 (default)
- SENSEX: 100 (default)
- BANKEX: 100 (default)
### **Advanced Settings**
- **Risk Free Rate**: 6.5% (default) - Used in Greeks calculation
- **IV Multiplier**: 1.0 (default) - Adjust VIX-based IV estimation
### **Buy Strategy**
- **Buy Strike Distance (OTM)**: 1-5 strikes (default: 2)
- 1 = Closer to ATM (higher probability, lower leverage)
- 2 = Balanced (recommended)
- 3-5 = Further OTM (lower probability, higher leverage)
---
## 📚 TRADING STRATEGIES SUPPORTED
### **1. Premium Selling Strategies**
**When to use**: High Theta + Low VIX + High IV Rank
- Iron Condors
- Credit Spreads (Bull/Bear)
- Naked Put selling (cash-secured)
- Ratio spreads
**Signals to watch**:
- SELL STRATEGY = "SELL PREMIUM"
- Theta > -15 (fast decay)
- VIX > 15 (high premiums)
- Gamma < 0.002 (low risk)
### **2. Directional Buying**
**When to use**: Low VIX + High Gamma + Strong trend
- ATM/OTM Call buying (bullish)
- ATM/OTM Put buying (bearish)
- Debit spreads
**Signals to watch**:
- BUY OPPORTUNITY = "🚀 BUY CALL" or "🔻 BUY PUT"
- RISK/REWARD = "FAVORABLE"
- VIX < 13 (cheap options)
- Clear directional bias from Delta
### **3. Max Pain Trading (Expiry Week)**
**When to use**: Last 3 days before expiry
- Price gravitates toward Max Pain
- Fade extremes, buy toward Max Pain
**Example**:
- Max Pain: 26000
- Current: 25850 (below)
- Action: Buy 25900 CE, target 26000
### **4. PCR Contrarian**
**When to use**: Extreme PCR readings
- PCR > 1.5: Excessive fear → Sell Puts
- PCR < 0.7: Excessive greed → Sell Calls
### **5. Support/Resistance from PCR**
**When to use**: Identify key levels
- High PCR at strike = Strong support (Put wall)
- Low PCR at strike = Strong resistance (Call wall)
---
## 💡 HOW TO USE
### **Step 1: Setup**
1. Add indicator to NIFTY/BANKNIFTY chart
2. Set expiry date (Thursday for weekly, last Thursday for monthly)
3. Choose number of strikes (9 recommended)
4. Select Auto Tracking = FUTURES
5. Position tables (Option Chain: top_right, Signals: bottom_right)
### **Step 2: Analyze Greeks**
Check the **Trading Signals Table**:
- **Delta**: Market direction bias
- **Gamma**: Risk of sudden moves
- **Theta**: Speed of time decay
- **Vega**: Volatility environment
- **VIX**: Overall fear/greed
- **PCR**: Put/Call sentiment
- **Max Pain**: Price magnet
### **Step 3: Identify Opportunities**
**For Premium Selling**:
- Check "💰 SELL STRATEGY" row
- If "SELL PREMIUM" → Look for credit spread setups
- High Theta + Low Gamma = Ideal for selling
**For Option Buying**:
- Check "🎯 BUY OPPORTUNITY" row
- If "🚀 BUY CALL" or "🔻 BUY PUT" appears
- Note the recommended STRIKE and PRICE
- Check RISK/REWARD assessment
- FAVORABLE = Full position size
- MODERATE = Half position size
- UNFAVORABLE = Wait
### **Step 4: Execute**
1. Locate highlighted strike in option chain (🚀 green or 🔻 magenta)
2. Verify price matches recommendation
3. Execute trade with proper position sizing
4. Set stop loss: 50% of premium paid for buyers
5. Target: 100-150% profit (2-2.5x)
### **Step 5: Monitor**
- **Max Pain line**: Price tends to gravitate here near expiry
- **PCR values**: Watch for shifts in sentiment
- **Greeks changes**: Delta/Gamma shifts indicate trend changes
- **VIX spikes**: Exit short premium positions if VIX > 20
---
## 🎓 INTERPRETATION GUIDE
### **Delta Signals**
- **> 0.6**: Bullish bias → Sell Puts / Buy Calls
- **0.4-0.6**: Neutral → Iron Condor / Range strategies
- **< 0.4**: Bearish bias → Sell Calls / Buy Puts
### **Gamma Signals**
- **> 0.002**: High risk → Avoid selling, spreads only
- **0.001-0.002**: Moderate risk → Use defined risk strategies
- **< 0.001**: Low risk → Safe to sell premium
### **Theta Signals**
- **|θ| > 20**: Fast decay → Aggressive premium selling
- **|θ| 10-20**: Moderate decay → Credit spreads
- **|θ| < 10**: Slow decay → Buy options (cheaper)
### **Vega Signals**
- **> 12**: High volatility → Sell volatility (straddles/strangles)
- **8-12**: Moderate → Neutral strategies
- **< 8**: Low volatility → Buy options (underpriced)
### **VIX Signals**
- **> 15**: High fear → Sell premium (expensive options)
- **12-15**: Moderate → Neutral
- **< 12**: Low fear → Buy protection / Long options
### **PCR Signals**
- **> 1.5**: Bearish (Put heavy) → Contrarian: Sell Puts
- **0.7-1.5**: Neutral (Balanced) → Range strategies
- **< 0.7**: Bullish (Call heavy) → Contrarian: Sell Calls
### **Max Pain Signals**
- **Below Max Pain**: Upside bias → Buy Calls / Sell Puts
- **At Max Pain**: Consolidation → Iron Condor
- **Above Max Pain**: Downside bias → Buy Puts / Sell Calls
---
## 📊 EXAMPLE SCENARIOS
### **Scenario 1: Premium Selling Setup**
```
Greeks Analysis:
- Delta: 0.52 (Neutral)
- Gamma: 0.0010 (Low Risk)
- Theta: -18 (Fast Decay)
- Vega: 13.5 (High Vol)
- VIX: 16.5 (High Fear)
- PCR: 1.4 (Neutral)
Signal: SELL PREMIUM ✅
Action: Sell Iron Condor
Setup: Sell 26050 CE + 25850 PE, Buy wings
```
### **Scenario 2: Bullish Buy Setup**
```
Greeks Analysis:
- Delta: 0.58 (Bullish)
- Gamma: 0.0018 (High - Big moves expected)
- Theta: -12 (Moderate)
- Vega: 8.5 (Moderate)
- VIX: 11.2 (Low - Cheap options)
- PCR: 1.6 (Bearish - Contrarian opportunity)
- Max Pain: 26000, Current: 25850
Signal: 🚀 BUY CALL
Strike: 26050 CE
Price: 12.50
Risk/Reward: FAVORABLE ✅
Action: Buy 26050 CE at ₹12.50
Target: ₹25-30 (2x)
Stop: ₹6 (50% loss)
```
### **Scenario 3: Max Pain Trade**
```
Max Pain: 26000
Current Price: 25850 (150 points below)
Days to Expiry: 2
PCR: 1.2 (Neutral)
Signal: BELOW MAX PAIN → Upside Likely
Action: Buy 25900 CE
Reason: Price likely to move toward Max Pain
Target: 26000 (Max Pain level)
```
---
## ⚠️ IMPORTANT NOTES
### **Data Limitations**
- Uses **simplified Greeks** calculation (assumes 3 DTE by default)
- Option prices may have slight delays (TradingView data refresh)
- Max Pain calculation is **approximation** based on current premiums
- Not all option symbols may be available on TradingView
### **Best Practices**
1. **Verify prices** on your broker platform before trading
2. **Use during market hours** (9:15 AM - 3:30 PM IST) for accurate data
3. **Most effective** 3-5 days before expiry
4. **Combine with price action** and trend analysis
5. **Risk management**: Never risk more than 2% per trade
### **Optimization Tips**
- **Increase strikes** to 9-11 for better Max Pain accuracy
- **Use FUTURES** tracking for liquid indices (NIFTY, BANKNIFTY)
- **Enable debug mode** initially to verify symbols are correct
- **Adjust IV Multiplier** if VIX seems over/underestimated
---
## 🔄 UPDATES & SUPPORT
### **Version 1.0 Features**
✅ Complete option chain display (17 columns)
✅ All 5 Greeks calculation
✅ Max Pain analysis
✅ Put-Call Ratio (PCR) - Overall + Strike-wise
✅ Trading signals (Buy + Sell)
✅ Specific strike recommendations
✅ Risk/Reward assessment
✅ Support for 6 Indian indices
✅ Configurable strikes (5-15)
✅ Dark/Light color schemes
✅ Auto ATM tracking
### **Planned Updates**
🔜 OI (Open Interest) data integration
🔜 Historical Max Pain tracking
🔜 PCR trends and momentum
🔜 Custom alerts for signals
🔜 Multi-expiry analysis
🔜 Volatility smile/skew display
---
## 📖 EDUCATIONAL RESOURCES
### **Understanding Greeks**
- **Delta**: Rate of change in option price vs underlying (0-1 for calls, -1-0 for puts)
- **Gamma**: Rate of change of Delta (highest at ATM)
- **Theta**: Time decay per day (always negative for buyers)
- **Vega**: Sensitivity to volatility changes
- **Rho**: Sensitivity to interest rate changes (less important for short-term)
### **Max Pain Theory**
Max Pain suggests that market makers manipulate prices toward the strike where option buyers lose the most money. While controversial, it has statistical validity in expiry week when:
1. Volume is high
2. Market makers hedge positions
3. Pin risk causes clustering at certain strikes
### **PCR as Sentiment Indicator**
- PCR > 1: More put buying than call buying (bearish)
- PCR < 1: More call buying than put buying (bullish)
- **Contrarian use**: Extreme readings often precede reversals
- **Confirmation use**: With trend for continuation trades
---
## 🎯 WHO IS THIS FOR?
### ✅ **Perfect For:**
- Options traders (all experience levels)
- Premium sellers (credit strategies)
- Directional option buyers
- Intraday option traders
- Swing traders in options
- Risk managers
- Market makers
- Professional traders
### ✅ **Use Cases:**
- Daily options trading on NIFTY/BANKNIFTY
- Weekly expiry strategies
- Monthly expiry positioning
- Volatility trading
- Hedging portfolios
- Greeks-based strategies
- Statistical arbitrage
---
## ⚖️ DISCLAIMER
**This indicator is for educational and informational purposes only.**
- NOT financial advice or recommendation to buy/sell
- Past performance does not guarantee future results
- Options trading involves substantial risk of loss
- Greeks calculations are theoretical models
- Max Pain is not guaranteed to be reached
- Always verify data with your broker
- Use proper risk management and position sizing
- Consult a financial advisor before trading
**The author is not responsible for any trading losses.**
---
## 📞 SUPPORT
For questions, issues, or feature requests:
- Comment below this indicator
- Check TradingView documentation for Pine Script basics
- Review NSE option chain for symbol verification
---
## 🏆 WHY CHOOSE THIS INDICATOR?
### **Comprehensive**
- Most complete options analysis tool on TradingView
- Combines Greeks + Max Pain + PCR + Signals in one
### **Professional**
- Used by professional traders
- Based on proven Black-Scholes model
- Real-time calculations
### **Actionable**
- Specific strike recommendations
- Entry prices displayed
- Clear Buy/Sell signals
- Risk/Reward assessment
### **Customizable**
- Multiple indices supported
- Configurable strikes
- Adjustable parameters
- Flexible positioning
### **Visual**
- Color-coded for easy reading
- Highlighted opportunities
- Chart levels for reference
- Professional table layouts
---
## 🚀 GET STARTED
1. **Add to chart**: Click "Add to favorites" ⭐
2. **Apply to NIFTY or BANKNIFTY** chart
3. **Set expiry date** in settings
4. **Configure strikes** (9 recommended)
5. **Start trading** with professional insights!
---
**Happy Trading! 📊💰**
*If you find this indicator useful, please like, comment, and share!*
*Your feedback helps improve future versions.*
---
**Tags**: #options #greeks #nifty #banknifty #maxpain #pcr #delta #gamma #theta #vega #optionchain #india #nse #trading #signals

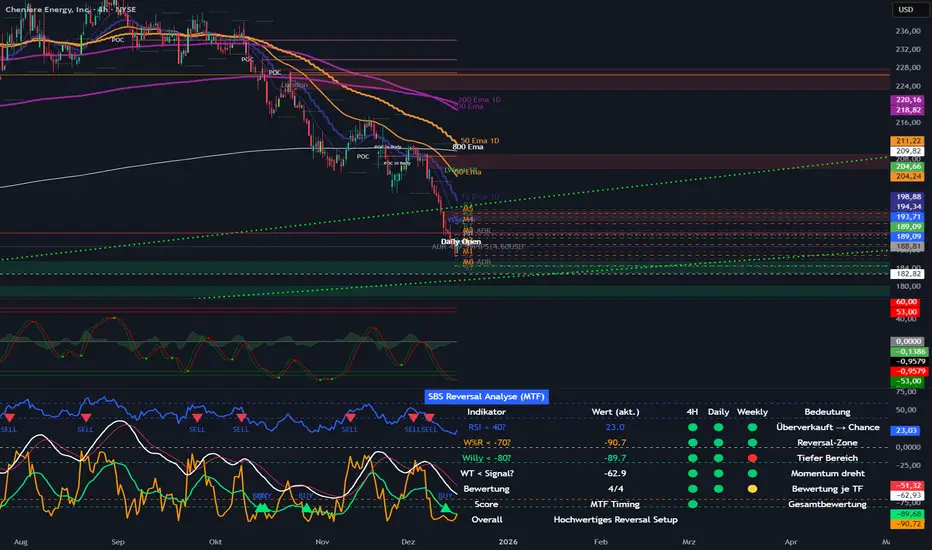
SBS Reversal Engine MTFSBS Reversal Engine (MTF) is a professional multi-timeframe indicator designed to identify high-quality reversal zones across stocks, crypto, and indices.
It combines RSI, Williams %R, a smoothed Williams oscillator ("Willy"), and a proprietary WaveTrend momentum filter to evaluate market conditions across 4H, Daily, and Weekly timeframes.
A visual traffic-light system provides a clear overview of oversold conditions, momentum shifts, and multi-timeframe alignment.
The integrated MTF Score System helps traders focus on high-quality setups where market structure, context, and timing align.
This indicator is an analytical tool and does not constitute financial advice.
© Step Buy Step 2025 – All rights reserved
PDH/PDL (Personal)This TradingView indicator is a technical analysis tool designed to plot the Previous Day High (PDH) and Previous Day Low (PDL) levels with high accuracy. It is specifically engineered for traders who require market boundaries calculated based on the Indian Standard Time (IST) session, ensuring that day breaks are identified precisely at 12:00 AM IST regardless of the exchange's native timezone.

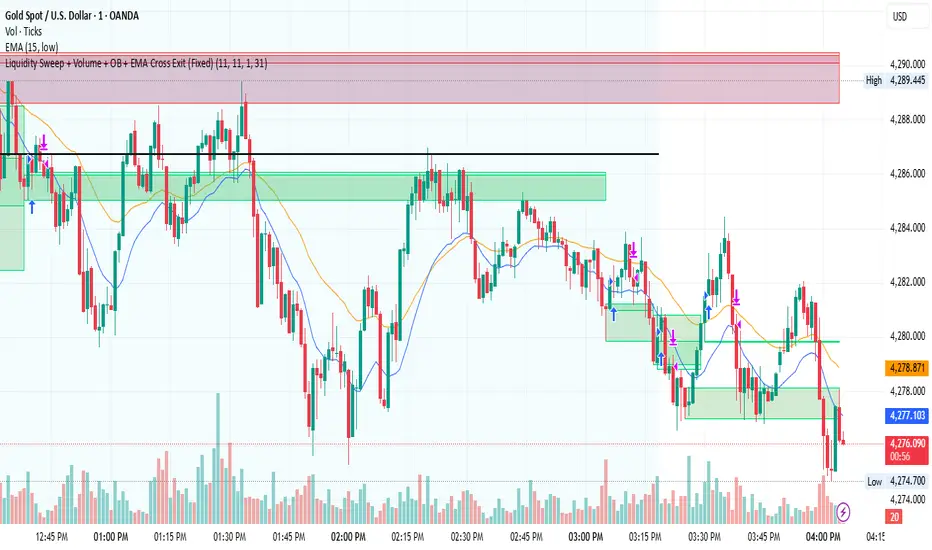
Liquidity Sweep + Volume + OB + EMA Cross Exit This strategy is a smart-money–inspired trading system designed to capture high-probability reversals after liquidity is taken from the market.
It combines liquidity sweeps, volume confirmation, order block validation, and a dynamic EMA-based exit to control risk and let profits run.
Core Concept
Institutions first take liquidity, then move price in the real direction.
This strategy aims to enter after liquidity is swept and price shows confirmation.
1️⃣ Liquidity Sweep Detection
2️⃣ Volume Confirmation
3️⃣ Order Block Identification
4️⃣ EMA Trend Filter (Optional Entry Bias)
5️⃣ Trade Entry Logic
6️⃣ Exit Strategy – EMA Cross Exit
Benefits:
Lets strong trends run
Exits automatically when momentum weakens
Adapts to different market conditions
🛡 Risk & Trade Management
One trade at a time (anti-overtrading logic)
Early exit if trade moves against position after a few bars
Opposite signal forces exit
EMA cross provides trend-based exit
GOLD 5m PA ScalperXAUUSD 5-Minute Price Action Scalper with HTF Confirmation
This Pine Script is a trend-following scalping strategy designed specifically for XAUUSD (Gold) on the 1,3,5-minute timeframe.
Its main goal is to reduce noise and false signals by combining lower-timeframe price action with higher-timeframe (15-minute) structure.
CORE IDEA
Trade only in the direction of the dominant trend and only when price reacts from a strong higher-timeframe Order Block.

Trend + Liquidity Master Trend & Liquidity Master
A Professional All-in-One Trading System combining Dynamic Trend Analysis with Smart Money Liquidity Zones
---
## 🎯 Overview
The Trend & Liquidity Master is a comprehensive trading indicator that merges institutional-grade trend detection with smart money liquidity mapping. Designed for traders who want to align with market structure while identifying high-probability entry zones, this system provides clear visual signals backed by multi-layered confirmation filters.
## ⚡ Core Features
### 📊 **Adaptive Trend Cloud**
- Multi-Algorithm Support: Choose between EMA, SMA, HMA, or RMA for trend calculation
- Volatility-Based Bands: Dynamic ATR bands that expand/contract with market conditions
- Anti-Chop Filter: Maintains trend state during consolidation to reduce false signals
- Visual Clarity: Color-coded cloud system (Green = Bullish, Red = Bearish - customisable)
### 🧱 **Smart Liquidity Zones**
- Supply & Demand Boxes: Automatically identifies institutional support/resistance levels
- Pivot-Based Detection: Uses swing high/low analysis to map liquidity pools
- Dynamic Mitigation: Zones auto-delete when price invalidates them
- Clean Visual Design: Semi-transparent boxes that don't clutter your chart
### 🎯 **Multi-Filter Signal System**
- Volume Confirmation: Optional filter to ensure signals occur on above-average volume
- RSI Screening: Avoid overbought buys and oversold sells (toggleable)
- Trend Alignment: Signals only trigger on confirmed trend changes
- Clear Entry Labels: BUY/SELL markers appear directly on the chart
### 🖥️ **Professional HUD Dashboard**
Real-time market intelligence display showing:
- Trend Bias: Current market direction (Bullish/Bearish)
- Momentum Status: Strength classification (Strong/Neutral/Weak)
- Volume State: Current volume relative to average (High/Low)
- Customizable Position & Styling: Place anywhere on your chart
---
## 🛠️ Customization Options
### **Trend Engine**
- Adjustable MA type and length
- Volatility multiplier for band sensitivity
- Source selection (Close, Open, HL2, etc.)
### **Liquidity Detection**
- Pivot lookback period (sensitivity control)
- Zone extension bars
- Toggle zones on/off independently
### **Signal Filters**
- Enable/disable volume filter
- Enable/disable RSI filter
- Fine-tune to match your trading style
### **Visual Design**
- Custom colors for bullish/bearish/neutral states
- Candle coloring option
- Dashboard styling and positioning
- Adjustable text and UI sizing
---
## 📈 How to Use
1. Identify the Trend: Wait for price to break above the upper band (Bullish) or below the lower band (Bearish)
2. Watch for Signals: BUY labels appear when trend turns bullish with confirmation; SELL labels for bearish turns
3. Confirm with Liquidity: Use Supply/Demand zones as potential entry refinement or profit targets
4. Monitor the HUD: Check momentum and volume states for additional confluence
5. Set Alerts: Built-in alert conditions for automated notifications
---
## 💡 Best Practices
- **Higher Timeframes**: Works best on 15m+ charts for reduced noise
- **Trend Following**: This is a trend-following system—avoid counter-trend trades
- **Multiple Confirmations**: Combine signals with liquidity zones for highest probability setups
- **Risk Management**: Always use proper position sizing and stop losses
---
## 🔔 Alert System
Pre-configured alerts for:
- Long entry signals (Apex Buy Alert)
- Short entry signals (Apex Sell Alert)
- Automatic ticker symbol insertion
---
## 📝 Notes
- Maximum 50 boxes and lines for optimal performance
- Liquidity zones automatically manage themselves (old zones removed)
- All components can be toggled independently
- Compatible with all markets (Forex, Crypto, Stocks, Indices)
---
## 🎨 What Makes This Different?
You get the best of both worlds: smart money zones that show where liquidity sits, combined with clear trend signals that tell you when to act.
---
Ready to trade with institutional-grade market intelligence? Add the Trend & Liquidity Master to your chart today.
---
*Disclaimer: This indicator is for educational and informational purposes only. Past performance does not guarantee future results. Always conduct your own analysis and practice proper risk management.*
