WaveRider [Scalping-Algo]# 📊 TrendPulse Pro - Indicator Guide
## 🎯 What is it?
A clean all-in-one trend tool. Combines 4 smoothed MAs, candlestick patterns & session highlights. No clutter, just signals.
---
## 🔧 Features
### 📈 4 Smoothed Moving Averages
- **21 SMMA** (Cyan) → Fast trend, scalping
- **50 SMMA** (Green) → Swing entries
- **100 SMMA** (Gold) → Medium trend filter
- **200 SMMA** (Red) → Major trend direction
💡 *Price above all = strong bull. Below all = strong bear.*
---
### ⚡ 3 Line Strike Pattern
Rare but powerful reversal signal.
- 🟢 **Bull 3LS** → 3 red candles + 1 big green that closes above first candle
- 🔴 **Bear 3LS** → 3 green candles + 1 big red that closes below first candle
💡 *Best near support/resistance zones.*
---
### 💎 Engulfing Candles
Shows momentum shift.
- 🟢 **Bull Engulf** → Green candle swallows previous red
- 🔴 **Bear Engulf** → Red candle swallows previous green
💡 *Filter with trend direction for better win rate.*
---
### 🕐 Session Highlight
See your trading window clearly.
- Light shade = Pre-session (prep time)
- Darker shade = Active session (go time)
💡 *Default is CME hours. Adjust in settings.*
---
## 📝 Quick Setup
1. Add to chart
2. Pick your timeframe (works on any)
3. Toggle what you need ON/OFF
4. Set your session times
5. Trade with confidence
---
## 🎨 Color Guide
| Element | Default Color | Meaning |
|---------|---------------|---------|
| 21 MA | Cyan | Fast trend |
| 50 MA | Green | Swing trend |
| 100 MA | Gold | Filter |
| 200 MA | Red | Big picture |
| Fill Green | Light Green | Bullish bias |
| Fill Red | Light Red | Bearish bias |
---
## ⚠️ Tips
✅ Use MA stack for trend bias
✅ Wait for patterns AT key levels
✅ Combine with volume
✅ Respect the 200 MA
❌ Don't trade against all MAs
❌ Don't chase every signal
❌ Don't ignore session times
---
## 🚀 Best Practices
**For Scalping:**
- Focus on 21 & 50 MA
- Trade engulfing patterns
- Use 1-5 min charts
**For Swing:**
- Focus on 100 & 200 MA
- Trade 3 Line Strike
- Use 1H-4H charts
---
Made with ☕ by a trader, for traders.
*"Keep it simple. Let price do the talking."*
Параллельный канал

ZenAlgo - ChannelOverview and required chart interaction
This indicator draws a price channel and a volume profile that are both anchored to a user defined swing range. To initialize it, the user must pick two chart timestamps using the script inputs:
Start - the first anchor point (typically one extreme of the move, such as the swing low for an ascending move or the swing high for a descending move).
End - the second anchor point (the opposite extreme of that same move).
After both points are set, the script analyzes the bars between Start and End, fits a sloped channel through that range, builds a volume profile aligned with the channel, and then projects all derived levels forward along the same slope.
Inputs and what they control
Volume area and profile resolution
Width % controls how far the volume profile histogram can extend horizontally. It scales the longest profile bar relative to the Start-End range length.
Volume Area % controls how much of total volume around the profile’s highest volume region is included when computing the value area boundaries.
Style and visibility
Toggles exist for displaying the profile derived levels: LOC , VAH/VAL , pivot labels (HH, HL, LH, LL), breakout shapes, and optional ghost extensions.
Extend lines right decides whether primary lines are truly extended to the right by TradingView’s line extension, or only drawn for the Start-End segment.
Ghost Extend draws dotted, semi transparent projections for a configurable number of future bars when the main lines are not extended.
Deviation levels
Deviation Multiplier and Deviation Levels add symmetric bands above and below the LOC, spaced by a distance derived from the channel height relative to LOC. These bands are projected along the channel slope.
Slope analysis and alerts
The script can evaluate channel "strength" using either angle in degrees or a normalized percent-per-bar slope . The chosen measure is then bucketed into qualitative strength categories that are used only for labeling and alert message context.
Alerts can be enabled for confirmed breakouts and for slope sign changes (bullish to bearish, or bearish to bullish).
How the channel baseline is constructed from Start to End
Once Start is reached, the script begins accumulating bar-by-bar statistics until End is reached:
It tracks the number of bars in the selected range and accumulates an average and a linearly weighted average of closes.
At End, it converts those aggregates into a straight line defined by a start value, an end value, and a per-bar slope across the Start-End period.
Why this works (within the chosen range):
Using a fitted line over the selected segment provides a compact description of directional drift across that range. It will not capture every fluctuation, but it provides a stable reference for projecting "where the middle of the move is" as time advances.
How the channel height is determined and why the borders sit where they do
After computing the baseline slope, the script scans through the selected bars to measure how far price deviated above and below that baseline:
For each bar in the range, it computes the baseline value at that bar index and measures the distance from that baseline to the bar’s high and to the bar’s low.
It finds the maximum upward deviation and the maximum downward deviation.
The baseline is shifted so the lower channel border is aligned to the worst downward deviation, and the total channel height becomes the distance between the worst upward and worst downward deviations.
Why this works (and what it implies):
The resulting channel borders are anchored to the extremes observed in the selected range. That makes the borders a description of the range’s realized "envelope" around the fitted drift.
Because this envelope is derived from past extremes in the chosen window, it is descriptive rather than predictive. When price behavior changes, future price can exceed the historical envelope and will be treated as a breakout.
How the volume profile is built inside the channel
The script constructs a volume profile that is aligned with the sloped channel, not a flat horizontal range:
The channel’s vertical span is divided into the configured number of bins (Layers).
For each bar in the selected range, the script checks which bins are intersected by that bar’s high-low range and adds that bar’s volume to each intersected bin.
It keeps track of the bin with the highest accumulated volume. That bin defines the profile’s maximum-volume region.
Why this works (and what it measures):
Aggregating volume by where price traded within the channel helps identify the areas where the most activity occurred during the selected move.
Using bar range intersection (high-low crossing a bin) is a practical approximation for distributing volume across prices without requiring intrabar volume-at-price data. This approximation can over-attribute volume to multiple bins for wide bars, but it remains consistent across the range.
LOC, VAH, and VAL derivation
LOC (line of control)
The LOC is placed at the center of the highest-volume bin.
The LOC is then drawn as a line from Start to End, following the same slope as the channel baseline.
Interpretation:
LOC represents the most frequently traded zone within the selected channel range, expressed as a sloped level that moves forward with the channel’s drift.
VAH and VAL
Total volume across all bins is computed.
Starting from the highest-volume bin, the script expands upward and downward, accumulating volume until the accumulated fraction exceeds the configured Volume Area %.
The highest included bin boundary becomes VAH, and the lowest included bin boundary becomes VAL.
VAH and VAL are drawn as sloped lines parallel to the channel drift.
Interpretation:
VAH and VAL bound the portion of the channel where the majority of the range’s volume accumulated, based on the chosen percentage.
Relative position of price to these levels can be used as context for whether current trading is occurring in historically high-activity or low-activity parts of the selected move.
Deviation bands around LOC
After LOC is known, the script creates additional parallel bands:
It measures the vertical distance from LOC to the top channel border.
Using that as a base offset, it draws symmetric lines above and below LOC for each deviation level, scaled by the deviation multiplier.
These lines are projected with the same slope as the channel.
Interpretation:
These bands provide repeated "distance markers" above and below LOC in units derived from the selected range’s internal structure.
They are best treated as contextual zones rather than precise targets, because spacing is tied to the chosen Start-End window and its extremes.
Optional projections: Extend right and Ghost Extend
Two projection mechanisms exist:
If Extend lines right is enabled, the main channel borders, LOC, and optionally VAH/VAL and deviation lines are extended using TradingView line extension.
If Extend right is disabled but Ghost Extend is enabled, dotted projections are drawn for a fixed number of future bars from End, including channel borders, LOC, VAH/VAL, and deviation lines.
Interpretation:
Both options visualize where the same fitted structure would land in future bars if slope remains unchanged. They do not update slope unless Start-End selection is changed.
Pivot labels: HH, HL, LH, LL
The script optionally labels local swing points using pivot detection:
A pivot high is confirmed when a high is greater than neighboring highs by the configured left and right bar counts.
A pivot low is confirmed similarly for lows.
New pivot highs are labeled as HH or LH relative to the prior pivot high, and pivot lows as HL or LL relative to the prior pivot low.
The logic includes a reset behavior after a new LL or HH to reduce chaining ambiguity across regime shifts.
Interpretation:
These labels provide local structure context that can be compared to the channel’s direction and to whether price is interacting with channel borders or profile levels.
Breakout detection on channel borders
Once End is set, the channel is considered active and the script evaluates each new bar against the channel borders at that bar index:
It computes the current top and bottom border values for the present bar by advancing from the Start baseline with the fitted slope and channel height.
A potential breakout is marked on the first bar that crosses above the top border (or below the bottom border), using a close-based crossing test against the prior bar’s border value.
After a potential breakout, the script waits for confirmation:
For an upside breakout, confirmation occurs only if price remains above the top border and then closes higher than the potential breakout close.
For a downside breakout, confirmation occurs only if price remains below the bottom border and then closes lower than the potential breakout close.
If price re-enters back inside the border before confirmation, the pending breakout state is canceled.
Interpretation:
The two-step logic distinguishes an initial border cross from follow-through. It aims to reduce cases where a single bar spikes outside the channel and immediately returns.
The confirmation test is still close-based and does not consider intrabar excursions beyond the channel, so it is sensitive to candle closes rather than wicks.
Alerts included by the script
Confirmed breakout up or down can trigger alerts and corresponding alertconditions, aligned to the confirmed state described above.
Slope sign change alert triggers when the computed slope (based on the last selected Start-End range) flips sign compared to the previously computed slope. This is a re-selection or re-computation event rather than a continuous recalculation.
How to interpret the plotted elements together
A practical way to read the indicator is to separate it into three layers of information:
Channel structure
Top and bottom borders describe the fitted envelope of the selected range.
The slope indicates the drift direction implied by that selection.
Activity structure inside the channel
LOC is the highest-activity region within the selected range, projected along drift.
VAH and VAL bound the configured fraction of volume around the activity center.
Deviation bands give repeated distance zones around LOC.
Event markers
Pivot labels show local swing structure.
Breakout markers highlight border crosses and confirmed follow-through.
How to best use this indicator
Selecting Start and End effectively
Choose Start and End that represent a coherent swing segment where you want the channel and profile to describe that move.
Avoid mixing multiple regimes (for example, including both a strong trend and a later choppy distribution) unless that is explicitly what you want the profile to summarize.
If the selected window is extremely long, the script limits processing to recent data due to a hard cap (it warns when the range exceeds 10,000 bars and uses only the most recent subset).
Using LOC, VAH, and VAL for context
Treat LOC as the "most traded" zone of the selected move, projected forward.
Treat VAH and VAL as boundaries of the selected move’s high-activity region. Price acceptance inside VAH-VAL and excursions outside that band can be interpreted as trading in higher-activity versus lower-activity zones of the selected move.
Using breakouts
A potential breakout is an early warning that the historical envelope is being exceeded on a closing basis.
A confirmed breakout indicates follow-through beyond the initial breakout close while remaining outside the channel border.
Combining with pivot labels
Compare HH/HL sequences to the channel slope to understand whether local structure aligns with the selected drift.
Pivot labels can also help you decide when the current Start-End selection is no longer representative and should be refreshed.
Added value over other free indicators
The volume profile is constructed along a sloped channel , not a flat horizontal range, so the distribution is expressed in the same coordinate frame as the selected drift.
LOC, VAH, and VAL are therefore projected parallel to the channel , providing moving reference levels tied to the chosen swing segment rather than static horizontal bands.
Breakout logic uses a two-step potential and confirmation mechanism, which separates first border crossings from subsequent follow-through conditions.
Disclaimers and where the indicator can fall short
Results depend heavily on Start and End selection. Different anchor points can produce materially different slope, channel height, and profile levels.
The volume profile uses candle range intersection to distribute volume across bins. Large range candles can contribute volume to many bins, which may broaden the apparent distribution.
The channel borders are based on extremes within the selected range. If market volatility expands, price can exceed the envelope frequently and produce repeated breakout states.
Breakout detection is close-based. Wick-only excursions beyond borders are not treated as breakouts unless the close crosses the border.
Very large ranges may be truncated for processing due to the script’s internal bar limit, which changes what data is actually summarized.

Power Hour Trendlines [LuxAlgo]The Power Hour Trendlines indicator is based on Power Hours detection, and includes up to three displayed trendlines derived from the closing prices of all the bars within the last user-selected Power Hours.
Users can edit the time of Power Hours, choose how many sessions to take into account, enable or disable any trendlines, and change their colors.
🔶 USAGE
The Power Hour is defined as the last hour of the trading session and is set by default from 3:00 p.m. to 4:00 p.m. New York time. During this period, volume and volatility enter the market. Traders using higher timeframes may use this period to enter or exit positions by placing MOC (Market on Close) orders.
This tool works under the hypothesis that prices made during power hours (periods with high trading activity) are more relevant when used for the construction of trendlines.
An initial trendline is fit using linear regression; prices from power hours located above this initial fit are used for the upper trendline, while the ones below the fit are used for the lower one.
As with any trendline, traders can analyze the slope to determine the market's direction:
Positive slope: The market is trending up.
Negative slope: The market is trending down.
No slope: The market is trending sideways.
As we can see in the image, Nasdaq and Bitcoin are clearly in downtrends, gold is clearly in an uptrend, and the euro/U.S. dollar is in a sideways market over the last visible sessions.
As you can see, the trend lines may or may not be parallel to each other. The wider the area, the more volatile the data. The narrower the area, the less volatile the data. Let's look at an example.
In the image, the Dow30 and the euro/U.S. dollar have opposite behaviors. The volatility above the middle trendline is growing in the first case but shrinking in the second. In both cases, the volatility in the bottom area seems steady, so there are no big surprises there.
Traders can adjust the number of sessions for calculations, making the tool ideal for analyzing price behavior over different time frames.
As the image shows, we can clearly see how the market behaves over different time periods. XLY has been moving down over the last 10, 20, and 40 sessions, with a steeper decline over shorter periods. However, it has been moving sideways over the last 70 sessions.
One of the main uses of trendlines is to provide key support and resistance. In the image, SPY is shown with trendlines over the last 20 sessions. These lines provide excellent reference points for trading and observing price behavior in those areas, such as whether prices are accepted or rejected, which may trigger a response from other traders.
🔹 Not Allowed Timeframes
For obvious reasons, timeframes larger than 1H are not allowed. The Power Hour is defined as the last hour of the trading session. The tool will display a warning message if the timeframe is longer than 60 minutes.
🔶 SETTINGS
Power Hour (NY Time): Choose a custom Power Hour in New York time
Sessions Memory: Select how many Power Hours to take into account for calculations.
🔹 Style
Top: Enable or disable the top line and choose the line and background colors.
Middle: Enable or disable the middle line and choose the line color.
Bottom: Enable or disable the bottom line and choose the line and background colors.
Background: Enable or disable the background color for top and bottom lines.

Institutional Flow X-Ray [Blk0ut]Introduction
In the world of quantitative trading, volume is often described as the "fuel" of the market. However, standard volume bars have a major flaw: they show you how much changed hands, but they don't tell you who was in control.
The Institutional Flow X-Ray is designed to solve this opacity problem. It looks "under the hood" of every candle to visualize the intent of the Smart Money participants. By combining Volume Price Analysis (VPA), Wyckoff Logic, and Volatility Compression into a single interface, this tool helps traders identify when institutions are quietly accumulating positions (Absorption) before a major expansion occurs.
How It Works: The Logic
This indicator is not a simple moving average crossover. It aggregates four distinct quantitative models into one composite view:
1. Institutional Flow (The Histogram) Instead of just looking at whether price closed up or down, we calculate the "Intra-Bar Delta." We measure where the price closed relative to the high-low range of that specific candle, weighted by the volume.
• The Result: A smoothed momentum oscillator that reveals the internal strength of the trend.
• Gradient Coloring: The bars use a 4-color gradient system. Bright Green/Red indicates accelerating momentum, while Darker Green/Red indicates exhaustion or a pullback is likely.
2. Stealth Absorption (The "Gold" Signal) This is based on Wyckoff’s Law of Effort vs. Result. The script scans for a specific anomaly: Volume is significantly higher than average (>2.0x), but Price Range is significantly lower than average.
• Why this matters: When you see high volume but no price movement, it often means a large entity is absorbing all available liquidity (Iceberg Orders). These bars are painted GOLD.
3. Volatility Compression (The "Squeeze" Dots) Markets move in cycles of Expansion and Compression. This module compares the width of Bollinger Bands against Keltner Channels.
• The Logic: When the Bollinger Bands contract inside the Keltner Channels, the market is like a coiled spring. This measures potential energy.
4. Relative Strength (The Alpha Line) Institutional capital rarely flows into underperforming assets. The script automatically compares your current ticker against a benchmark (SPY for Stocks, BTC for Crypto, DXY for Forex).
• The Logic: If the benchmark is dropping, but your ticker is holding steady (Rising Blue Line), it shows Relative Strength, a key footprint of institutional support.
________________________________________
Visual Guide & Usage
The Histogram (Flow & Signals)
• Green Gradients: Buyers are in control.
• Red Gradients: Sellers are in control.
• GOLD Bars (Absorption): Be alert. A major player is active. If this happens at Support, it is a high-probability Accumulation setup.
• WHITE Bars (Alpha Signal): The "Triple Confluence." This occurs when we have (1) Absorption + (2) Bullish Flow + (3) Relative Strength all activating at once. This is the strongest signal in the system.
The Volatility Map (Center Dots) The dots running along the zero line tell you the state of market energy:
• 🔴 Red (Extreme Squeeze): Ratio < 0.7. Massive energy build-up. Expect an explosive move soon.
• 🟠 Orange (Squeeze): Ratio < 1.0. Standard pre-breakout compression.
• ⚪ Gray (Normal): Standard volatility.
• 🔵 Blue (Expansion): The move is underway. Volatility is expanding.
The Heads-Up Dashboard A professional table in the corner provides real-time quantitative data so you don't have to guess:
• Inst. Flow: The raw score (0-100).
• Volatility: Tells you exactly which phase the market is in (Squeeze vs. Expansion).
• Rel. Strength: Tells you if you are "Outperforming" or "Lagging" the benchmark.
________________________________________

ATR Bands (MA Distance)ATR Bands (MA Distance) plots volatility-based bands at a multiple of ATR away from a selected moving average.
Unlike percentage envelopes or standard deviation bands, this indicator measures distance from the moving average using ATR, representing the market’s normal “breathing range” rather than statistical probability.
Key Features
The center line is a selectable moving average (EMA, SMA, RMA/Wilder, or WMA).
Upper and lower bands are calculated as:
Moving Average ± ATR × Multiplier
Band width automatically adapts to changing market volatility.
Designed for consistent use across different markets and timeframes without parameter re-optimization.
Non-repainting: all values are calculated only from confirmed historical bars.
Intended Use
ATR Bands (MA Distance) is best used as a context and preparation tool , not as a direct entry or exit signal.
Typical use cases include:
Identifying areas where price is extended relative to its recent volatility.
Visualizing normal vs. stretched price distance from the moving average.
Supporting range-based analysis or trade preparation when combined with other indicators (e.g., oscillators).
Important Notes / How NOT to Use
This indicator does NOT generate buy or sell signals by itself .
Touching or crossing a band does not imply an automatic reversal.
In strong trending markets, price may stay outside the bands for extended periods.
ATR Bands should not be interpreted as overbought/oversold levels on their own.
This indicator does NOT repaint. Once a bar is closed, its values will not change.
For best results:
Use ATR Bands as a preparation zone, then wait for confirmation from your own entry logic.
Disable or ignore band-based mean-reversion ideas during strong trend conditions.
Concept Summary (Short)
ATR Bands (MA Distance) visualize how far price has moved from its moving average in terms of volatility, without repainting and without relying on percentage deviation or statistical assumptions.
Optional Short Description (Preview)
Volatility-based, non-repainting ATR bands plotted at a distance from a moving average.
Designed for market context and trade preparation — not standalone signals.

CCI 34 IndicatorThis tool plots the 34 period CCI to help study momentum and price strength versus its recent average.
It is meant only for educational analysis and should not be treated as a buy/sell signal or investment advice.
Traders must use their own judgment, risk management, and additional tools before making decisions.
Short Explanation of Levels
CCI > +100
= strong upside momentum; price is trading above its recent average and demand is dominant.
CCI < −100
= strong downside momentum; price is below its recent average and selling pressure is dominant.

HMA 34 Dual-Fractal Projections - VdubusVdubus MacD Divergence Trend Break Signal Generator :Here:-
HMA 18 Dual-Fractal Projections
Overview
The HMA 18 Dual-Fractal Projections is a technical analysis tool designed to identify market structure and potential breakout patterns by analyzing the pivots of a Hull Moving Average (HMA).
Unlike standard trendline indicators that struggle to balance "big picture" trends with immediate price action, this indicator utilizes a Dual-Fractal approach. It simultaneously calculates two separate timelines—Macro and Micro—to visualize both the dominant channel and the developing chart patterns (such as wedges or triangles) in real-time.
Visual Guide
The indicator plots three key elements on the main chart:
The HMA Line (Blue): A smooth, fast-acting moving average (default length 34) that serves as the baseline for all calculations.
Macro Structure (Solid, Thick Lines):
Red (Solid): Major Resistance.
Green (Solid): Major Support.
Purpose: Identifies the long-term trend channel. These lines react slowly and filter out noise.
Micro Structure (Dashed, Thin Lines):
Red (Dashed): Immediate Resistance.
Green (Dashed): Immediate Support.
Purpose: Identifies the short-term market structure. These lines react quickly to show forming wedges, triangles, or flags.
How It Works
The indicator applies a "Pivot High/Low" algorithm directly to the HMA data rather than raw price data. This filters out candle wicks and volatility, ensuring lines are drawn based on established momentum shifts.
Layer 1 (Macro): Uses a large "Lookback" period (default 44 bars) to find significant peaks and valleys. It connects the most recent major pivot to the previous one, projecting a line forward to show where the major trend channel lies.
Layer 2 (Micro): Uses a small "Lookback" period (default 10 bars) to find local peaks and valleys. This allows you to see how price is behaving within the larger channel.
Settings & Configuration
HMA Settings
HMA Length: The length of the Hull Moving Average.
Default: 34 (Matches the "visually pleasing" setting from recent testing).
Note: Set to 18 for a faster, more reactive baseline (scalping).
Layer 1: Macro (Big Channel)
Macro Lookback: Determines how many bars must pass before a peak is confirmed.
Default: 44. High values find broad, established channels.
Max Macro Lines: How many historical lines to keep on the chart.
Default: 1 (Keeps the chart clean, showing only the current structure).
Extend Macro Lines: Projects the lines infinitely to the right to predict future support/resistance zones.
Layer 2: Micro (Current Pattern)
Micro Lookback: A lower sensitivity setting to catch immediate structure.
Default: 10. Low values will pinpoint the exact boundaries of small wedges or flags forming right now.
Trading Strategy & Interpretation
1. The "Squeeze" (Wedge Identification) This is the primary use case.
Look for scenarios where the Macro Lines (Solid) are wide/parallel, but the Micro Lines (Dashed) are rapidly converging (pointing towards each other).
This indicates that while the main trend is intact, momentum is compressing. A breakout is imminent where the dashed lines intersect.
2. Trend Channels
When both Solid and Dashed lines are roughly parallel and sloping in the same direction, the trend is healthy and strong. Price is respecting both the short-term and long-term momentum.
3. Divergence / Early Reversal Warning
If the Macro Line is sloping UP, but the Micro Line starts sloping DOWN (crossing inside), it indicates a loss of momentum and a potential reversal before the price actually breaks the major trendline.
===========================================================================
2. Micro/Macro Cross Alert
A new input, Enable Micro/Macro Cross Alert, has been added under the "Alerts & Features" section.
This alert condition is triggered when the momentum of the Micro Structure exceeds the momentum of the Macro Structure, which is a high-probability signal for a breakout:
Bullish Alert: The Micro High (dashed red line) crosses above the Macro High (solid red line).
Bearish Alert: The Micro Low (dashed green line) crosses below the Macro Low (solid green line).
To set up the actual alert on your chart:
Right-click on the chart.
Select "Add alert on HMA 34 Dual-Fractal Projections".
In the Condition dropdown, select the indicator's name.
For the main alert criteria, choose "Any alert()".
Select your preferred alert actions (e.g., notification, email).

Ben D"s IndicatorIt Auto Draws and Detects, Channels draws buy and sell signals based on over bought, oversold and a few other indicators. It works on all time frames! Enjoy! Leave a comment if you like it.

Simple Price ChannelSimple Price Channel
This indicator plots a basic volatility-based channel around a moving average.
Features:
Midline using Simple Moving Average (SMA)
Upper & lower bands using ATR or true range
Channel fill for easy trend visualisation
This script is designed for educational and analytical purposes only.
It does not provide signals, alerts, or financial advice.

AG Pro Dynamic Channels PremiumAG Pro Dynamic Channels Premium
The Gold Standard in Automated Market Structure.
AG Pro Dynamic Channels Premium is the culmination of advanced algorithmic development, designed specifically for professional traders who refuse to compromise on chart clarity.
While standard indicators flood your screen with noise, this Premium edition employs a proprietary "Smart Filtering Engine" to identify, validate, and project only the most statistically significant support and resistance channels. It transforms chaos into a clear, actionable roadmap.
🏆 Why Go Premium?
This is not just an update; it is a complete overhaul of the trend detection logic.
1. 🧠 Smart Quality Control (Exclusive) The core difference in the Premium version is its ability to "think" before it draws.
Volatility Filtering: The script analyzes the slope of every potential trend. It automatically rejects unsustainable "pump/dump" moves and flat ranges, keeping only tradeable structures.
Wick Exclusion Logic: An advanced algorithm that ignores extreme volatility spikes (wicks), drawing channels based on candle body consolidation for higher precision.
2. 🏷️ Intelligent Labeling System Instant situational awareness. Every channel is auto-labeled (e.g., Mj Ext Up), so you know exactly which market phase (Major or Minor, Internal or External) you are trading in without guessing.
3. ⚡ Zero-Lag Optimization The code has been refactored for maximum efficiency, ensuring faster load times and smoother performance even on lower timeframes.
💎 Key Features
Dual-Layer Architecture: Simultaneously tracks Major Trends (for bias) and Minor Trends (for entries).
Dynamic Support & Resistance: The dotted midline acts as a high-probability reversal zone.
Institutional Grade Alerts: Fully customizable alerts for Breakouts and Reactions, complete with metadata for automated trading systems.
Auto-Tuning: Default settings are optimized for a balance of sensitivity and reliability, but fully customizable for specific assets (Crypto, Forex, Indices).
⚙️ Methodology (How It Works)
To comply with TradingView House Rules, here is the technical logic behind the script:
Pivot Detection: The script scans price action using a highly sensitive lookback period to find raw Pivot Highs and Lows.
Structure Mapping: It processes these points to define the Market Structure (HH, LL, LH, HL).
Validation Layer: Before rendering, the Smart Filter calculates the channel's duration and slope coefficient. If the channel is too short or too steep (violating the user-defined Max Slope threshold), it is discarded as "Market Noise."
Projection: Validated channels are drawn with dynamic extensions and fill zones.
🔒 How to Get Access
This is an Invite-Only script. Access is restricted to authorized users.
To Request Access: Please send me a private message on TradingView or check the links in my profile signature for more information.
Existing Members: If you have active access, the script will load automatically.
Disclaimer: Technical analysis tools are for educational purposes. Past performance does not guarantee future results.
Developed by Ali Gurtuna (AG Pro Series).

Kernel Channel [BackQuant]Kernel Channel
A non-parametric, kernel-weighted trend channel that adapts to local structure, smooths noise without lagging like moving averages, and highlights volatility compressions, expansions, and directional bias through a flexible choice of kernels, band types, and squeeze logic.
What this is
This indicator builds a full trend channel using kernel regression rather than classical averaging. Instead of a simple moving average or exponential weighting, the midline is computed as a kernel-weighted expectation of past values. This allows it to adapt to local shape, give more weight to nearby bars, and reduce distortion from outliers.
You can think of it as a sliding local smoother where you define both the “window” of influence (Window Length) and the “locality strength” (Bandwidth). The result is a flexible midline with optional upper and lower bands derived from kernel-weighted ATR or kernel-weighted standard deviation, letting you visualize volatility in a structurally consistent way.
Three plotting modes help demonstrate this difference:
When the midline is shown alone, you get a smooth, adaptive baseline that behaves almost like a regression moving average, as shown in this view:
When full channels are enabled, you see how standard deviation reacts to local structure with dynamically widening and tightening bands, a mode illustrated here:
When ATR mode is chosen instead of StdDev, band width reflects breadth of movement rather than variance, creating a volatility-aware envelope like the example here:
Why kernels
Classical moving averages allocate fixed weights. Kernels let the user define weighting shape:
Epanechnikov — emphasizes bars near the current bar, fades fast, stable and smooth.
Triangular — linear decay, simple and responsive.
Laplacian — exponential decay from the current point, sharper reactivity.
Cosine — gentle periodic decay, balanced smoothness for trend filters.
Using these in combination with a bandwidth parameter gives fine control over smoothness vs responsiveness. Smaller bandwidths give sharper local sensitivity, larger bandwidths give smoother curvature.
How it works (core logic)
The indicator computes three building blocks:
1) Kernel-weighted midline
For every bar, a sliding window looks back Window Length bars. Each bar in this window receives a kernel weight depending on:
its index distance from the present
the chosen kernel shape
the bandwidth parameter (locality)
Weights form the denominator, weighted values form the numerator, and the resulting ratio is the kernel regression mean. This midline is the central trend.
2) Kernel-based width
You choose one of two band types:
Kernel ATR — ATR values are kernel-averaged, producing a smooth, volatility-based width that is not dependent on variance. Ideal for directional trend channels and regime separation.
Kernel StdDev — local variance around the midline is computed through kernel weighting. This produces a true statistical envelope that narrows in quiet periods and widens in noisy areas.
Width is scaled using Band Multiplier , controlling how far the envelope extends.
3) Upper and lower channels
Provided midline and width exist, the channel edges are:
Upper = midline + bandMult × width
Lower = midline − bandMult × width
These create smooth structures around price that adapt continuously.
Plotting modes
The indicator supports multiple visual styles depending on what you want to emphasize.
When only the midline is displayed, you get a pure kernel trend: a smooth regression-like curve that reacts to local structure while filtering noise, demonstrated here: This provides a clean read on direction and slope.
With full channels enabled, the behavior of the bands becomes visible. Standard deviation mode creates elastic boundaries that tighten during compressions and widen during turbulence, which you can see in the band-focused demonstration: This helps identify expansion events, volatility clusters, and breakouts.
ATR mode shifts interpretation from statistical variance to raw movement amplitude. This makes channels less sensitive to outliers and more consistent across trend phases, as shown in this ATR variation example: This mode is particularly useful for breakout systems and bar-range regimes.
Regime detection and bar coloring
The slope of the midline defines directional bias:
Up-slope → green
Down-slope → red
Flat → gray
A secondary regime filter compares close to the channel:
Trend Up Strong — close above upper band and midline rising.
Trend Down Strong — close below lower band and midline falling.
Trend Up Weak — close between midline and upper band with rising slope.
Trend Down Weak — close between lower band and midline with falling slope.
Compression mode — squeeze conditions.
Bar coloring is optional and can be toggled for cleaner charts.
Squeeze logic
The indicator includes non-standard squeeze detection based on relative width , defined as:
width / |midline|
This gives a dimensionless measure of how “tight” or “loose” the channel is, normalized for trend level.
A rolling window evaluates the percentile rank of current width relative to past behavior. If the width is in the lowest X% of its last N observations, the script flags a squeeze environment. This highlights compression regions that may precede breakouts or regime shifts.
Deviation highlighting
When using Kernel StdDev mode, you may enable deviation flags that highlight bars where price moves outside the channel:
Above upper band → bullish momentum overextension
Below lower band → bearish momentum overextension
This is turned off in ATR mode because ATR widths do not represent distributional variance.
Alerts included
Kernel Channel Long — midline turns up.
Kernel Channel Short — midline turns down.
Price Crossed Midline — crossover or crossunder of the midline.
Price Above Upper — early momentum expansion.
Price Below Lower — downward volatility expansion.
These help automate regime changes and breakout detection.
How to use it
Trend identification
The midline acts as a bias filter. Rising midline means trend strength upward, falling midline means downward behavior. The channel width contextualizes confidence.
Breakout anticipation
Kernel StdDev compressions highlight areas where price is coiling. Breakouts often follow narrow relative width. ATR mode provides structural expansion cues that are smooth and robust.
Mean reversion
StdDev mode is suitable for fade setups. Moves to outer bands during low volatility often revert to the midline.
Continuation logic
If price breaks above the upper band while midline is rising, the indicator flags strong directional expansion. Same logic for breakdowns on the lower band.
Volatility characterization
Kernel ATR maps raw bar movements and is excellent for identifying regime shifts in markets where variance is unstable.
Tuning guidance
For smoother long-term trend tracking
Larger window (150–300).
Moderate bandwidth (1.0–2.0).
Epanechnikov or Cosine kernel.
ATR mode for stable envelopes.
For swing trading / short-term structure
Window length around 50–100.
Bandwidth 0.6–1.2.
Triangular for speed, Laplacian for sharper reactions.
StdDev bands for precise volatility compression.
For breakout systems
Smaller bandwidth for sharp local detection.
ATR mode for stable envelopes.
Enable squeeze highlighting for identifying setups early.
For mean-reversion systems
Use StdDev bands.
Moderate window length.
Highlight deviations to locate overextended bars.
Settings overview
Kernel Settings
Source
Window Length
Bandwidth
Kernel Type (Epanechnikov, Triangular, Laplacian, Cosine)
Channel Width
Band Type (Kernel ATR or Kernel StdDev)
Band Multiplier
Visuals
Show Bands
Color Bars By Regime
Highlight Squeeze Periods
Highlight Deviation
Lookback and Percentile settings
Colors for uptrend, downtrend, squeeze, flat
Trading applications
Trend filtering — trade only in direction of the midline slope.
Breakout confirmation — expansion outside the bands while slope agrees.
Squeeze timing — compression periods often precede the next directional leg.
Volatility-aware stops — ATR mode makes channel edges suitable for adaptive stop placement.
Structural swing mapping — StdDev bands help locate midline pullbacks vs distributional extremes.
Bias rotation — bar coloring highlights when regime shifts occur.
Notes
The Kernel Channel is not a signal generator by itself, but a structural map. It helps classify trend direction, volatility environment, distribution shape, and compression cycles. Combine it with your entry and exit framework, risk parameters, and higher-timeframe confirmation.
It is designed to behave consistently across markets, to avoid the bluntness of classical averages, and to reveal subtle curvature in price that traditional channels miss. Adjust kernel type, bandwidth, and band source to match the noise profile of your instrument, then use squeeze logic and deviation highlighting to guide timing.

MC3 Pro Ultra e10Al-Brooks style MC3/Thrust signals with smart gating: EMA, Wilder ADX/DI, Consolidation, BO+FT, Z-score, Volume, RSI div, HTF EMA, Structure, OR/Blackout, Smart Cooldown. Non-repainting.
Full Description (for the main page)
MC3 Pro Ultra — Invite-Only (Al Brooks–inspired)
A high-discipline entry tool for 3-bar micro-channels (MC3) and optional 1-bar thrusts (MC1). Signals are filtered by a layered “gate” system: EMA side/slope/distance, Wilder ADX/DI, Consolidation (Box, BB<KC, Efficiency Ratio), Breakout+Follow-Through (BO+FT), TR Z-score expansion, Volume (mild/strict), true RSI divergence, HTF EMA (side/slope/strict), Market Structure (HH/HL vs LH/LL with optional BOS), Liquidity sweep guard, Open Range gate, Blackout windows (news) and Smart Cooldown v2.
Everything is non-repainting (evaluated on bar close or using closed higher-TF values).
What it does
MC3 (3-bar micro-channel) & Thrust (MC1) entries in both directions.
Auto regime: dynamically tightens thresholds in chop and relaxes them in trend.
BO+FT confirm: bar-3 must close beyond prior H/L by X points and near the extreme; optional follow-through (no immediate pullback).
Z-Score (TR): requires statistical range expansion (any bar inside the MC3).
EMA filter: side rule (All 3 / Any 2 / Last), slope, and max ATR distance.
Wilder ADX/DI: strength/rend bias; optional DI dominance.
Consolidation filter: Box+ATR (with break confirmation), Squeeze (BB<KC), or ER (Efficiency Ratio).
Volume gate: mild (above SMA×mult) or strict (3-bar rising).
True RSI divergence: pivot-based; blocks when divergence contradicts direction.
HTF EMA (non-repainting): side/slope/strict from a higher timeframe using closed bars.
Market Structure: longs only in HH/HL, shorts only in LH/LL; optional fresh BOS.
Liquidity Sweep guard: block-against or require-with sweep.
Open Range gate: require OR breakout before entries (optional).
Blackout windows: disable signals during macro/news windows.
Smart Cooldown v2: EMA-stretch + clustering penalty to avoid over-trading.
Retest mode (visual): after a signal, watch for a pullback to prev H/L or an EMA±ATR band.
Panel & Debug: status panel (regime, ADX, HTF, CONS, Z/TR, score, gates) + debug reasons for blocked signals.
R overlay: draws entry/stop/targets and an approximate position size.
Non-repainting: uses barstate.isconfirmed and closed HTF values. Signals print on bar close.
Presets
NQ A+ (2m/5m) – fast trend bias. BO+FT & Z-score on, Volume mild, DI dominance on, HTF strict.
NQ Pullback-safe (5m) – more conservative, higher min score & BO/Z thresholds.
ES 5m – balanced default.
(You can also use Custom and tweak only 2–3 knobs at a time.)
Suggested markets/timeframes: CME index futures (NQ/ES), 2m/5m/15m. Works on FX/indices/crypto with sensible retuning.
How to read signals
Green/Red arrows mark confirmed MC3 or Thrust entries (printed after bar closes).
Label shows S=Score and THR if the thrust override triggered.
Panel (top-right) shows: Regime (TREND/CHOP), ADX (prev closed bar optional), HTF (side/slope), Consolidation mode, OR status, current Z/TR vs threshold, Score≥, and quick Gates (✓/✗) for long/short.
Debug (optional, last bar): concatenated reasons why a signal did not pass (e.g., ).
Retest mode places “RT” markers when price pulls back to the chosen retest source.
Key inputs (high-level)
Definition: MC3 (color / close-to-close / micro-channel HL / combo), optional Thrust override.
EMA: side rule, slope, max ATR distance (with soft scoring).
ADX/DI: Wilder ADX len/threshold, optional DI dominance.
Consolidation: Box+ATR (with min breaks & confirm), Squeeze (BB<KC), ER.
BO+FT: min points beyond prior H/L, close% near extreme, “no-pullback” option.
Z-Score: TR Z-score length & min threshold.
Volume: mild (SMA×mult) or strict (3-bar rising).
RSI divergence: pivot L/R, max lookback age.
HTF: timeframe/length, rule (Side only / Slope only / Strict).
Structure gate: pivot L/R, optional BOS with max age.
Sweep guard: Off / BlockAgainst / RequireWith.
Open Range: session window + “require breakout” toggle.
Blackout: one or two session windows (e.g., FOMC/CPI).
Smart Cooldown v2: base cooldown, EMA-stretch bonus, cluster penalty.
Alerts
Comes with alertconditions for Bull/Bear signals.
Optional JSON payload (direction, score, preset, regime, price, est. R, symbol, timeframe) for webhook-based managers (auto-filtering or auto-sizing).
How to set: Add alert on this indicator → choose condition “Bull MC3/Thrust” or “Bear MC3/Thrust” → Once-per-bar-close → webhook (optional).
Best practices
In trend: keep Auto regime ON; you can slightly lower min score / Z / BO.
In chop: raise min score (+1~2), use Volume strict + DI dominance, increase Z and close% thresholds, optionally require OR breakout.
Retest entries: enable “Retest mode” to get better fills (prev H/L or EMA band).
HTF Strict + Structure gate will materially improve selectivity (fewer trades, higher quality).
Avoid trading during Blackout windows (macro releases, roll).
Respect Smart Cooldown to prevent clustering and revenge trades.
Disclaimers
This is not financial advice. Backtest/forward-test before risking capital.
No indicator guarantees win rate or profits; use stops and position sizing.
Invite-Only access at the author’s discretion. Redistribution is prohibited.
Credits
Inspired by Al Brooks methodology (micro-channels, breakouts, trend vs chop context) and classic Wilder ADX/DI.
Auto Channel [SciQua]Auto Channel
Purpose
Auto Channel finds the single best parallel price channel from recent price action and keeps it updated in real time. It uses ZigZag pivots to build candidate channels, scores each candidate for quality, then plots the winner. When price closes outside the channel, the script flags a breakout and can fire alerts.
How it works
1. ZigZag pivots
The script uses TradingView’s TradingView/ZigZag/7 library to generate a stream of swing highs and lows based on a percentage reversal threshold and a leg depth. These pivots are the only points the channel logic evaluates, which keeps the search fast and focused on structure rather than noise.
2. Channel candidates
From the most recent pivots, the script forms all combinations of two swing highs and two swing lows.
It computes a slope for the high line and a slope for the low line and requires that they be nearly parallel within a user-defined tolerance.
3. Quality scoring and selection
For every valid candidate, the script checks the recent pivot segments against the trial channel and computes:
Inside ratio: fraction of tested pivots that sit fully inside the channel after applying the tolerance buffer.
Violation sum: total magnitude of the breaches for any pivots outside the channel.
Current width: distance between upper and lower lines at the current bar.
The “best” channel is chosen by:
1. highest inside ratio
2. then widest current width
3. then smallest violation sum
4. Plot and projection
The upper and lower lines are anchored to the chosen pivot pairs and extend to the left. The script also projects each line to the current bar to compute the live upper and lower channel prices. Those levels drive the breakout checks and alerts.
5. Breakouts and alerts
A breakout is detected when the bar closes above the projected upper line or closes below the projected lower line, after applying the tolerance buffer. Triangle markers highlight fresh breakouts, and you can enable alert conditions to automate notification or strategy handoff.
Inputs:
ZigZag
Price deviation for reversals (%)
Default 0.2. Larger values produce fewer, larger swings. Smaller values produce more, smaller swings.
Pivot legs
Default 2. Controls the lookback depth ZigZag uses to confirm pivots.
ZigZag Color
Visual only.
Tip: If you are not seeing a stable channel, increase the ZigZag percentage to reduce minor swings.
Channel search
Number of recent pivots to consider
Default 12. Higher values search more history and try more channel combinations. Lower values make the search faster and more reactive.
Max slope difference for parallel
Default 0.0005. Maximum allowed difference between the upper and lower line slopes. Smaller values enforce stricter parallelism.
Max price tolerance outside channel
Default 0.0. A buffer added to the channel boundaries during validation and breakout checks. Use this to ignore tiny wicks that poke the lines.
Minimum inside to outside pivots ratio for valid channel (0.00–1.00)
Default 1.00. Require that at least this fraction of checked pivots lie inside the channel. For a more permissive fit, try 0.60 to 0.85.
Styling
Upper Line Color
Lower Line Color
Breakout Above Color
Breakout Below Color
Plots and visuals
Upper channel line
Lower channel line
Triangle markers on the bar that first confirms a close outside the channel, above or below.
Lines extend left from their pivot anchors. Projection to the current bar is used internally to test for breakouts and to set alerts.
Alerts
The script defines two alert conditions:
Close Above Channel
Triggers when the bar closes above the projected upper line plus tolerance.
Close Below Channel
Triggers when the bar closes below the projected lower line minus tolerance.
Practical usage
Trend channels
In a steady trend, a high inside ratio with a moderate width often highlights the dominant channel. Consider trend entries near the lower line in an uptrend or near the upper line in a downtrend, with exits or stops beyond the opposite boundary.
Breakout trades
Combine the channel breakout alert with volume or a separate momentum filter. The tolerance input helps avoid false triggers from small wicks.
Tuning for timeframe and symbol
• Faster markets or lower timeframes usually benefit from a larger ZigZag percentage and a smaller pivot count.
• Slower markets or higher timeframes can use more pivots and a tighter slope difference to enforce cleaner geometry.
Notes and limitations
Channels are derived from ZigZag pivots. If your ZigZag settings change, the detected channel will also change.
The script plots only the single best channel at any time to keep the chart clean.
Breakout markers appear on confirmed bars. For historical bars, markers appear only where a breakout would have been confirmed at that time.
Lines extend left from their anchors. The script projects the lines internally to the current bar for checks and alerts.
License and attribution
License
Creative Commons Attribution-NonCommercial 4.0 International (CC BY-NC 4.0).
Open source for educational and personal use only. Commercial use requires written permission.
Attribution
© 2025 SciQua — Joshua Danford
Libraries
Uses TradingView/ZigZag/7.
Changelog
v1.0
Initial release. Automatic parallel channel detection from ZigZag pivots, quality scoring, live plotting, and close-based breakout alerts.
FAQ
Why do I not see any channel sometimes?
There may not be a valid pair of highs and lows that pass the slope, inside ratio, and tolerance checks. Loosen the constraints by increasing Max slope difference, lowering Minimum inside ratio, or increasing the ZigZag percentage.
The channel looks too narrow or too wide?
Adjust Number of recent pivots and Minimum inside ratio. A higher inside ratio tends to favor cleaner, sometimes wider channels. A lower ratio may admit narrower, more reactive channels.
How can I reduce false breakout alerts?
Increase Max price tolerance outside channel to ignore small wicks. Add a volume or momentum confirmation in your personal alert workflow.
Thank you for using Auto Channel . Feedback and improvements are welcome.

Step Channel Momentum Trend [ChartPrime]OVERVIEW
Step Channel Momentum Trend is a momentum-based price filtering system that adapts to market structure using pivot levels and ATR volatility. It builds a dynamic channel around a stepwise midline derived from swing highs and lows. The system colors price candles based on whether price remains inside this channel (low momentum) or breaks out (strong directional flow). This allows traders to clearly distinguish ranging conditions from trending ones and take action accordingly.
⯁ STRUCTURAL MIDLNE (STEP CHANNEL CORE)
The midline acts as the backbone of the trend system and is based on structure rather than smoothing.
Calculated as the average of the most recent confirmed Pivot High and Pivot Low.
The result is a step-like horizontal line that only updates when new pivot points are confirmed.
This design avoids lag and makes the line "snap" to recent structural shifts.
It reflects the equilibrium level between recent bullish and bearish control.
This unique step logic creates clear regime shifts and prevents noise from distorting trend interpretation.
⯁ DYNAMIC VOLATILITY BANDS (ATR FILTERING)
To detect momentum strength, the script constructs upper and lower bands using the ATR (Average True Range):
The distance from the midline is determined by ATR × multiplier (default: 200-period ATR × 0.6).
These bands adjust dynamically to volatility, expanding in high-ATR environments and contracting in calm markets.
The area between upper and lower bands represents a neutral or ranging market state.
Breakouts outside the bands are treated as significant momentum shifts.
This filtering approach ensures that only meaningful breakouts are visually emphasized — not every candle fluctuation.
⯁ MOMENTUM-BASED CANDLE COLORING
The system visually transforms price candles into momentum indicators:
When price (hl2) is above the upper band, candles are green → bullish momentum.
When price is below the lower band, candles are red → bearish momentum.
When price is between the bands, candles are orange → low or no momentum (range).
The candle body, wick, and border are all colored uniformly for visual clarity.
This gives traders instant feedback on when momentum is expanding or fading — ideal for breakout, pullback, or trend-following strategies.
⯁ PIVOT-BASED SWING ANCHORS
Each confirmed pivot is plotted as a label ⬥ directly on the chart:
They also serve as potential manual entry zones, SL/TP anchors, or confirmation points.
⯁ MOMENTUM STATE LABEL
To reinforce the current market mode, a live label is displayed at the most recent candle:
Displays either:
“ Momentum Up ” when price breaks above the upper band.
“ Momentum Down ” when price breaks below the lower band.
“ Range ” when price remains between the bands.
Label color matches the candle color for quick identification.
Automatically updates on each bar close.
This helps discretionary traders filter trades based on market phase.
USAGE
Use the green/red zones to enter with momentum and ride trending moves.
Use the orange zone to stay out or fade ranges.
The step midline can act as a breakout base, pullback anchor, or bias reference.
Combine with other indicators (e.g., order blocks, divergences, or volume) to build high-confluence systems.
CONCLUSION
Step Channel Momentum Trend gives traders a clean, adaptive framework for identifying trend direction, volatility-based breakouts, and ranging environments — all from structural logic and ATR responsiveness. Its stepwise midline provides clarity, while its dynamic color-coded candles make momentum shifts impossible to miss. Whether you’re scalping intraday momentum or managing swing entries, this tool helps you trade with the market’s rhythm — not against it.

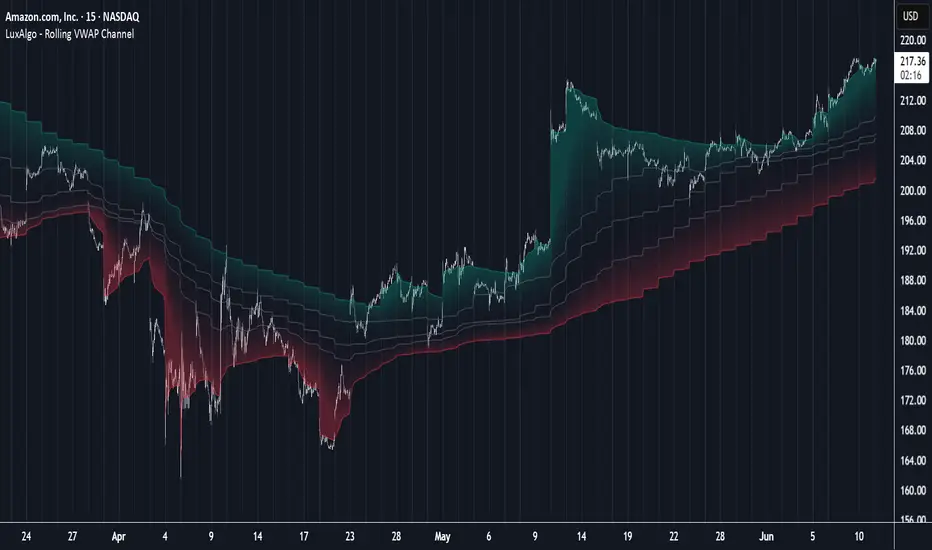
Rolling VWAP Channel [LuxAlgo]The Rolling VWAP Channel indicator creates a channel by analyzing a large number of Volume Weighted Average Prices (VWAPs) and determining a Channel based on percentile linear interpolation throughout the VWAPs.
🔶 USAGE
In this indicator, we have formed a Channel by first calculating multiple VWAPs, each with their respective anchor, then locating prices using "Percentile Linear Interpolation".
Note: Percentile Linear Interpolation locates the price point at which a specified percentage of VWAPs fall below it.
For example, a percentile of 50% would mean that 50% of the VWAP values fall below this price.
This method of analysis is important since the VWAPs are not often evenly distributed; therefore, we are able to draw importance to different levels by analyzing in percentiles.
When visualized, there is typically clustering of the VWAP values, which occurs at any given time, as seen below.
The channel can be tailored to each individual, with full control of each percentile represented in the channel. That being said, a general concept is that these clustered areas are clear results of sideways price action, which would lead us to believe that after interactions at these levels, we should expect to see a directional decision made by the market closely after.
🔶 DETAILS
The Rolling VWAP calculation calculates a user-specified number of VWAPs (up to 500), each anchored to a unique starting point in the chart based on the start of a new timeframe.
Each new timeframe that occurs causes a new VWAP to initialize. When the total number of desired VWAPs is reached, the oldest VWAP is removed and re-initialized, anchored to the current bar. Hence, the name " Rolling " VWAPs
This method allows us to automatically generate and manage large amounts of VWAPs without the need for user interaction.
After we have generated these VWAPs, we are able to run analyses on their returned values, such as the "Percentile Linear Interpolation" mentioned in the section above.
🔶 SETTINGS
Anchor Period: Choose which time period to use as the anchor point to initialize new VWAPs from.
VWAP Source: Choose the source for your VWAPs to calculate.
VWAP Amount: Sets the number of VWAPs to use. After this amount is on the chart, the oldest will be rolled.
🔹 Channel Lines
Toggle: Enable the associated VWAP Channel percentile line.
Percentile: Adjust each line's percentile independently for your needs.
Width: Adjust the width of the associated percentile line.
🔹 Calculation
Calculated Bars: Tells the indicator how many bars to calculate on, for faster calculations with less history, use a lower value. Setting this to 0 will remove the bar constraint.
TCT - Envelope MatrixTCT - Envelope Matrix
A powerful multi-envelope indicator that creates a comprehensive price channel system with 4 customizable envelopes and multiple intermediate levels for precise price action analysis.
Key Features:
• 4 customizable envelopes with adjustable percentages (0.2%, 0.4%, 0.6%, 0.8% by default)
• Optional EMA or SMA basis calculation
• Color-coded bands for easy visual identification
• Automatic horizontal lines showing current band values
• Midpoint lines between adjacent bands
• Additional 25%, 50%, and 75% levels between each band pair
The indicator provides:
- Clear visual representation of price channels
- Multiple support and resistance levels
- Dynamic price boundaries that adapt to market conditions
- Enhanced precision with intermediate levels between bands
Perfect for:
• Identifying potential support and resistance zones
• Spotting overbought/oversold conditions
• Finding potential reversal points
• Analyzing price volatility and channel width
• Making informed trading decisions based on price position relative to multiple bands
Customization Options:
• Adjustable length for the basis calculation
• Choice between EMA and SMA
• Customizable colors for each envelope
• Flexible percentage settings for each band
• Optional basis line color adjustment
This indicator is particularly useful for traders who want to analyze price action within multiple dynamic channels and identify potential trading opportunities based on price interactions with various support and resistance levels.
Support and Resistance Power Channel [ChartPrime]The Support and Resistance Power Channel indicator helps traders visualize key support and resistance zones, along with buy and sell power within those zones. By identifying the highest and lowest prices within a defined range, this indicator provides insight into potential price reversals and market strength. It calculates the strength of buy and sell pressure within the zones and includes additional features like midline values and delayed signals to reduce false breakouts.
⯁ KEY FEATURES AND HOW TO USE
⯌ Support and Resistance Zones :
This indicator identifies dynamic support (lower zone) and resistance (upper zone) levels, allowing traders to easily visualize key price levels. These zones are customizable with settings for the length of the channel and how far the zones extend into the future. The zones can be used to predict areas of potential price reversal or consolidation.
⯌ Buy and Sell Power :
Within the upper resistance zone, the indicator calculates Sell Power based on the number of bearish candles, while the lower support zone calculates Buy Power based on bullish candles. This feature helps traders understand the strength of buying or selling activity within each zone.
Example of buy and sell power tracking:
⯌ Highest, Lowest, and Mid Price Levels :
The indicator marks the highest and lowest price levels within the channel with an "X," and displays these values at the end of the channel. Additionally, the midline (average of the high and low) is plotted with a dotted line, showing a key area that the price often retests during trends.
⯌ Delayed Signal Markers :
To prevent false breakouts, the indicator includes a 2-bar delay for signals. These signals are plotted when the price crosses above or below the resistance or support zones, confirming potential reversals or breakouts. Arrows or diamonds are used to mark these signals on the chart.
Example of delayed breakout signals on the chart:
⯌ Extend Zones into the Future :
In the settings, traders can extend the support and resistance zones further into the future, allowing for ongoing analysis even after the initial levels have been identified. This feature can help with forward-looking trade planning.
⯁ USER INPUTS
Length : Defines the number of bars used to calculate the support and resistance zones.
Extend : Sets how far the support and resistance zones should be extended into the future.
Top and Bottom Colors : Allows customization of the colors for the support and resistance zones.
⯁ CONCLUSION
The Support and Resistance Power Channel indicator provides a powerful and visually intuitive way to track key market levels, buy and sell pressure, and potential reversals. With its real-time zone plotting and the calculation of power within each zone, it offers traders essential insights for making more informed trading decisions.

NR4 & NR7 with Breakouts [LuxAlgo]NR4 & NR7 with Breakouts is a simple indicator that utilizes the NR4 and NR7 candle patterns to display candle ranges and signals from range breakouts.
🔶 USAGE
The Narrow Range Patterns are candle formations determined by the last candle having a narrower (high-low) range than the previous number. This indicator showcases the 2 most recognized Narrow Range Patterns, which are the 4 and 7 bar variants (NR4 and NR7).
These patterns, introduced by Toby Crabel, are thought to provide insight for potential market breakouts by identifying periods of low volatility indicated by a candle with a small range. This is due to the idea that markets often move from periods of low volatility (contraction) to high volatility (expansion), and the NR4 and NR7 patterns help spot these transitions.
By utilizing these patterns, traders are better able to anticipate and respond to market shifts for better decision-making and risk management.
NOTE: These patterns have traditionally been studied on the Daily Timeframe Chart. This indicator allows the user to select a timeframe to generate these patterns from. It is suggested to be mindful of this when considering these patterns.
In this indicator, on the bar after the pattern is detected, the Narrow Range Bar will be highlighted with a zone, and lines displaying the range will extend from it. These ranges are helpful for providing levels to set limit orders and for managing risk.
Users are able to adjust which pattern they want visualized on their chart, please note;
All NR7s are NR4s but not all NR4s are NR7s.
Because of this, you will notice that when selecting "NR4" to display, the colors will change, but the detected ranges will not change.
🔹 Signals
When a Narrow Range Bar is detected, the script will wait for the price to close outside of the Range, then a signal will fire indicating the direction of exit. The signals are produced from the last NR4 or NR7 and will have the potential to fire from that range until a new NR4 or NR7 is detected.
After a signal fires, the logic goes into a "reset" period where it will wait for the price to reach the Range Mean before firing another signal.
These signals can be anticipated by considering the underlying logic and watching price approach the range extremities, and can be improved by utilizing other market information for confluence.
🔶 SETTINGS
Timeframe: Choose which timeframe to identify the NR4 and NR7 Pattern on. This must be Higher than the chart timeframe.
Pattern Type: Choose which (or all) patterns to display.

LinearRegressionLibrary "LinearRegression"
Calculates a variety of linear regression and deviation types, with optional emphasis weighting. Additionally, multiple of slope and Pearson’s R calculations.
calcSlope(_src, _len, _condition)
Calculates the slope of a linear regression over the specified length.
Parameters:
_src (float) : (float) The source data.
_len (int) : (int) The length of the lookback period for the linear regression.
_condition (bool) : (bool) Flag to enable calculation. Set to true to calculate on every bar; otherwise, set to barstate.islast for efficiency.
Returns: (float) The slope of the linear regression.
calcReg(_src, _len, _condition)
Calculates a basic linear regression, returning y1, y2, slope, and average.
Parameters:
_src (float) : (float) The source data series.
_len (int) : (int) The length of the lookback period.
_condition (bool) : (bool) Flag to enable calculation (true = calculate).
Returns: (float ) An array of 4 values: .
calcRegStandard(_src, _len, _emphasis, _condition)
Calculates an Standard linear regression with optional emphasis.
Parameters:
_src (float) : (series float) The source data series.
_len (int) : (int) The length of the lookback period.
_emphasis (float) : (float) The emphasis factor: 0 for equal weight; >0 emphasizes recent bars; <0 emphasizes older bars.
_condition (bool) : (bool) Flag to enable calculation (true = calculate).
Returns: (float ) .
calcRegRidge(_src, _len, lambda, _emphasis, _condition)
Calculates a ridge regression with optional emphasis.
Parameters:
_src (float) : (float) The source data series.
_len (int) : (int) The length of the lookback period.
lambda (float) : (float) The ridge regularization parameter.
_emphasis (float) : (float) The emphasis factor: 0 for equal weight; >0 emphasizes recent bars; <0 emphasizes older bars.
_condition (bool) : (bool) Flag to enable calculation (true = calculate).
Returns: (float ) .
calcRegLasso(_src, _len, lambda, _emphasis, _condition)
Calculates a Lasso regression with optional emphasis.
Parameters:
_src (float) : (float) The source data series.
_len (int) : (int) The length of the lookback period.
lambda (float) : (float) The Lasso regularization parameter.
_emphasis (float) : (float) The emphasis factor: 0 for equal weight; >0 emphasizes recent bars; <0 emphasizes older bars.
_condition (bool) : (bool) Flag to enable calculation (true = calculate).
Returns: (float ) .
calcElasticNetLinReg(_src, _len, lambda1, lambda2, _emphasis, _condition)
Calculates an Elastic Net regression with optional emphasis.
Parameters:
_src (float) : (float) The source data series.
_len (int) : (int) The length of the lookback period.
lambda1 (float) : (float) L1 regularization parameter (Lasso).
lambda2 (float) : (float) L2 regularization parameter (Ridge).
_emphasis (float) : (float) Emphasis factor: 0 for equal weight; >0 emphasizes recent bars; <0 emphasizes older bars.
_condition (bool) : (bool) Flag to enable calculation (true = calculate).
Returns: (float ) .
calcRegHuber(_src, _len, delta, iterations, _emphasis, _condition)
Calculates a Huber regression using Iteratively Reweighted Least Squares (IRLS).
Parameters:
_src (float) : (float) The source data series.
_len (int) : (int) The length of the lookback period.
delta (float) : (float) Huber threshold parameter.
iterations (int) : (int) Number of IRLS iterations.
_emphasis (float) : (float) Emphasis factor: 0 for equal weight; >0 emphasizes recent bars; <0 emphasizes older bars.
_condition (bool) : (bool) Flag to enable calculation (true = calculate).
Returns: (float ) .
calcRegLAD(_src, _len, iterations, _emphasis, _condition)
Calculates a Least Absolute Deviations (LAD) regression via IRLS.
Parameters:
_src (float) : (float) The source data series.
_len (int) : (int) The length of the lookback period.
iterations (int) : (int) Number of IRLS iterations for LAD.
_emphasis (float) : (float) Emphasis factor: 0 for equal weight; >0 emphasizes recent bars; <0 emphasizes older bars.
_condition (bool) : (bool) Flag to enable calculation (true = calculate).
Returns: (float ) .
calcRegBayesian(_src, _len, priorMean, priorSpan, sigma, _emphasis, _condition)
Calculates a Bayesian linear regression with optional emphasis.
Parameters:
_src (float) : (float) The source data series.
_len (int) : (int) The length of the lookback period.
priorMean (float) : (float) The prior mean for the slope.
priorSpan (float) : (float) The prior variance (or span) for the slope.
sigma (float) : (float) The assumed standard deviation of residuals.
_emphasis (float) : (float) Emphasis factor: 0 for equal weight; >0 emphasizes recent bars; <0 emphasizes older bars.
_condition (bool) : (bool) Flag to enable calculation (true = calculate).
Returns: (float ) .
calcRFromLinReg(_src, _len, _slope, _average, _y1, _condition)
Calculates the Pearson correlation coefficient (R) based on linear regression parameters.
Parameters:
_src (float) : (float) The source data.
_len (int) : (int) The length of the lookback period.
_slope (float) : (float) The slope of the linear regression.
_average (float) : (float) The average value of the source data series.
_y1 (float) : (float) The starting point (y-intercept of the oldest bar) for the linear regression.
_condition (bool) : (bool) Flag to enable calculation. Set to true to calculate on every bar; otherwise, set to barstate.islast for efficiency.
Returns: (float) The Pearson correlation coefficient (R) adjusted for the direction of the slope.
calcRFromSource(_src, _len, _condition)
Calculates the correlation coefficient (R) using a specified length and source data.
Parameters:
_src (float) : (float) The source data.
_len (int) : (int) The length of the lookback period.
_condition (bool) : (bool) Flag to enable calculation. Set to true to calculate on every bar; otherwise, set to barstate.islast for efficiency.
Returns: (float) The correlation coefficient (R).
calcSlopeLengthZero(_src, _len, _minLen, _step, _condition)
Identifies the length at which the slope is flattest (closest to zero).
Parameters:
_src (float) : (float) The source data.
_len (int) : (int) The maximum lookback length to consider (minimum of 2).
_minLen (int) : (int) The minimum length to start from (cannot exceed the max length).
_step (int) : (int) The increment step for lengths.
_condition (bool) : (bool) Flag to enable calculation. Set to true to calculate on every bar; otherwise, set to barstate.islast.
Returns: (int) The length at which the slope is flattest.
calcSlopeLengthHighest(_src, _len, _minLen, _step, _condition)
Identifies the length at which the slope is highest.
Parameters:
_src (float) : (float) The source data.
_len (int) : (int) The maximum lookback length (minimum of 2).
_minLen (int) : (int) The minimum length to start from.
_step (int) : (int) The step for incrementing lengths.
_condition (bool) : (bool) Flag to enable calculation. Set to true to calculate on every bar; otherwise, set to barstate.islast.
Returns: (int) The length at which the slope is highest.
calcSlopeLengthLowest(_src, _len, _minLen, _step, _condition)
Identifies the length at which the slope is lowest.
Parameters:
_src (float) : (float) The source data.
_len (int) : (int) The maximum lookback length (minimum of 2).
_minLen (int) : (int) The minimum length to start from.
_step (int) : (int) The step for incrementing lengths.
_condition (bool) : (bool) Flag to enable calculation. Set to true to calculate on every bar; otherwise, set to barstate.islast.
Returns: (int) The length at which the slope is lowest.
calcSlopeLengthAbsolute(_src, _len, _minLen, _step, _condition)
Identifies the length at which the absolute slope value is highest.
Parameters:
_src (float) : (float) The source data.
_len (int) : (int) The maximum lookback length (minimum of 2).
_minLen (int) : (int) The minimum length to start from.
_step (int) : (int) The step for incrementing lengths.
_condition (bool) : (bool) Flag to enable calculation. Set to true to calculate on every bar; otherwise, set to barstate.islast.
Returns: (int) The length at which the absolute slope value is highest.
calcRLengthZero(_src, _len, _minLen, _step, _condition)
Identifies the length with the lowest absolute R value.
Parameters:
_src (float) : (float) The source data.
_len (int) : (int) The maximum lookback length (minimum of 2).
_minLen (int) : (int) The minimum length to start from.
_step (int) : (int) The step for incrementing lengths.
_condition (bool) : (bool) Flag to enable calculation. Set to true to calculate on every bar; otherwise, set to barstate.islast.
Returns: (int) The length with the lowest absolute R value.
calcRLengthHighest(_src, _len, _minLen, _step, _condition)
Identifies the length with the highest R value.
Parameters:
_src (float) : (float) The source data.
_len (int) : (int) The maximum lookback length (minimum of 2).
_minLen (int) : (int) The minimum length to start from.
_step (int) : (int) The step for incrementing lengths.
_condition (bool) : (bool) Flag to enable calculation. Set to true to calculate on every bar; otherwise, set to barstate.islast.
Returns: (int) The length with the highest R value.
calcRLengthLowest(_src, _len, _minLen, _step, _condition)
Identifies the length with the lowest R value.
Parameters:
_src (float) : (float) The source data.
_len (int) : (int) The maximum lookback length (minimum of 2).
_minLen (int) : (int) The minimum length to start from.
_step (int) : (int) The step for incrementing lengths.
_condition (bool) : (bool) Flag to enable calculation. Set to true to calculate on every bar; otherwise, set to barstate.islast.
Returns: (int) The length with the lowest R value.
calcRLengthAbsolute(_src, _len, _minLen, _step, _condition)
Identifies the length with the highest absolute R value.
Parameters:
_src (float) : (float) The source data.
_len (int) : (int) The maximum lookback length (minimum of 2).
_minLen (int) : (int) The minimum length to start from.
_step (int) : (int) The step for incrementing lengths.
_condition (bool) : (bool) Flag to enable calculation. Set to true to calculate on every bar; otherwise, set to barstate.islast.
Returns: (int) The length with the highest absolute R value.
calcDevReverse(_src, _len, _slope, _y1, _inputDev, _emphasis, _condition)
Calculates the regressive linear deviation in reverse order, with optional emphasis on recent data.
Parameters:
_src (float) : (float) The source data.
_len (int) : (int) The length of the lookback period.
_slope (float) : (float) The slope of the linear regression.
_y1 (float) : (float) The y-intercept (oldest bar) of the linear regression.
_inputDev (float) : (float) The input deviation multiplier.
_emphasis (float) : (float) Emphasis factor: 0 for equal weight; >0 emphasizes recent bars; <0 emphasizes older bars.
_condition (bool) : (bool) Flag to enable calculation (true = calculate).
Returns: A 2-element tuple: .
calcDevForward(_src, _len, _slope, _y1, _inputDev, _emphasis, _condition)
Calculates the progressive linear deviation in forward order (oldest to most recent bar), with optional emphasis.
Parameters:
_src (float) : (float) The source data array, where _src is oldest and _src is most recent.
_len (int) : (int) The length of the lookback period.
_slope (float) : (float) The slope of the linear regression.
_y1 (float) : (float) The y-intercept of the linear regression (value at the most recent bar, adjusted by slope).
_inputDev (float) : (float) The input deviation multiplier.
_emphasis (float) : (float) Emphasis factor: 0 for equal weight; >0 emphasizes recent bars; <0 emphasizes older bars.
_condition (bool) : (bool) Flag to enable calculation (true = calculate).
Returns: A 2-element tuple: .
calcDevBalanced(_src, _len, _slope, _y1, _inputDev, _emphasis, _condition)
Calculates the balanced linear deviation with optional emphasis on recent or older data.
Parameters:
_src (float) : (float) Source data array, where _src is the most recent and _src is the oldest.
_len (int) : (int) The length of the lookback period.
_slope (float) : (float) The slope of the linear regression.
_y1 (float) : (float) The y-intercept of the linear regression (value at the oldest bar).
_inputDev (float) : (float) The input deviation multiplier.
_emphasis (float) : (float) Emphasis factor: 0 for equal weight; >0 emphasizes recent bars; <0 emphasizes older bars.
_condition (bool) : (bool) Flag to enable calculation (true = calculate).
Returns: A 2-element tuple: .
calcDevMean(_src, _len, _slope, _y1, _inputDev, _emphasis, _condition)
Calculates the mean absolute deviation from a forward-applied linear trend (oldest to most recent), with optional emphasis.
Parameters:
_src (float) : (float) The source data array, where _src is the most recent and _src is the oldest.
_len (int) : (int) The length of the lookback period.
_slope (float) : (float) The slope of the linear regression.
_y1 (float) : (float) The y-intercept (oldest bar) of the linear regression.
_inputDev (float) : (float) The input deviation multiplier.
_emphasis (float) : (float) Emphasis factor: 0 for equal weight; >0 emphasizes recent bars; <0 emphasizes older bars.
_condition (bool) : (bool) Flag to enable calculation (true = calculate).
Returns: A 2-element tuple: .
calcDevMedian(_src, _len, _slope, _y1, _inputDev, _emphasis, _condition)
Calculates the median absolute deviation with optional emphasis on recent data.
Parameters:
_src (float) : (float) The source data array (index 0 = oldest, index _len - 1 = most recent).
_len (int) : (int) The length of the lookback period.
_slope (float) : (float) The slope of the linear regression.
_y1 (float) : (float) The y-intercept (oldest bar) of the linear regression.
_inputDev (float) : (float) The deviation multiplier.
_emphasis (float) : (float) Emphasis factor: 0 for equal weight; >0 emphasizes recent bars; <0 emphasizes older bars.
_condition (bool) : (bool) Flag to enable calculation (true = calculate).
Returns:
calcDevPercent(_y1, _inputDev, _condition)
Calculates the percent deviation from a given value and a specified percentage.
Parameters:
_y1 (float) : (float) The base value from which to calculate deviation.
_inputDev (float) : (float) The deviation percentage.
_condition (bool) : (bool) Flag to enable calculation (true = calculate).
Returns: A 2-element tuple: .
calcDevFitted(_len, _slope, _y1, _emphasis, _condition)
Calculates the weighted fitted deviation based on high and low series data, showing max deviation, with optional emphasis.
Parameters:
_len (int) : (int) The length of the lookback period.
_slope (float) : (float) The slope of the linear regression.
_y1 (float) : (float) The Y-intercept (oldest bar) of the linear regression.
_emphasis (float) : (float) Emphasis factor: 0 for equal weight; >0 emphasizes recent bars; <0 emphasizes older bars.
_condition (bool) : (bool) Flag to enable calculation (true = calculate).
Returns: A 2-element tuple: .
calcDevATR(_src, _len, _slope, _y1, _inputDev, _emphasis, _condition)
Calculates an ATR-style deviation with optional emphasis on recent data.
Parameters:
_src (float) : (float) The source data (typically close).
_len (int) : (int) The length of the lookback period.
_slope (float) : (float) The slope of the linear regression.
_y1 (float) : (float) The Y-intercept (oldest bar) of the linear regression.
_inputDev (float) : (float) The input deviation multiplier.
_emphasis (float) : (float) Emphasis factor: 0 for equal weight; >0 emphasizes recent bars; <0 emphasizes older bars.
_condition (bool) : (bool) Flag to enable calculation (true = calculate).
Returns: A 2-element tuple: .
calcPricePositionPercent(_top, _bot, _src)
Calculates the percent position of a price within a linear regression channel. Top=100%, Bottom=0%.
Parameters:
_top (float) : (float) The top (positive) deviation, corresponding to 100%.
_bot (float) : (float) The bottom (negative) deviation, corresponding to 0%.
_src (float) : (float) The source price.
Returns: (float) The percent position within the channel.
plotLinReg(_len, _y1, _y2, _slope, _devTop, _devBot, _scaleTypeLog, _lineWidth, _extendLines, _channelStyle, _colorFill, _colUpLine, _colDnLine, _colUpFill, _colDnFill)
Plots the linear regression line and its deviations, with configurable styles and fill.
Parameters:
_len (int) : (int) The lookback period for the linear regression.
_y1 (float) : (float) The starting y-value of the regression line.
_y2 (float) : (float) The ending y-value of the regression line.
_slope (float) : (float) The slope of the regression line (used to determine line color).
_devTop (float) : (float) The top deviation to add to the line.
_devBot (float) : (float) The bottom deviation to subtract from the line.
_scaleTypeLog (bool) : (bool) Use a log scale if true; otherwise, linear scale.
_lineWidth (int) : (int) The width of the plotted lines.
_extendLines (string) : (string) How lines should extend (none, left, right, both).
_channelStyle (string) : (string) The style of the channel lines (solid, dashed, dotted).
_colorFill (bool) : (bool) Whether to fill the space between the top and bottom deviation lines.
_colUpLine (color) : (color) Line color when slope is positive.
_colDnLine (color) : (color) Line color when slope is negative.
_colUpFill (color) : (color) Fill color when slope is positive.
_colDnFill (color) : (color) Fill color when slope is negative.

Prime Bands [ChartPrime]The Prime Standard Deviation Bands indicator uses custom-calculated bands based on highest and lowest price values over specific period to analyze price volatility and trend direction. Traders can set the bands to 1, 2, or 3 standard deviations from a central base, providing a dynamic view of price behavior in relation to volatility. The indicator also includes color-coded trend signals, standard deviation labels, and mean reversion signals, offering insights into trend strength and potential reversal points.
⯁ KEY FEATURES AND HOW TO USE
⯌ Standard Deviation Bands :
The indicator plots upper and lower bands based on standard deviation settings (1, 2, or 3 SDs) from a central base, allowing traders to visualize volatility and price extremes. These bands can be used to identify overbought and oversold conditions, as well as potential trend reversals.
Example of 3-standard-deviation bands around price:
⯌ Dynamic Trend Indicator :
The midline of the bands changes color based on trend direction. If the midline is rising, it turns green, indicating an uptrend. When the midline is falling, it turns orange, suggesting a downtrend. This color coding provides a quick visual reference to the current trend.
Trend color examples for rising and falling midlines:
⯌ Standard Deviation Labels :
At the end of the bands, the indicator displays labels with price levels for each standard deviation level (+3, 0, -3, etc.), helping traders quickly reference where price is relative to its statistical boundaries.
Price labels at each standard deviation level on the chart:
⯌ Mean Reversion Signals :
When price moves beyond the upper or lower bands and then reverts back inside, the indicator plots mean reversion signals with diamond icons. These signals indicate potential reversal points where the price may return to the mean after extreme moves.
Example of mean reversion signals near bands:
⯌ Standard Deviation Scale on Chart :
A visual scale on the right side of the chart shows the current price position in relation to the bands, expressed in standard deviations. This scale provides an at-a-glance view of how far price has deviated from the mean, helping traders assess risk and volatility.
⯁ USER INPUTS
Length : Sets the number of bars used in the calculation of the bands.
Standard Deviation Level : Allows selection of 1, 2, or 3 standard deviations for upper and lower bands.
Colors : Customize colors for the uptrend and downtrend midline indicators.
⯁ CONCLUSION
The Prime Standard Deviation Bands indicator provides a comprehensive view of price volatility and trend direction. Its customizable bands, trend coloring, and mean reversion signals allow traders to effectively gauge price behavior, identify extreme conditions, and make informed trading decisions based on statistical boundaries.

Improved G-Trend DetectionIt is the Improved version of G trend channel detection.
The Umair Trend Detection Indicator is a powerful tool designed to help traders identify potential buy and sell opportunities by combining dynamic price channels with RSI-based confirmation. This indicator is suitable for all types of financial markets, including stocks, forex, and cryptocurrencies.
Key Features:
Dynamic G-Channels
Calculates upper, lower, and average price channels based on the "G-Channel" methodology.
Helps identify market extremes and potential reversal points.
RSI Confirmation
Integrates RSI (Relative Strength Index) to filter buy and sell signals.
Avoids false signals by ensuring market momentum aligns with trend direction.
Buy/Sell Signals
Generates "Buy" signals when bullish conditions align with oversold RSI levels.
Generates "Sell" signals when bearish conditions align with overbought RSI levels.
Exit Signals
Provides optional exit points for both long and short positions using a buffer for confirmation.
Visual Clarity
Displays clearly plotted channels and average lines to help visualize price trends.
Buy and sell signals are marked with arrows for easy identification on the chart.
Custom Alerts
Offers customizable alerts for buy, sell, and exit conditions, ensuring traders never miss an opportunity.
Input Parameters:
Channel Length: Controls the sensitivity of the G-Channels.
Multiplier: Adjusts the width of the channels to suit different market conditions.
RSI Settings: Customize RSI length and thresholds for overbought/oversold conditions.
Exit Signal Buffer: Adds flexibility to the exit strategy by delaying signals for confirmation.
How It Helps:
The Umair Trend Detection Indicator is perfect for traders looking for an easy-to-use trend-following system with strong confirmation. By combining dynamic channels with RSI, it provides accurate and reliable signals to enter and exit trades, minimizing risks associated with false breakouts or trend reversals.
Use Cases:
Trend Trading: Identify and follow long-term trends with confidence.
Swing Trading: Spot reversals and capitalize on medium-term price movements.
Risk Management: Use exit signals to lock in profits or limit losses effectively.
This indicator is a versatile tool for both novice and experienced traders. Fine-tune its settings to align with your trading style and improve your decision-making in any market.

True Amplitude Envelopes (TAE)The True Envelopes indicator is an adaptation of the True Amplitude Envelope (TAE) method, based on the research paper " Improved Estimation of the Amplitude Envelope of Time Domain Signals Using True Envelope Cepstral Smoothing " by Caetano and Rodet. This indicator aims to create an asymmetric price envelope with strong predictive power, closely following the methodology outlined in the paper.
Due to the inherent limitations of Pine Script, the indicator utilizes a Kernel Density Estimator (KDE) in place of the original Cepstral Smoothing technique described in the paper. While this approach was chosen out of necessity rather than superiority, the resulting method is designed to be as effective as possible within the constraints of the Pine environment.
This indicator is ideal for traders seeking an advanced tool to analyze price dynamics, offering insights into potential price movements while working within the practical constraints of Pine Script. Whether used in dynamic mode or with a static setting, the True Envelopes indicator helps in identifying key support and resistance levels, making it a valuable asset in any trading strategy.
Key Features:
Dynamic Mode: The indicator dynamically estimates the fundamental frequency of the price, optimizing the envelope generation process in real-time to capture critical price movements.
High-Pass Filtering: Uses a high-pass filtered signal to identify and smoothly interpolate price peaks, ensuring that the envelope accurately reflects significant price changes.
Kernel Density Estimation: Although implemented as a workaround, the KDE technique allows for flexible and adaptive smoothing of the envelope, aimed at achieving results comparable to the more sophisticated methods described in the original research.
Symmetric and Asymmetric Envelopes: Provides options to select between symmetric and asymmetric envelopes, accommodating various trading strategies and market conditions.
Smoothness Control: Features adjustable smoothness settings, enabling users to balance between responsiveness and the overall smoothness of the envelopes.
The True Envelopes indicator comes with a variety of input settings that allow traders to customize the behavior of the envelopes to match their specific trading needs and market conditions. Understanding each of these settings is crucial for optimizing the indicator's performance.
Main Settings
Source: This is the data series on which the indicator is applied, typically the closing price (close). You can select other price data like open, high, low, or a custom series to base the envelope calculations.
History: This setting determines how much historical data the indicator should consider when calculating the envelopes. A value of 0 will make the indicator process all available data, while a higher value restricts it to the most recent n bars. This can be useful for reducing the computational load or focusing the analysis on recent market behavior.
Iterations: This parameter controls the number of iterations used in the envelope generation algorithm. More iterations will typically result in a smoother envelope, but can also increase computation time. The optimal number of iterations depends on the desired balance between smoothness and responsiveness.
Kernel Style: The smoothing kernel used in the Kernel Density Estimator (KDE). Available options include Sinc, Gaussian, Epanechnikov, Logistic, and Triangular. Each kernel has different properties, affecting how the smoothing is applied. For example, Gaussian provides a smooth, bell-shaped curve, while Epanechnikov is more efficient computationally with a parabolic shape.
Envelope Style: This setting determines whether the envelope should be Static or Dynamic. The Static mode applies a fixed period for the envelope, while the Dynamic mode automatically adjusts the period based on the fundamental frequency of the price data. Dynamic mode is typically more responsive to changing market conditions.
High Q: This option controls the quality factor (Q) of the high-pass filter. Enabling this will increase the Q factor, leading to a sharper cutoff and more precise isolation of high-frequency components, which can help in better identifying significant price peaks.
Symmetric: This setting allows you to choose between symmetric and asymmetric envelopes. Symmetric envelopes maintain an equal distance from the central price line on both sides, while asymmetric envelopes can adjust differently above and below the price line, which might better capture market conditions where upside and downside volatility are not equal.
Smooth Envelopes: When enabled, this setting applies additional smoothing to the envelopes. While this can reduce noise and make the envelopes more visually appealing, it may also decrease their responsiveness to sudden market changes.
Dynamic Settings
Extra Detrend: This setting toggles an additional high-pass filter that can be applied when using a long filter period. The purpose is to further detrend the data, ensuring that the envelope focuses solely on the most recent price oscillations.
Filter Period Multiplier: This multiplier adjusts the period of the high-pass filter dynamically based on the detected fundamental frequency. Increasing this multiplier will lengthen the period, making the filter less sensitive to short-term price fluctuations.
Filter Period (Min) and Filter Period (Max): These settings define the minimum and maximum bounds for the high-pass filter period. They ensure that the filter period stays within a reasonable range, preventing it from becoming too short (and overly sensitive) or too long (and too sluggish).
Envelope Period Multiplier: Similar to the filter period multiplier, this adjusts the period for the envelope generation. It scales the period dynamically to match the detected price cycles, allowing for more precise envelope adjustments.
Envelope Period (Min) and Envelope Period (Max): These settings establish the minimum and maximum bounds for the envelope period, ensuring the envelopes remain adaptive without becoming too reactive or too slow.
Static Settings
Filter Period: In static mode, this setting determines the fixed period for the high-pass filter. A shorter period will make the filter more responsive to price changes, while a longer period will smooth out more of the price data.
Envelope Period: This setting specifies the fixed period used for generating the envelopes in static mode. It directly influences how tightly or loosely the envelopes follow the price action.
TAE Smoothing: This controls the degree of smoothing applied during the TAE process in static mode. Higher smoothing values result in more gradual envelope curves, which can be useful in reducing noise but may also delay the envelope’s response to rapid price movements.
Visual Settings
Top Band Color: This setting allows you to choose the color for the upper band of the envelope. This band represents the resistance level in the price action.
Bottom Band Color: Similar to the top band color, this setting controls the color of the lower band, which represents the support level.
Center Line Color: This is the color of the central price line, often referred to as the carrier. It represents the detrended price around which the envelopes are constructed.
Line Width: This determines the thickness of the plotted lines for the top band, bottom band, and center line. Thicker lines can make the envelopes more visible, especially when overlaid on price data.
Fill Alpha: This controls the transparency level of the shaded area between the top and bottom bands. A lower alpha value will make the fill more transparent, while a higher value will make it more opaque, helping to highlight the envelope more clearly.
The envelopes generated by the True Envelopes indicator are designed to provide a more precise and responsive representation of price action compared to traditional methods like Bollinger Bands or Keltner Channels. The core idea behind this indicator is to create a price envelope that smoothly interpolates the significant peaks in price action, offering a more accurate depiction of support and resistance levels.
One of the critical aspects of this approach is the use of a high-pass filtered signal to identify these peaks. The high-pass filter serves as an effective method of detrending the price data, isolating the rapid fluctuations in price that are often lost in standard trend-following indicators. By filtering out the lower frequency components (i.e., the trend), the high-pass filter reveals the underlying oscillations in the price, which correspond to significant peaks and troughs. These oscillations are crucial for accurately constructing the envelope, as they represent the most responsive elements of the price movement.
The algorithm works by first applying the high-pass filter to the source price data, effectively detrending the series and isolating the high-frequency price changes. This filtered signal is then used to estimate the fundamental frequency of the price movement, which is essential for dynamically adjusting the envelope to current market conditions. By focusing on the peaks identified in the high-pass filtered signal, the algorithm generates an envelope that is both smooth and adaptive, closely following the most significant price changes without overfitting to transient noise.
Compared to traditional envelopes and bands, such as Bollinger Bands and Keltner Channels, the True Envelopes indicator offers several advantages. Bollinger Bands, which are based on standard deviations, and Keltner Channels, which use the average true range (ATR), both tend to react to price volatility but do not necessarily follow the peaks and troughs of the price with precision. As a result, these traditional methods can sometimes lag behind or fail to capture sudden shifts in price momentum, leading to either false signals or missed opportunities.
In contrast, the True Envelopes indicator, by using a high-pass filtered signal and a dynamic period estimation, adapts more quickly to changes in price behavior. The envelopes generated by this method are less prone to the lag that often affects standard deviation or ATR-based bands, and they provide a more accurate representation of the price's immediate oscillations. This can result in better predictive power and more reliable identification of support and resistance levels, making the True Envelopes indicator a valuable tool for traders looking for a more responsive and precise approach to market analysis.
In conclusion, the True Envelopes indicator is a powerful tool that blends advanced theoretical concepts with practical implementation, offering traders a precise and responsive way to analyze price dynamics. By adapting the True Amplitude Envelope (TAE) method through the use of a Kernel Density Estimator (KDE) and high-pass filtering, this indicator effectively captures the most significant price movements, providing a more accurate depiction of support and resistance levels compared to traditional methods like Bollinger Bands and Keltner Channels. The flexible settings allow for extensive customization, ensuring the indicator can be tailored to suit various trading strategies and market conditions.
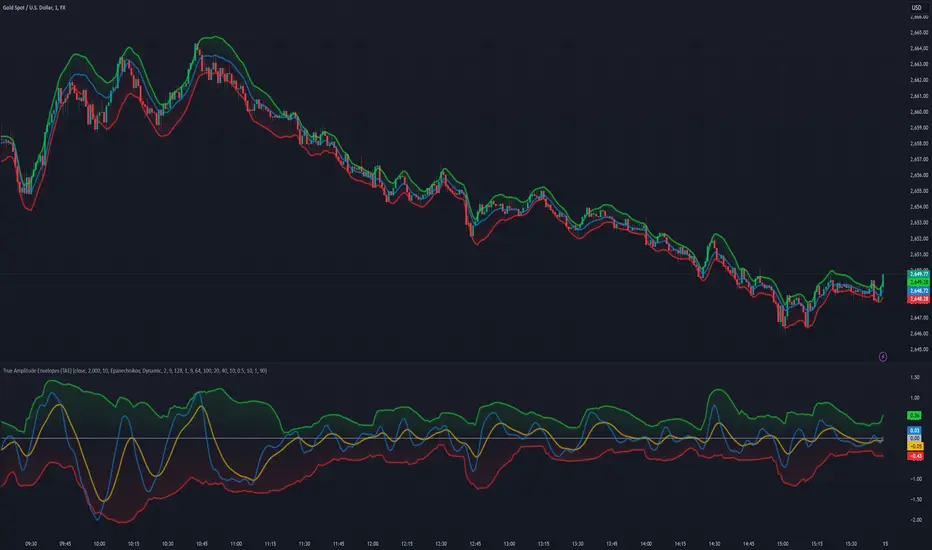
FVG Channel [LuxAlgo]The FVG Channel indicator displays a channel constructed from the averages of unmitigated historical fair value gaps (FVG), allowing to identify trends and potential reversals in the market.
Users can control the amount of FVGs to consider for the calculation of the channels, as well as their degree of smoothness through user settings.
🔶 USAGE
The FVG Channel is constructed by averaging together recent unmitigated Bullish FVGs (contributing to the creation of the upper bands), and Bearish unmitigated FVGs (contributing to the creation of the lower bands) within a lookback determined by the user. A higher lookback will return longer-term indications from the indicator.
The channel includes 5 bands, with one upper and one lower outer extremities, as well as an inner series of values determined using the Fibonacci ratios (respectively 0.786, 0.5, 0.236) from the channel's outer extremities.
An uptrend can be identified by price holding above the inner upper band (obtained from the 0.786 ratio), this band can also provide occasional support when the price retraces to it while in an uptrend.
Breaking below the inner upper band with an unwillingness to reach above again is a clear sign of hesitation in the market and can be indicative of an upcoming consolidation or reversal.
This can directly be applied to downtrends as well, below are examples displaying both scenarios.
Uptrend Example:
Downtrend Example:
🔹 Breakout Levels
When the price mitigates all FVGs in a single direction except for 1, the indicator will display a "Breakout Level". This is the level that price will need to cross in order for all FVGs in that direction to be mitigated, because of this they can also be aptly called "Last Stand Levels".
These levels can be considered as potential support and resistance levels, however, should always be monitored for breakouts since a substantial push above or below these points would indicate strong momentum.
🔹 Signals
The indicator includes Bullish and Bearish Signals, these signals fire when all FVGs for a single direction have been mitigated and an engulfing candle occurs in the opposite direction. These are reversal signals and should be used alongside other indicators to appropriately manage risk.
Note: When all FVGs in a single direction have been mitigated, the candles will change colors accordingly.
🔶 DETAILS
The script uses a typical identification method for FVGs. Once identified, the script collects and stores the mitigation levels of the respective bullish and bearish FVGs:
For Bullish FVGs this is the bottom of the FVG.
For Bearish FVGs this is the top of the FVG.
The data is managed to only consider a specific amount of FVG mitigation levels, determined by the set "Unmitigated FVG Lookback". If an FVG is mitigated, it frees up a spot in the memory for a new FVG, however, if the memory is full, the oldest will be deleted.
The averages displayed (Channel Upper and Lower) are created from 2 calculation steps, the first step involves taking the raw average of the FVG mitigation levels, and the second step applies a simple moving average (SMA) smoothing of the precedent obtained averages.
Note: To view the mitigation levels average obtained in the first step, the "Smoothing Length" can be set to 1.
🔶 SETTINGS
Unmitigated FVG Lookback: Sets the maximum number of Unmitigated FVG mitigation levels that the script will use to calculate the channel.
Smoothing Length: Sets the smoothing length for the channel to reduce noise from the raw data.
