Swing FilterSwing Filter allows you to identify market swings and use the settings to filter out the noise.
The concept is the same as Pine Script's built in pivothigh() and pivotlow(), except with a command center full of controls. Do you to only see swings that are a certain amount higher or lower than their neighboring candles? Want to filter out flash-crashes or freak-spikes? Do you want to count swing-highs or lows that are formed by multiple bars? ...how many? ...how strict? Do you only want swings that are already confirmed or do you want swings that are probably about to be confirmed? You get the idea.
Swing Filter was designed to be plugged into other tools. Swings are used to figure Support and Resistance in Technical Analysis (TA), so you'll find that it is swing filter working in the background of my Support & Resistance Indicator. The creator of this indicator would be happy to help you implement Swing Filter into your workflow, and even can unlock rewiring features that allow Trading View Premium customers to use outputs from other indicators as inputs to swing filter (indicator layering).
INDICATOR SETTINGS:
SWING HIGH VISIBILITY - Show the location of all filtered swing-highs, marked with green "H"
Show Unconfirmed Swing Highs - Whereas a confirmed swing high is shown with a green H, unconfirmed swing highs are shown with an orange H. Sometimes you want to see what could become a swing high before the final right-neighboring candle closes and confirms it. As long as the final right-side candle still has a lower high, we can show an unconfirmed swing high. Once the final right-side candle closes with a lower high, then we have a confirmed swing high. When the "# of Lower Bars to Right of Swing High" setting is set to a number greater than 1, keep in mind that unconfirmed candles will only ever appear one candle prior to confirmation.
# of Lower Bars to Left of Swing High - Swing highs are calculated based on being higher than neighboring candles. How many candles do you want to check to the left-side of a swing high?
# of Lower Bars to Right of Swing High - Swing highs are calculated based on being higher than neighboring candles. How many candles do you want to check to the right-side of a swing high?
Must be This % Higher Than Left Bars - Filter out highs that aren't high enough. "0.5" would require your swing highs to be at least half a percent higher than the high of its confirming left-side bars.
Must be This % Higher Than Right Bars - Filter out highs that aren't high enough. "1" would require your swing highs to be at least one percent higher than the high of its confirming right-side bars.
Multibar Highs - # Bars Allowed to Form High - Filter out or allow highs that are formed at a transition from one bar to another. Especially on low spread exchanges like GDAX, highs may be formed by many consecutive bars, formed by persistant impenetrable buy/sell walls. When using multibar highs, they are counted as a single candle: the swing high will be marked on the right-most high of the multi-bar high, and then the left-side bars are counted from the left-most high of the multi-bar high.
Multibar Highs Strict-Mode - Some multibar highs are just the result of chance, meaning that the first candle reached it's high, went back down, then the second candle reached the same high at a later time. Strict mode will filter these out and only show multibar swing highs that were formed when a candle closed at its high and the next candle opened at its same high. How strict? It allows a one penny difference (for negligible spreads). It also doesn't care about the candles' lows, which leaves room for a future super-strict mode.
*For the complete list of settings and instructions see comments below (sorry they're listed in backwards order below, and the publishing rules won't let me put them all here (too long))
Pivot


Duo Convergence - Indicator - Alert SetupHello,
Here is a safe indicator based on pivot and EMAs.
About the indicator
In short, it will help you :
Make safe profits when the market is in double convergence.
Do nothing when the market it flat or moving sideways.
The Strategy would be the following : Go long on an arrow up with a stop loss just below it. Go short on an arrow down with a stop loss just above it. Take profit when you think you made a decent percentage.
I will grant access to people willing to make a small donation. Those who donate get access to my other scripts aswell.
Here is my BTC 6.51% address : 19sVQvCDmVfEACq7BiMnWSMqFPZ8qfSQ2K
If you prefer ETH : 0xc8a5d3a63a05db0c2363ea1c08b37a01cce9ebfb
Send me a Private Message with the ID of the transaction
If you want to do some forward testing first, send me a message.
This script comes with an Alert Setup.
I am also taking commissions if you want me to code something for you, or do some reverse engineering.
Also you can ask me anything in the comments.
Thanks and see you next time !

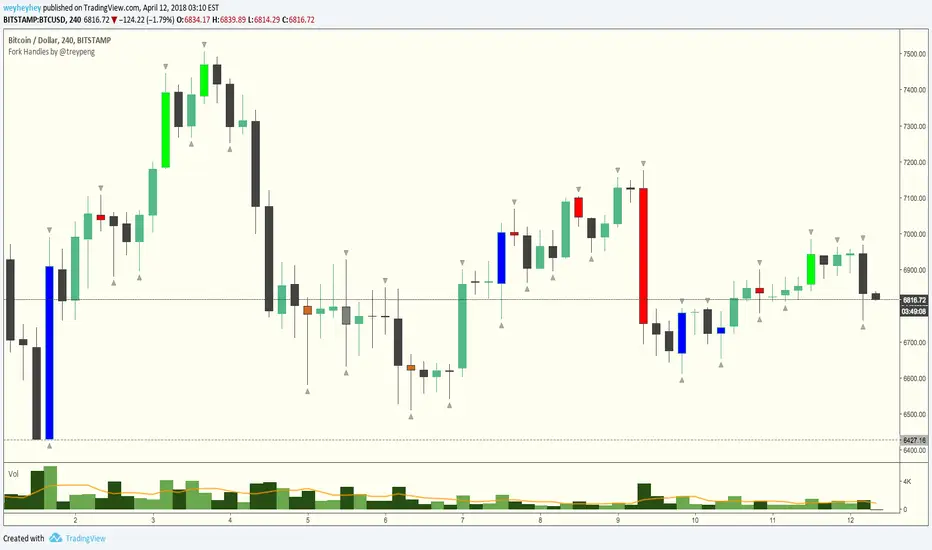
Fork Handles by @treypeng
Candle based indicator that shows swing highs and lows (pivots).
It draws an up or down arrow for simple three candle 'single' swings.
For stronger five candle 'double' swings, it colours the candle. Good for highlighting stronger reversals.
Both of these stylings can be toggled on/off individually.
Default colours
Swing HIGH on an UP candle: bright green
Swing HIGH on an DOWN candle: bright red
Swing LOW on an UP candle: blue
Swing LOW on an DOWN candle: brown
Double swings are grey or white.
Regular candles are just kept to your own default colours as specified in the chart settings.
👏 for anyone who gets the 'fork handles' joke reference.
Kozlod - Pivot Reversal Strategy Alerts V2Its' new version of previously published Kozlod - Pivot Reversal Strategy Alerts
Indicator now better correspond to original strategy. However, there can be some differences. Problem is that it's pretty tricky to implement in plain PineScript same "stop" logic used in strategy.entry of the original script

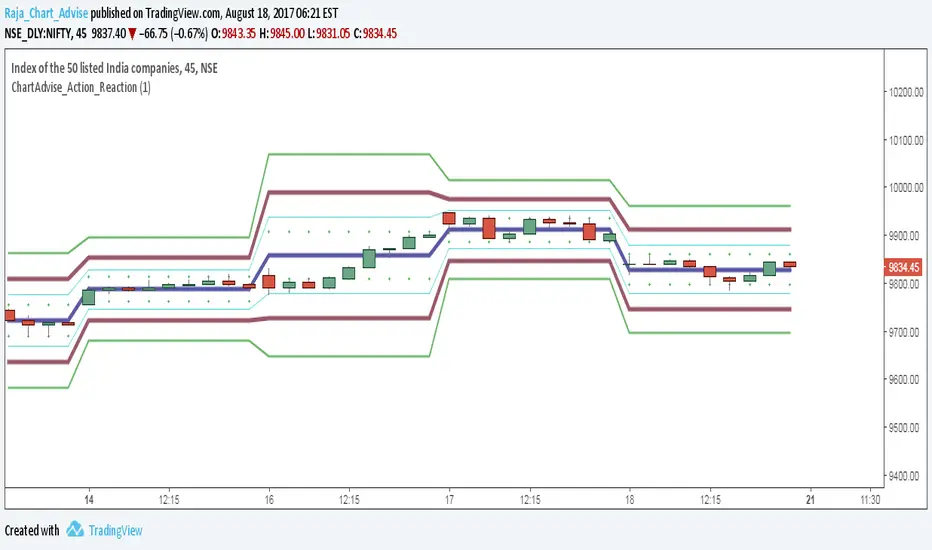
Static pivots levels
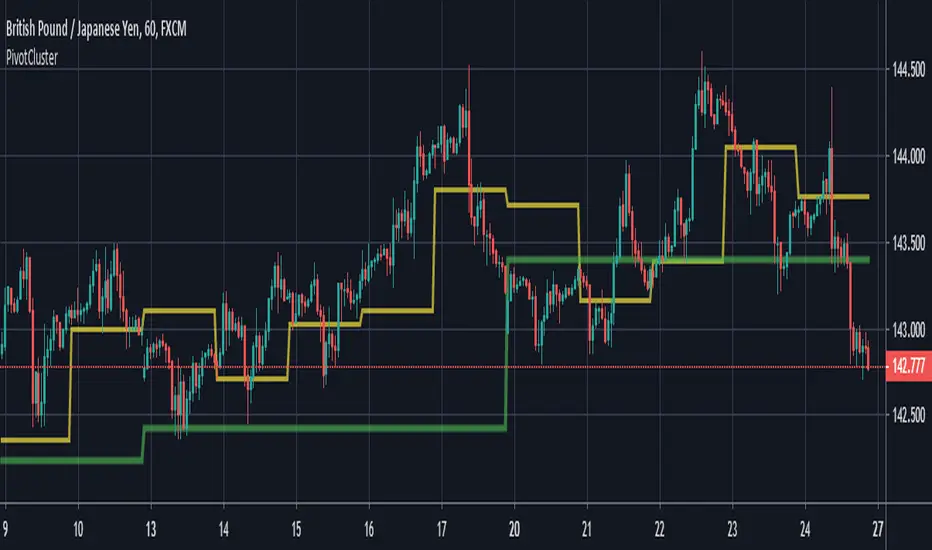
This tool graphs 3 levels with high pivot probability and each level represents the weighted average of the price during the last period of time.
Weighted average of the last Day
Weighted average of the last Week
Weighted average of the last Month
Each level can represent a level of support or resistance, depending on the case. Also these levels make the function of magnet or price trampoline, it may well attract or repel the price.
Let me know your questions by private chat.
Regards!

My Custom indicator & Strategy for trading BTC in 5min UTHello,
If your goal is to make some BTC, this script might be for you.
I tested it on the ETH/BTC Binance chart.
About the indicator :
In short, it will help you for several things :
Avoid losing BTC when the trend goes bearish.
Earn BTC during any bullish trend.
Earn BTC when the market is in trading range by bouncing off trend lines, while anticipating a new potential trend.
I based my algorithm on several technical tools such as volume, RSI, pivot, for a total of 6 boolean conditions mixed together with AND and OR gates, resulting in those entry points (shapes)
About the Strategy :
I only used long entries and exits. No shorting.
The commission rate is set to 0.05% (binance)
The backtesting results in only 40€ of net profit for a 1000€ inital capital, it may seem litle BUT during the testing period (18 days, 40 trades) the coin (ETH) dropped in BTC value ( -25% ). You make 4% while a simple Holder would lose -25%, which is 29% difference.
Since I worked hard on this script, I'll grant access to only those willing to make a small donation, that'd really help me reach my goal of making a living with trading. I will also give you any info you want and give you everything need to set up alerts. Thank you very much.

Swing IndicatorThis indicator provides some base code for looping over data to identify swings in price action. Full code commentary can be found on the backtest rookies website.
The indicator shall allow users to "analyse" a recent historical candle to detect whether it was a swing point. This will work by inputting a number to select which historical candle you want to check. The indicator will then check all candles after it until the current candle. It shall also check the same amount of candles before it. If the candle analysed has the lowest low or highest high in the complete range, then we know it was a swing point.

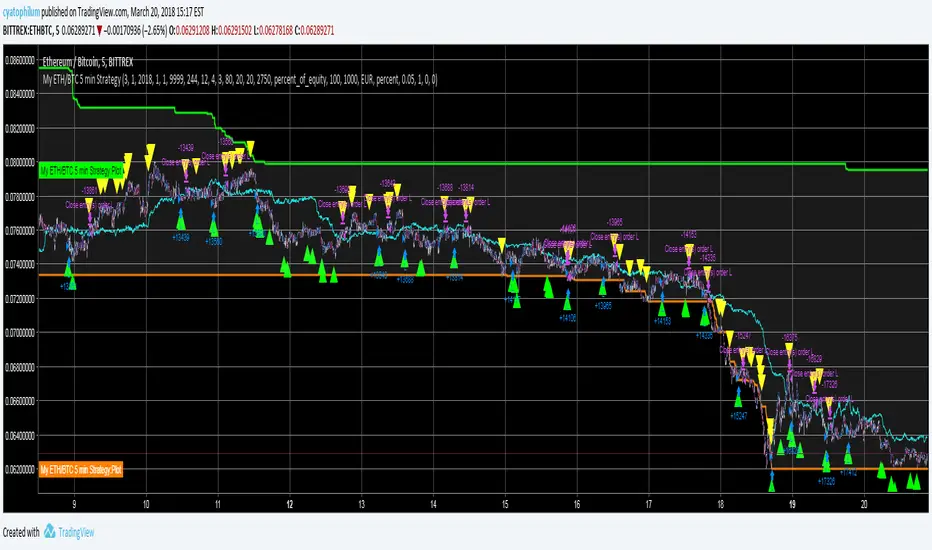
My ETH/BTC 5 min StrategyHello, beginner in trading here. Use this at your own risk.
Commission : 0.05%
Time Unit : 5 min
Backtest range : 15 days (looking like that is the maximum in 5 min UT)
Initial capital : 1000€
How it works :
Long entries and exits. That's all, no pyramiding, no shorting.
It takes the first buy signal (green triangle) and the first sell signal (yellow triangle)
The idea is to scalp while in range using stochastic, and to get out / in when a big trend appears (that is what the tunnel is for).
See the code for details.
I think those are pretty good result when we look at hueg negative buy and hold returns of this month of March. What do you think?
[Study] Pivots EMA Stoch SetupUsing daily pivot, if price is greater or under the four EMAs, and if we have a stoch signal, then we have an entry/exit condition.


N Day Pivot Moving Avg (WONTON GRP)This is a tool used by Fisher style traders. It allows the trader to set the pivot period (3 Days is default) and the moving averages of that pivot.
Provided by the Wonton Group.

Automatic Monthly Pivots with built-in Fibonacci LevelsClassic Floor Trader Pivots (algorithm decision points) with color segmented Fibonacci levels plotted in real-time Enjoy! Multi-variable Time Frame Pivots with Custom fib levels is in works.


Hybrid Pivot Zones [DW]This is an experimental study designed to identify potential areas of support and resistance using a hybrid between Camarilla and Fibonacci pivot calculations.
The levels are calculated by taking 110% of the previous interval's range multiplied by 8.33%, 16.67%, 25%, 50%, 61.8%, 78.6%, 100%, 127.2%, 141.4%, and 161.8%, then adding them above and below the interval open.
Custom bar colors are included.

Pivot Zones Trading RangesJust testing an advanced Pivot Zones display method with 12 different time frame options. Invite only.

Pivot alerts by Funded-TraderThis indicator draws Standard Pivot Levels on all products on all timeframes.
The P Pivot is included, and it goes as far as R3 and S3, as pivots 4 and 5 are rarely reached in the market.
This indicator differs from the "Standard Pivot" published by TradingView as this can be used to set-up an Alert: just add a new alert, pick "crossing" and in value pick "Pivot Alerts"
I have chosen a neutral colour Orange for all pivot levels.

HMA_PPT StrategyHMA_X & Pivot Profit Taker combo
LOL!
change the settings to suit your favorite pair/TF before cry yourself to sleep.
doesnt repaint? ----> YOU TELL ME :-D

Pivot Point Moving AveragesThis indicator contains two simple moving averages that is calculated from the pivot point rather than the closing price. This indicator is described in detail in chapter 6 of the book Candlestick and Pivot Point Trading Triggers: Setups for Stock, Forex, and Futures Markets by John L. Person.