Gann Planets vs SunGann Planets vs Sun
// ========================================================================//
the example above is set to ETH/USD block #1 date at 147 degrees Jupiter
This script helps you spot important events in the market using planetary lines. All you have to do is to input the planet natal degree from your desired date through any Emphemeris source.
This script includes settings to adjust the start and end date of the cycle and will auto calculate the planetary degree and plot its lines and plot the 4 quintiles for you as well.
This script also complements the Gann ToolBox that I have on my tradingview page giving you good measurement of the market and some of its volatility dates and locations in price.
// ========================================================================//
To get access to this add-on or for the full package including the toolbox you can see my information below.
Точки разворота

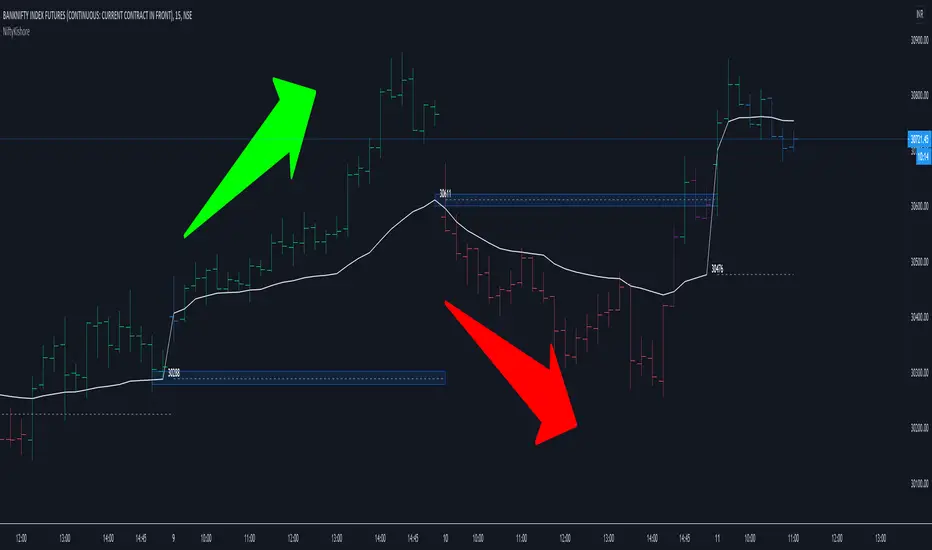
Vwap Pvwap Intraday Trend - NiftyKishoreHello Traders !!
This is a simple trend identification script which is based on the current vwap (Cvwap) and previous vwap (Pvwap).
Pvwap in the sense; previous day vwap closing value.
Bullish: price is closing above the current day vwap and previous day vwap(pvwap).
Bearish : Price is closing below the current day vwap and previous day vwap (pvwap).
Made a change to the barcolors as well :)
Bullish
Green Bar: close is above Pvwap and Cvwap.
Blue bar: close is above Pvwap but below Cwap.
Bearish
Red bar: close is below Pvwap and Cvwap.
Purple bar: close is below Pvwap but above Cvwap.
Simple but effective
Cheers !!
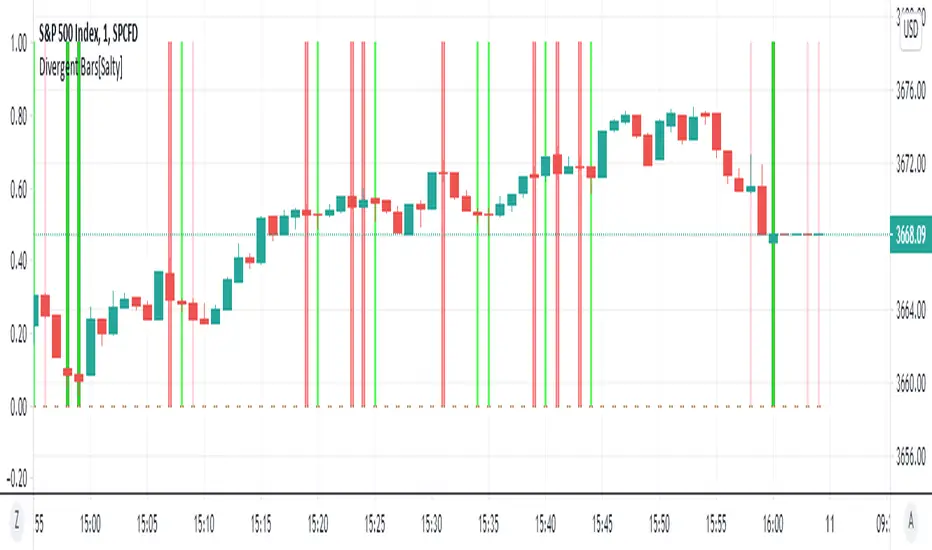
Divergent Bars[Salty]Updated an existing Divergent Bar script to be able to show all divergent bars. There are 2 set of divergent bars that can be turned on. The original one based on price and alligator lines, and a new second one that shows ALL divergent bars. The second set has lighter lines and colors to differentiate them from the filtered alligator divergent bars.
FlipSignalsFlipSignals is a TradingView indicator designed to help you make smarter, more efficient trading decisions by simplifying your trading. Specific symbols show up directly on price action to help you easily visualize trade setups and interpret market movement. The framework behind FlipSignals is systematic yet simple: First, establish a dominant trend with the Trend Level. Then, identify optimal entry points. With a complete understanding of FlipSignals you'll be able to confidently interpret and navigate any market with strong conviction.
Trend Level
The Trend Level is the step line that runs through price action and establishes a dominant directional trend, either green or red. When the Trend Level is green, buyers are in control and price action is bullish - suggesting buying pressure and higher prices. Conversely, when the Trend Level is red, sellers are in control and price action is bearish - suggesting selling pressure and lower prices.
During an uptrend, price action will trade above the Trend Level and use the Trend Level as support. Conversely in a downtrend, price action will trade below the Trend Level, which will act as resistance. When the Trend Level flat lines and flips from one color to another, this signals that price action is resting and could potentially indicate that the trend is shifting or consolidating for a continuation move.
The Trend Level can also be used as a trail stop level when you are in a position. For example, if you are long when the Trend Level is green and stair stepping higher, you can incrementally place your stop right below the Trend Level as price action increases in order to protect your unrealized profit.
Momentum Shifts - ShiftUp / ShiftDown
Small blue and orange triangles indicate short term momentum shifts in price action. When momentum shifts upwards, a small blue up triangle will appear below the candle and when momentum shifts downwards, a small orange, down triangle will appear above the candle.
ShiftUp and ShiftDown signals generally confirm short term tops/bottoms although consecutive momentum shifts within a short period of candles can indicate consolidation and stalled price action.
Buy/Sell XOB/XOS Levels
FlipSignals’ algorithm calculates a sentiment score that measures the net buying and selling in any given market. This score oscillates above and below zero identifying extended buying and selling pressure. A positive score indicates that buyers are in control whereas a negative score signals that sellers are in control.
FlipSignals generates buy and sell level Dot Clusters and Extreme Overbought/Oversold (XOB/XOS) symbols based on the sentiment score to easily visualize overextended buying or selling directly on price action candles.
Dot Clusters - Buy/Sell Levels
FlipSignals allows users to set 3 buy and 3 sell levels to determine when dot clusters will appear. Dot clusters will appear when sentiment score breaches each level.
Buy level dot clusters will appear below candles indicated by yellow and green circles, while sell level dot clusters will appear as yellow and red circles above candles.
Generally, dot clusters indicate that price action is extended one way or the other. Notice that buy dot clusters appear below the Trend Level while sell dot clusters appear above the Trend Level for the majority of the time.
Extreme Overbought/Oversold Signal
Extreme Overbought (XOB) signals will appear as neon green X's above the candle indicating price action has entered extreme overbought levels. Typically, XOB signals serve as a warning that prices could continue higher.
Extreme Oversold (XOS) signals will appear as red X's below the candle indicating price action has entered extreme oversold levels. Typically, XOS signals serve as a warning that prices could continue lower.
Generally, sentiment scores of +/-4 are considered extreme readings although this can vary by asset. User defined inputs of buy/sell and XOB/XOS levels determine when signals will appear.
Additional Support/Resistance Indicators Include:
VWAP
3 EMAs
3 SMAs
Weekly Pivot Points
Monthly Pivot Points
Quarterly Pivot Points
Previous Day OHLC
Please use the link below to our website to obtain access to this indicator.

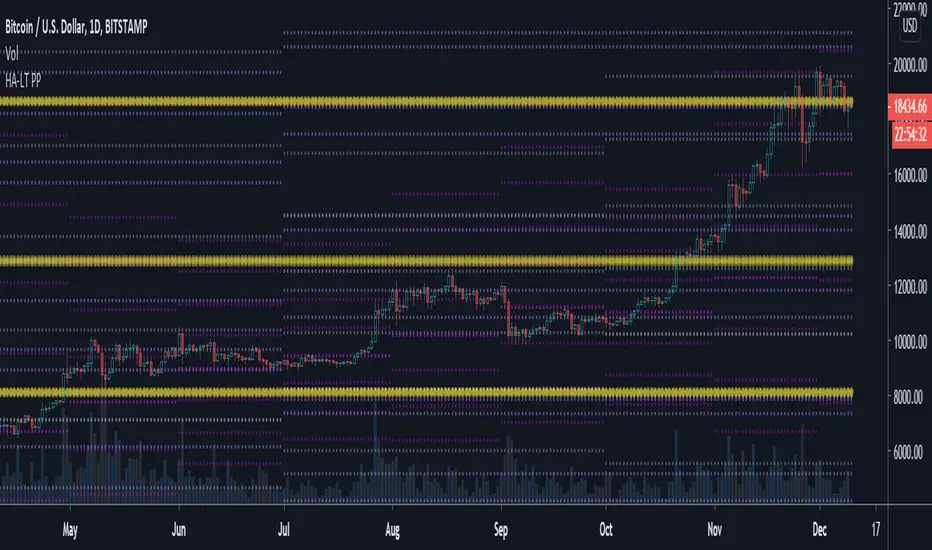
Heikin Ashi Pivot PointsPivot points are price levels that are calculated based on previous high, low, and close values. Pivot point levels include the pivot, 4 resistance levels (R1, R2, R3, R4), and 4 support levels (S1, S2, S3, S4). Pivot points are used as support and resistance levels.
This indicator includes the following pivot points:
6M (6 month)
Yearly
Weekly HA (Heikin Ashi)
Monthly HA (Heikin Ashi)
Quarterly HA (Heikin Ashi)
6M HA (6 month Heikin Ashi)
Yearly HA (Heikin Ashi)
Pivot point with CPR, historical, high low and openThis script generates pivot points up to 10 level with CPR levels for Daily, Weekly, Monthly & Yearly
along with resolution for Daily, Weekly, Monthly & Yearly
along with High, low and close for that resolution
can check historical levels for the resolution as well.
the pivot auto adjusts even when you change the chart pattern to heikin ashi, renko or any other.. unlike system pivot.
change the time frame & resolution to required setting like
"Daily" & "D"
"Weekly" & "W"
"Monthly" & "M"
"Yearly" & "12M"

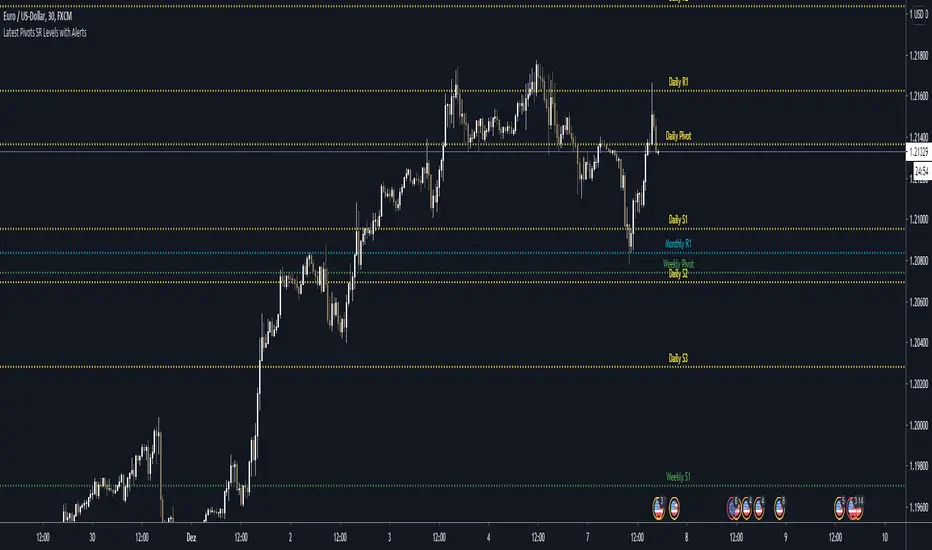
Latest Pivots SR Levels with Alerts<<< English Description >>>
Hello Traders
This script displays the classic pivot levels (also called floor pivots) as continuous lines on the chart. One special feature is that only the current pivots and SR values are displayed.
Another special feature of this script is, it allows you to set alarms on any pivot and S/R level. With the setting explained below you can configure the alarms to come before the level is reached, so you have more time to react.
The script optionally displays the following pivot points and the corresponding S1-S3 and R1-R3 levels
- Daily Pivot & S/R Levels
- Weekly Pivot & S/R Levels
- Monthly Pivot & S/R Levels
I would like to point out that this indicator alone is not sufficient as a trade decision! It should be a supporting factor to provide additional confirmation to chart analysis and/or price action and other analysis methods.
I would like to briefly explain the following settings:
- "Horizontal Offset in Candles (Label)"
Moves the labels horizontally either to the left or right, starting from the current price. This setting is useful so that the labels are not exactly at the level of the current price.
- "Vertical Offset in Candles (Label)"
Moves the labels horizontally either up or down, starting from the current price.
- "Close/Near To (in Ticks)"
Controls when the alarms are triggered. Here you can set that the alarm is already triggered when the price is for example 100 ticks away from the current price. Ticks are always the smallest possible unit and can be looked up for each symbol
Write me a private message to get access or if there are still questions about the usage!
<<< Deutsche Beschreibung >>>
Hallo Traders
Dieses Skript stellt die klassischen Pivot-Levels (auch Floor-Pivots genannt) als durchgehende Linien auf dem Chart dar. Speziell ist das nur die aktuellen Pivots und SR Werte dargestellt werden.
Eine weitere Besonderheit dieses Skripts ist, dass es Ihnen erlaubt, Alarme auf jedem Pivot- und S/R-Level einzustellen. Mit der unten erläuterten Einstellung können Sie die Alarme so konfigurieren, dass die Alarme vor Erreichen des Levels kommen, so dass Sie mehr Zeit zum Reagieren haben.
Das Skript stellt wahlweise die folgenden Pivots-Points und die dazugehörigen S1-S3 und R1-R3 Levels dar.
- Daily Pivot & S/R Levels
- Weekly Pivot & S/R Levels
- Monthly Pivot & S/R Levels
Ich möchte darauf Hinweisen das dieser Indikator alleine nicht als Trade-Entscheidung ausreicht! Er soll ein unterstützender Faktor sein, um eine zusätzliche Bestätigung zur Chart-Analyse und/oder Price-Action und anderen Analysemethoden zu bieten.
Folgende Einstellungen möchte ich kurz erläutern:
- "Horizontal Offset in Candles (Label)"
Verschiebt die Label horizontal entweder nach Links oder rechts, ausgehend vom aktuellen Preis. Diese Einstellung ist nützlich damit die Labels nicht genau auf dem Level vom aktuellen Preis sind.
- "Vertical Offset in Candles (Label)"
Verschiebt die Label horizontal entweder nach oben oder unten, ausgehend vom aktuellen Preis.
- "Close/Near To (in Ticks)"
Steuert wann die Alarme getriggert werden. Hier kann eingestellt werden das der Alarm bereits kommt wenn der Preis zum Beispiel 100 Ticks vom aktuellen Preis entfernt ist. Ticks sind immer die kleinst mögliche Einheit und könne für jedes Symbol nachgeschaut werden
Schreiben Sie mir eine Private Nachricht, um Zugang zu erhalten oder wenn noch Fragen zur Nutzung offen sind!
Institutional PivotsToday I propose a novel idea of plotting pivots, this can be also considered as Value areas/Noise areas.
*What is it?
Its a simple concept of gauging price action with respect to its most time spent in a particular range, this is usually denoted as Value area in the Market profile concept, where that "most" word is represented by 70% of the price action.
*What's different from the Market Profile?
Market profile is dependent on real time price movement to complete to see the value area or noise area to plot a static area, there is always a possibility of it shifting as price may move outside of it, and hence its called "developing value area", till of course session is closed and plot is finalized.
While that method is solid indication of "actual price profile" development, it lacks when it comes to offering traders a more stable view to enable them to make decisions. And therefor, when traders trade MP they are usually limited by the number of trades they can take.
This is the main reason as to why traders prefer to use other methods like Pivots/ORB/Range-breakouts over pure MP charts, even though latter reduces the possibility of wrong estimations of "support/resistance working/holding".
*Why the name Institutional Pivots?
In my research I've found that these Pivots/Value area/Noise area ranges are often the areas watched by the big players who trade breakouts or mean reversion strategies, so while that name may sound dubiously clickbaity, it is indeed intended to represent an observation. I know how that sounds, but you can choose to ignore it if you do not agree or see good results after using it. After all, its free to use for everyone.
*Nomenclature/colors and settings?
Noise area/Value area/Central Pivot area - Designated with Yellow labels, in which NU represents the Upper level and ND represents the Lower level
Targets - Target calculation mechanism is based on " today's price action" and today's Open, D1 and D2 represent down targets for the day and U1 and U2 represent upper targets. Please note that this is independent of the "Noise area/Value area/Central Pivot area", so overlap of levels is possible. AND if overlap happens, that's an indication of more strength at S/R line/area for the price.
One more thing to note here is that if there is formation of the new low or new high in the day, those levels will change as their calculation gets influenced by the same. This is NOT a repaint issue, this is SHIFT/FORMATION OF THE NEW levels and it's an "intended" behavior.
Open and POpen - Open represents open of the time-frame selected and POpen represents previous open of the time-frame.
Lable's starting with "H" are indicating higher Timeframe levels, levels which are same as above.
ATR based targets - When you enable this in settings, you will get target calculation based on ATR (self explanatory)
Full ATR mode - When you enable this option, you will get both Noise area as well as targets based on ATR, please don't forgot to turn off the ATR based targets when you enable this, as they conflict with each other.
I've not kept lines, area plots or even price levels as I feel it's just noise and takes away from the indicators main focus, please don't ask to add them, I'll not.
This is meant as purely educational idea, if you use this to trade, it is at your discretion and responsibility will be yours alone.
Past performance is not assurance of the future performance.
More example chart/s

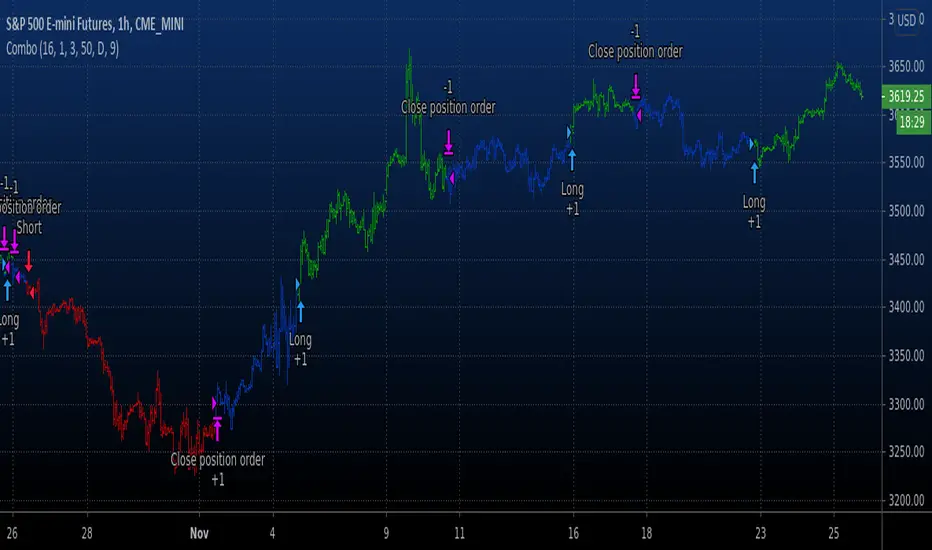
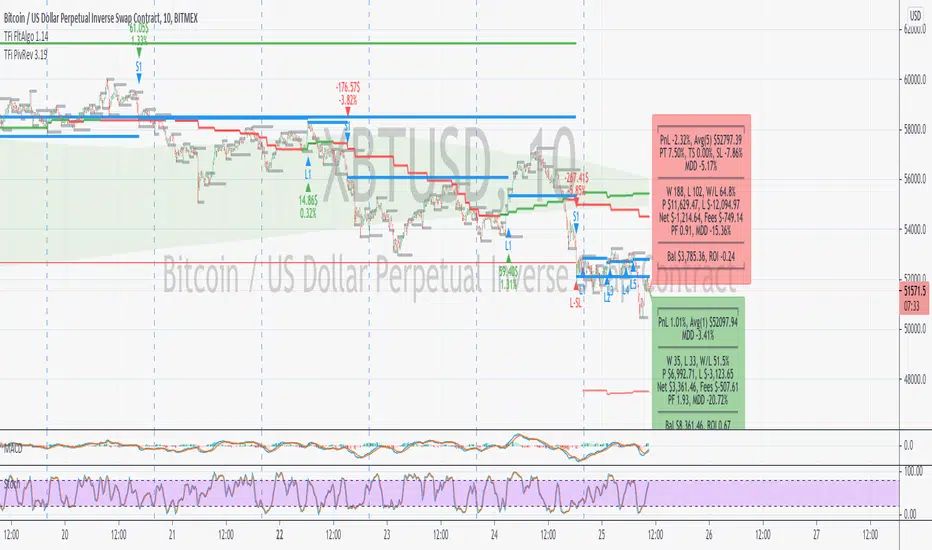
TFi Pivot Reversal V3The Pivot Reversal Study uses pivot points to create a support and resistance level; based on this levels the script creates virtual stop-market orders to catch the trend if the price is crossing the pivot lines.
A "Pyramiding" input allows to configure up to 3 entries; the script enters an additional position if the price falls by a configurable percentage amount (long), the reverse to short orders.
A configurable profit-target and stop-loss is being used to exit an open position.
An optional Moving Average filter can be used to enable only long or short positions.
The script renders a status box at the last bar, which shows the current position status and result of the built-in trading simulation results.
It shows the following statistic values:
current position PnL - also background turns green if position is in profit and red if in loss
the percentage distance to the profit-target and stop-loss level
the overall number of wins and losses and the win/loss ratio
the overall profit and loss amount (assuming a quantity of 1)
the net-profit and profit-ratio
For the correct simulation of entry/exit prices, the script contains inputs for a percentage entry and exit slippage.
The study also creates configurable alerts, which follow the exact position of the entry/exit markers. The default alert messages contain trading instruction to execute orders via Alertatron; but the message content can be replaced if configuring the alert in the Tradingview environment.
The script was mainly backtested with crypto-coins, e.g. XBTUSD at 15min timeframe. But the script also works with any other type of security and timeframe.
How to access
This strategy is a "Invite Only" script. You can can subscribe or purchase the strategy; please use the link below or send me a message via Tradingview to obtain access to the strategy and study script.
For enabling the script in your Tradingview chart window, click on "Indicators" and select "Invite-Only Scripts".
Full list of alerts
'Alertatron Exit' ... Exit all open positions.
'Alertatron Enter Long' ... Enter long position, w/o stop-loss being used.
'Alertatron Enter Short' ... Enter short position, w/o stop-loss being used.
'Alertatron Enter Long SL' ... Enter long position, w/ stop-loss being used.
'Alertatron Enter Short SL' ... Enter short position, w/ stop-loss being used.
Full list of parameters
"Pivot Left Bars" ... Number of bars on the left of the pivot point - used for pivot /peak detection.
"Pivot Right Bars" ... Number of bars on the right of the pivot point - used for pivot /peak detection.
"MA Filter Fast" ... Moving Average filter fast period.
"MA Filter Slow" ... Moving Average filter slow period.
"Profit Target Option" ... Configure the profit-target either as a fix percentage value or an ATR.
"Profit Target " ... Fix percentage profit-target.
"Profit ATR Period" ... ATR profit-target period.
"Profit ATR Factor" ... ATR profit-target factor/multiplier.
"Stop Loss Option" ... Configure the stop-loss either as a fix percentage value or disable the stop-loss completely.
"Stop Loss " ... Fix percentage stop-loss.
"Rebuy Loss " ... Percentage loss of the initial position before script enter a nw position in the same direction.
"Pyramiding" ... Maximum number of positions.
"Show MA Plots" ... Show/hide Moving average plots.
"Slippage Entry " ... Percentage slippage for entering a position.
"Slippage Exit " ... Percentage slippage for exiting a position.
"Statistic Label" ... Defines the position of the statistic label relatively to the last bar in the chart.
"Backtest Start" ... Backtest start time; area outside this timeframe will be grayed out.
"Backtest Stop" ... Backtest stop time; area outside this timeframe will be grayed out.
"Backtest Mode" ... Closes the currently opened position if chart switches to last bar; please only enable if backtesting, otherwise it leads to unwanted alerts.
RSI Multi Time FrameHello Traders,
Recently we got new features in Pine such Arrays of Lines, Labels and Strings. Thanks to the Pine Team! ( here )
So I decided to make new style of Multi Time Frame indicator and I used Array of Lines in this script. here it is, RSI Multi Time Frame script. it shows RSI for current time frame as it is and also it gets RSI for the Higher Time Frame and converts it and shows it as in time frame. as you can see, RSI for HTF moves to the right on each candle until higher time frame was completed.
You have color and line width options for both RSI, also if you want you can limit the number of bars to show higher time frame RSI by the option " Number of Bars for RSI HTF ", following example show RSI HTF for 100 bars.
Most of you know that old style Multi Time Frames indicators was like:
Hope you like this new Multi time frame style ;)
Enjoy!

Swing Reversal IndicatorSwing Reversal Indicator was meant to help identify pivot points on the chart which indicate momentum to buy and sell. The indicator uses 3 main questions to help plot the points:
Criteria
Did price take out yesterday's high or low?
Is today's range bigger than yesterday? (Indicates activity in price)
Is the close in the upper/lower portion of the candle? Thus, indicating momentum in that direction
This indicator was built to help me find pivot points for directional options trading however can be used for equities and forex swing trading and other strategies. Used in conjunction with a BB extreme can provide good setups.
Alerts are available for both the long and the short positions and the indicator will repaint as price moves.
The character Plotted can be changed in the settings
The size of the candle area can be changed as well if you want to tighten/loosen the trigger points based on the third question above.

Adoptive Supertrend - PivotsAnother experiment with Supertrend by making use of pivot point high/lows.
Trailing Stop types used in this indicator are:
ATR - plain ATR based supertrend
Breakout - ATR based supertrend combined with breakout. (Trailing triggered only if price change is higher than HighPriceChange multiplier times ATR.
Pivot Points - Trail only when new pivots created. Pivot stop multiplier is used below pivot low.
Combined - Combine everything together

Socrates Reversals PlotterSOCRATES Reversals Plotter
Introduction
This script is intended for users of the Socrates platform. This is located on ask-socrates.com which is property of AE Global Solutions, Inc.
Background
It is cumbersome to track the reversal system on the proprietary platform especially when users want to combine it with real-time data on TradingView. Some active reversals, especially those on the daily level change quite often and updating the charts regularly takes a lot of time. Therefore I've created this script primarily for the following reasons:
Simplify the process of keeping the charts updated
Standardize the look of the graphs so that they can be quickly understood when shared with other users for studying purposes and discussions
Features
v1.0 (20201203)
Add up to 5 daily/weekly/monthly reversals which will plot and format automatically
Easily hide daily/weekly/monthly reversals as a group
Highlight the range of a given unit of reversals. This takes the values of the lowest bullish and highest bearish reversals. They are expected to be written in #01 fields
Don't forget to use the option to "Save As Default" at the bottom of the Inputs tab. This will make sure all your reversals are stored even if you remove the indicator from your graph

Gann Seasonal Dates V1.1Gann Seasonal Dates
// ========================================================================//
This script helps you spot important events in the market using Gann seasonal dates and cycles
This script inludes 4 major seasonal dates and 6 minor seasonal dates. All of which are very powerful if you are a time trader.
This script also complements the Gann ToolBox that I have on my tradingview page giving you good measurement of the market and some of its volatility dates.
// ========================================================================//
To get access to this add-on or for the full package including the toolbox you can see my information below.

Gann Toolbox V1.5Gann ToolBox V1.5
// ========================================================================//
This script is meant to save you a lot of time plotting your Gann Boxes and Cycles correctly and accurately.
It allows you to scale your boxes and square them based on $ per degree.
It includes a few default cycles already built into into and an advance mode that lets you box the box anywhere you want through any time period you want.
You get the 1:1, 1:2, 2:1 Gann fan angles at each corner of the box and some additional angles at the midpoint to give you a complete star formation.
Using the Advance mode you can also adjust the length of your custom cycle and the global height increments. Default is 360degrees.
You can also play with offset values for your cycles.
That's not all, you also get to plot your horizontal lines between each cycle at an increment of your choosing.
Using this script you will be able to plot any cycle you want with a few clicks. And get your planetary lines and cycles quickly.
This script work with all the assets correctly and beautifully
Examples :
// ========================================================================//
This script comes with "Gann Seasonal Dates" as an add-on if you decide to purchase it.
// ========================================================================//
My contact information are available and listed below.
Enjoy!

Excellent ADXThe Average Directional movement indeX (ADX) is an indicator that helps you determine the trend direction, pivot points, and much more else! But it looks not so easy as other famous indicators. It seems strange or even terrible, but don't be afraid. Let's understand how it works and get its power into your analysis tactics.
In the beginning, imagine a drunk man goes through a ladder: step by step. Up, up, down, up, down, down, up...
How can we understand which direction he goes? Exactly! We can count the number of steps in each direction. In the above example, in the upward – 4, in the downward – 3. So, it looks like he goes in an upward direction.
The ADX indicator counts the same steps, but for price. The size of each step equals 1 ATR for "DI Length" candles. On the indicator chart, we have the green and red lines. The green line represents a number of steps upward. The red line shows one downward. When the red line upper green, then the price goes below, then the trend is directed down. Later the green line comes above the red one, and then the trend changes the direction to upward. Wow? After that, you can easy detect the trend direction on the market!
But it is still not the end. On the chart, we also have the fat blue line. This is the ADX line, and it represents the power of the trend. It is calculated from a distance between the green and red curves. The ADX line value grows if the distance is increased. If the movement is really powerful, then a number of steps into a direction much more prominent than one in an opposed direction. Then the blue line grows faster. But if the growth has stopped and the blue line turns back or already had changed self-direction, then it is a signal that the trend has ended too. It's an excellent sign to close the position (but not always). Easy? Not quite. Thresholds help you there. The indicator has two additional parameters: upper and lower thresholds to evaluate the trend-over signal strength. An u-turn of the ADX line above the upper threshold sends a strong signal. If one occurs between both thresholds, it is a bit weak signal. But if the blue line goes below the lower threshold, it looks like there is no trend, and the price goes side. We can also say that the price goes side when the ADX value gradually falls down.
The Excellent ADX indicator helps you catch pivot/pullback signals based on green, red, and blue lines. Each such signal is highlighted as a green (buy) or red (sell) dot on the plot. The size of the dot represents the strength of the signal. You can also check the position of green and red lines from each other to determine the trend direction and the place where it has been changed. The Excellent ADX indicator helps you there too. It highlights the trend direction by the background-color, so you'll never miss it! The Excellent ADX good compliance with the Price Channel indicator built for the same length. You can use them together to be on a trend wave always!

Pivot Support / Resistance Finder [JV] Hi Traders,
this is the result of the many feedback messages I received about this first draft of this script. It has significant updates:
The use of Arrays.
Using PineCoders Coding Conventions for Pine: www.pinecoders.com
Display up to 6 Support / Resistance levels.
Line colors and Labels change according to their status (Support or Resistance).
Moved Labels to the future for better overview of the Prices / Levels.
There are many configurable options. Feel free to explore them all.
If you should notice a bug or something of a kind, feel free to contact me.
All feedback is very welcome as well.
Request might be considered but don't take them for granted please.
Pivot Points
Pivot Points are considered to be levels which may become significant levels (Support / Resistance) in the future. They can be interpreted in various ways, but fact is that price, when it comes close to a previous Pivot Point, can mess with your head. Prices often returns to previous Pivot Points, more than once even a few times, as shown below.
I hope you find this useful.
Happy Trading!

BuyHighSellLow - Pivot pointsAnother version of buy-high sell-low strategy. This time using pivot points.
Strategy is simple:
Buy when price closes above R1 of pivot point level
Sell when price closes below S2 of pivot point level.
Use Resolution parameter to define pivot points. Higher the resolution, longer the trade time will be. If resolution is set to same as symbol, strategy will consider Higher Timeframe Multiplier to derive pivot point resolution.
Uncheck HideBands to see bands created from pivot points.
Another Buy-High Sell-Low strategy published is using donchian channel (Link below)

Evan Cabral's Quarter Theory by MrTuanDoanThis indicator is based on Evan Cabral's Market Timing Strategy.
In Binary Option or High Frequency Forex (HFX), it's very common to see the market make reversals at hours and half hours.
This indicator just simply draw vertical lines at each quarter of the hour.
You should change the color and opacity to fit your chart style.
With this indicator, you're going to know when to positions yourself with more accuracy on trade setups.
Note
It works best if you take your reversal trade at the top of the hour using your other (overbought/oversold) confirmation using RSI, Stoch RSI, DMI, etc.
It works better if you take your trade at resistance/support zones
You should pay attention to the direction the market is going before the hour (or half hour) and looking at how the direction changes going into the hour or after it.
Please backtest before taking real trades

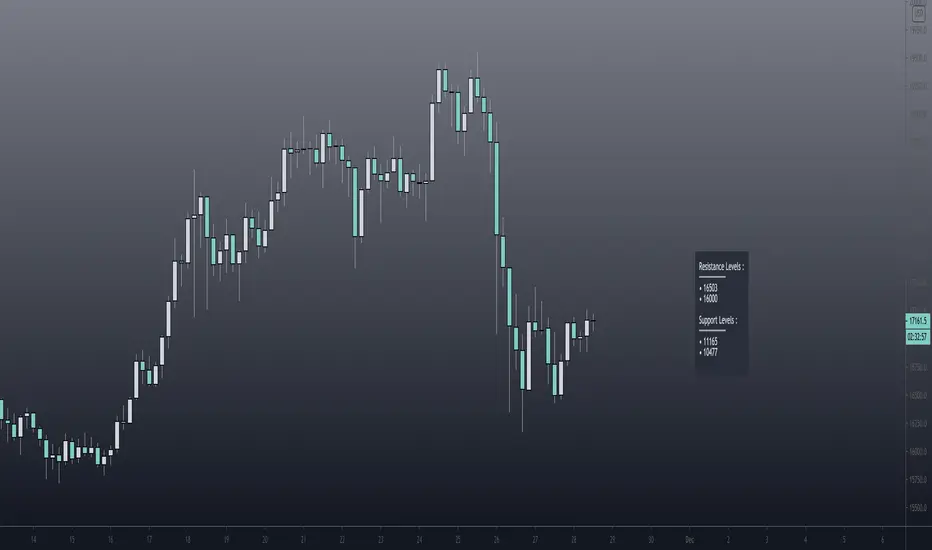
Pivot Support / Resistance Panel [JV]Hello Traders,
First all of thanks to LonesomeTheBlue for making me grasp arrays, a wonderful addition to Pine Script.
This indicator uses arrays to find Pivot Points and mark them as Support / Resistance.
It displays an info panel with the latest values.
This code was written using the following standards:
• PineCoders Coding Conventions for Pine: www.pinecoders.com
Configurable options:
Up to 6 Support / Resistance Levels.
Pivot Lookback Period.
Panel Color.
Text Color.
Panel Offset.
Panel Size.
Enjoy!
GBTC Fomo Panic PremiumIt is rumored that GBTC price action leads the Bitcoin market. This indicator compares GBTC fomo/panic levels to the (Binance) BTC spot market. Fomo is measured as large percentage moves of the high price from the min over a look-back period. Panic is measured as large percentage moves of the low price from the max over a look-back period. A prime example of this indicator's usage would be as a sell signal confirmation during the 2020 pre-Thanksgiving panic exhibited on the 1-hour chart while the 20 EMA was still above the 99 SMA.
You can customize the leading and lagging markets and the length of the lookback period. I would love to hear what parameters, markets and timeframes work for you. Maybe there is a way to leave comments, or hit me up on Twitter: @thirdreplicator
May you profit and enjoy.

BBofVWAP with entry at Pivot PointThis strategy uses BB of VWAP and Pivot point to enter and exit the Long position.
settings
BB length 50
BB Source VWAP
Entry
When VWAP crossing up BB midline and price/close is above weekly PivotPoint ( you can also use Daily pivot point )
Exit
When VWAP is crossing down BB lower band
Stop Loss
Stop loss defaulted to 5%
Note : Long will position will be exited on either VWAP crossing down BB lower band or stop loss is hit - whichever comes first . Being said that some time your stop loss exit is less than 5% which saves from more losses.
Entry is based on weekly Pivot point , so any time frame below weekly will work perfect. I have tested t on 30 min , 1 HR , 4 Hr , Daily charts. Even weekly setting shows good results , that will work for long term investing style.
if you change Pivot period to Daily , chose time frames below Daily.
I also noticed this strategy mostly do not enter Long position in a down trend. Even it finds one , it will be exited with minimal loss.
Warning
For the use of educational purposes only

Combo Backtest 123 Reversal & High and Low Levels This is combo strategies for get a cumulative signal.
First strategy
This System was created from the Book "How I Tripled My Money In The
Futures Market" by Ulf Jensen, Page 183. This is reverse type of strategies.
The strategy buys at market, if close price is higher than the previous close
during 2 days and the meaning of 9-days Stochastic Slow Oscillator is lower than 50.
The strategy sells at market, if close price is lower than the previous close price
during 2 days and the meaning of 9-days Stochastic Fast Oscillator is higher than 50.
Second strategy
This script shows a high and low period value.
Width - width of lines
SelectPeriod - Day or Week or Month and etc.
LookBack - Shift levels 0 - current period, 1 - previous and etc.
WARNING:
- For purpose educate only
- This script to change bars colors.