PivotX# PivotX - TradingView Description
## Title
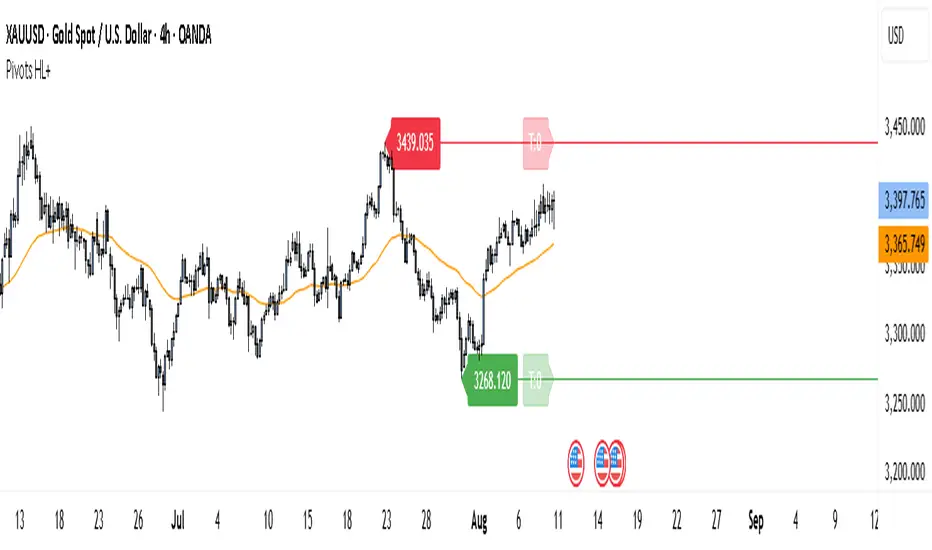
PivotX - Exhaustion & Pivot Detection
## Description
**PivotX** is a powerful visual indicator that helps traders identify when major buying or selling pressure has exhausted and when significant market reversals are likely to occur. Think of it as your market "exhaustion detector" that spots the exact moments when one side of the market runs out of steam.
### What Does PivotX Do?
PivotX watches for three critical market conditions:
1. **Selling Exhaustion** - When sellers have pushed price down aggressively but can't push it lower anymore. This is when buyers step in and price often reverses upward.
2. **Buying Exhaustion** - When buyers have pushed price up aggressively but can't push it higher anymore. This is when sellers step in and price often reverses downward.
3. **Major Pivot Points** - Key price levels where the market has made significant turns, marking important support (bottoms) and resistance (tops).
### How It Works (Simple Explanation)
Imagine a tug-of-war between buyers and sellers:
- When sellers are winning (price dropping), PivotX watches for when they get tired
- When buyers are winning (price rising), PivotX watches for when they get tired
- When one side gets exhausted, the other side usually takes over - that's when reversals happen!
PivotX uses multiple signals to confirm exhaustion:
- Volume patterns (when trading activity slows down after a big move)
- Price stabilization (when price stops moving in one direction)
- Absorption patterns (when high volume doesn't move price much - someone is absorbing the pressure)
- Support/Resistance levels (when price bounces off key levels)
### Visual Signals
**Green X Markers** (Below Price)
- Appears when selling has exhausted
- Buyers are stepping in
- Potential upward reversal signal
**Red X Markers** (Above Price)
- Appears when buying has exhausted
- Sellers are stepping in
- Potential downward reversal signal
**Yellow Diamonds**
- Marks major pivot points (support/resistance)
- Shows where significant price turns occurred
- Helps identify key levels for future trades
**Neon Green/Red Lines**
- Support lines (green) - where price found a bottom
- Resistance lines (red) - where price found a top
- These levels often act as future support/resistance
### Best Use Cases
✅ **Swing Trading** - Catch reversals at major pivot points
✅ **Scalping** - Enter trades when exhaustion is confirmed
✅ **Trend Following** - Identify when trends are losing steam
✅ **Support/Resistance Trading** - Use pivot lines as key levels
✅ **Reversal Trading** - Enter counter-trend trades at exhaustion points
### Settings Explained
**Detection Settings:**
- **Lookback Period** - How many bars to analyze (default: 20)
- **Volume Threshold** - Minimum volume spike to consider (default: 1.5x average)
- **Exhaustion Periods** - Bars to check for exhaustion signals (default: 3)
- **Min Price Move %** - Minimum price movement to trigger analysis (default: 2%)
**Pivot Detection:**
- **Pivot Strength** - Bars on each side for pivot confirmation (default: 3)
- Higher = fewer but stronger pivots
- Lower = more but weaker pivots
**Visual Settings:**
- Toggle exhaustion markers, pivot points, and support/resistance lines
- Customize colors to match your chart theme
### Pro Tips
1. **Wait for Confirmation** - PivotX requires multiple signals before showing exhaustion. This reduces false signals but means you might miss some early entries.
2. **Combine with Price Action** - Use PivotX signals with candlestick patterns for stronger confirmation.
3. **Watch the Pivot Lines** - The support/resistance lines often act as key levels. Price bouncing off these lines can be strong reversal signals.
4. **Volume Matters** - The indicator is more reliable when volume patterns confirm the exhaustion signals.
5. **Timeframe Flexibility** - Works on all timeframes, but signals on higher timeframes (4H, Daily) tend to be more reliable.
### What Makes PivotX Unique?
Unlike simple pivot indicators, PivotX combines:
- Volume exhaustion analysis
- Price action confirmation
- Multi-signal validation
- Clean, non-intrusive visualization
- Automatic support/resistance line drawing
This multi-layered approach helps filter out noise and focus on high-probability reversal setups.
### Important Notes
⚠️ **Not Financial Advice** - This indicator is a tool, not a guarantee. Always use proper risk management.
⚠️ **No Indicator is Perfect** - PivotX helps identify potential reversals, but markets can be unpredictable. Always use stop losses.
⚠️ **Combine with Other Analysis** - For best results, use PivotX alongside other technical analysis tools and your trading strategy.
### Support
If you find PivotX helpful, please consider leaving a like and sharing your feedback. Your support helps improve the indicator for everyone!
---
**Happy Trading! 🚀**
*Remember: The best traders don't just follow signals - they understand what the signals mean and how to use them in their overall trading strategy.*
Pivotstrategy

wedge hunter (Buy - Sell) signalsthis indicator can work on different options like forex and stock markets(shares).
this indicator watching charts for highs and lows and search for squeeze and pıvots for finding entrıes. i try to help to community for understand the formations and easly find an entry point. with rsi confirmation you find the best entry locations

Pivot Hourly x EMA RibbonHourly Fibonacci Pivot + EMA is an intraday analysis tool that combines hourly Fibonacci-based pivot levels with exponential moving averages (EMAs). It is designed to help traders visualize potential intraday support/resistance zones and short-term trend direction on any timeframe.
The indicator calculates pivot levels from hourly price data and then projects Fibonacci extensions and retracements around a central pivot. These levels can be used to see where price has previously reacted and where future reactions may occur. The EMAs provide an additional layer of context by highlighting the prevailing short-term trend and momentum.
Key features:
Hourly Fibonacci pivot levels (support and resistance zones derived from hourly ranges)
Multiple Fibonacci bands to show potential reaction areas above and below the central pivot
One or more configurable EMAs to show short-term trend direction and dynamic support/resistance
Works on all symbols and intraday timeframes supported by TradingView
Typical use:
Monitor how price behaves when approaching or rejecting Fibonacci pivot levels
Look for confluence between pivot zones and EMA direction or EMA bounces
Use the levels as potential areas of interest for trade planning, stop placement, or partial profit zones within your own trading system
Also have "C" Label it's mean Candle for example C1 is First Candle of the source timeframe, if the source timeframe set to 4 Hour it will be the first 4h candle, the C2 is the second 4h candle of the day.
This script is intended purely as a technical analysis tool and does not generate buy/sell signals or guarantee any particular outcome. It is not financial advice. Always combine it with your own analysis, risk management, and trading plan before making any trading decisions.

Multi Pivot Trend [BigBeluga]🔵 OVERVIEW
The Multi Pivot Trend is an advanced market-structure-driven trend engine that evaluates trend strength by scanning multiple pivot breakouts simultaneously.
Instead of relying on a single swing length, it tracks breakouts across ten increasing pivot lengths — then averages their behavior to produce a smooth, reliable trend reading.
Mitigation logic (close, wick, or HL2 touches) controls how breakouts are confirmed, giving traders institutional-style flexibility similar to BOS/CHoCH validation rules.
This indicator not only colors candles based on trend strength, but also extends trend strength and volatility-scaled projection candles to show where trend pressure may expand next.
Pivot breakout lines and labels mark key changes, making the trend transitions extremely clear.
🔵 CONCEPTS
Market trend strength is reflected by multiple pivot breakouts, not just one.
The indicator analyzes ten pivot structures from smaller to larger swings.
Each bullish or bearish pivot breakout contributes to trend score.
Mitigation options (close / wick / HL2) imitate smart-money breakout confirmation logic.
Trend score is averaged and translated into colors and extension bars.
Neutral regime ≈ weak trend or transition zone (trend compression).
🔵 FEATURES
Multi-Pivot Engine — tracks 10 pivot-based trend signals simultaneously.
Mitigation Modes :
• Close — breakout requires candle close beyond pivot
• Wicks — breakout requires wick violation
• HL2 — breakout confirmed when average (H+L)/2 crosses level
Dynamic Color System :
• Blue → confirmed bullish rotation
• Red → confirmed bearish rotation
• Orange → neutral / transition state
Breakout Visualization — draws pivot breakout lines in real-time.
Trend Labels — prints trend %.
Trend Volatility-Scaled Extension Candles — ATR/trend strength based candle projections show momentum continuation strength.
Gradient Pivot Encoding — higher pivot lengths = deeper structure considered.
🔵 HOW TO USE
Use strong blue/red periods to follow dominant structural trend.
Watch for color transition into orange — possible trend change or consolidation.
Pivot breakout lines help validate structure shifts without clutter.
Wick mitigation catches aggressive liquidity-sweep based breaks.
Close/HL2 mitigation catches cleaner market structure rotations.
Extension bars visualize trend pressure — large extensions = strong push.
Best paired with volume or volatility confirmation tools.
🔵 CONCLUSION
The Multi Pivot Trend is a structural trend recognition system that blends multiple pivot breakouts into one clean trend score — with institutional-style mitigation logic and volatility-projected trend extensions.
It gives traders a powerful, visually intuitive way to track momentum, spot trend rotations early, and understand true structural flow beyond simple MA-based approaches.
Use it to stay aligned with the dominant swing direction while avoiding noise and false flips.

Trend Pivots Profile [BigBeluga]🔵 OVERVIEW
The Trend Pivots Profile is a dynamic volume profile tool that builds profiles around pivot points to reveal where liquidity accumulates during trend shifts. When the market is in an uptrend , the indicator generates profiles at low pivots . In a downtrend , it builds them at high pivots . Each profile is constructed using lower timeframe volume data for higher resolution, making it highly precise even in limited space. A colored trendline helps traders instantly recognize the prevailing trend and anticipate which type of profile (bullish or bearish) will form.
🔵 CONCEPTS
Pivot-Driven Profiles : Profiles are only created when a new pivot forms, aligning liquidity analysis with market structure shifts.
Trend-Contextual : Profiles form at low pivots in uptrends and at high pivots in downtrends.
Lower Timeframe Data : Volume and close values are pulled from smaller timeframes to provide detailed, high-resolution profiles inside larger pivot windows.
Adaptive Bin Sizing : Bin size is automatically calculated relative to ATR, ensuring consistent precision across different markets and volatility conditions.
Point of Control (PoC) : The highest-volume level within each profile is marked with a PoC line that extends until the next pivot forms.
Trendline Visualization : A wide, semi-transparent line follows the rolling average of highs and lows, colored blue in uptrends and orange in downtrends.
🔵 FEATURES
Pivot Length Control : Adjust how far back the script looks to detect pivots (e.g., length 5 → profiles cover 10 bars after pivot).
Pivot Profile toggle :
On → draw the filled pivot profile + PoC + pivot label.
Off → hide profiles; show only PoC level (clean S/R mode).
Trend Length Filter : Smooths trendline detection to ensure reliable up/down bias.
Precise Volume Distribution : Volume is aggregated into bins, creating a smooth volume curve around the pivot range.
PoC Extension : Automatically extends the most active price level until a new pivot is confirmed.
Profile Visualization : Profiles appear as filled shapes anchored at the pivot candle, colored based on trend.
Trendline Overlay : Thick, semi-transparent trendline provides visual guidance on directional bias.
Automatic Cleanup : Old profiles are deleted once they exceed the chart’s capacity (default 25 stored profiles).
🔵 HOW TO USE
Spotting Trend Liquidity : In an uptrend, monitor profiles at low pivots to see where buyers concentrated. In downtrends, use high-pivot profiles to spot sell-side pressure.
Watch the PoC : The PoC line highlights the strongest traded level of the pivot structure—expect reactions when price retests it.
Anticipate Trend Continuation/Reversal : Use the trendline (blue = bullish, orange = bearish) together with pivot profiles to forecast directional momentum.
Combine with HTF Context : Overlay with higher timeframe structure (order blocks, liquidity zones, or FVGs) for confluence.
Fine-Tune with Inputs : Adjust Pivot Length for sensitivity and Trend Length for smoother or faster trend shifts.
🔵 CONCLUSION
The Trend Pivots Profile blends pivot-based structure with precise volume profiling. By dynamically plotting profiles on pivots aligned with the prevailing trend, highlighting PoCs, and overlaying a directional trendline, it equips traders with a clear view of liquidity clusters and directional momentum—ideal for anticipating reactions, pullbacks, or breakouts.

Pivot Trend Flow [BigBeluga]🔵 OVERVIEW
Pivot Trend Flow turns raw swing points into a clean, adaptive trend band. It averages recent pivot highs and lows to form two dynamic reference levels; when price crosses above the averaged highs, trend flips bullish and a green band is drawn; when it crosses below the averaged lows, trend flips bearish and a red band is drawn. During an uptrend the script highlights breakouts of previous pivot highs with ▲ labels, and during a downtrend it flags breakdowns of previous pivot lows with ▼ labels—making structure shifts and continuation signals obvious.
🔵 CONCEPTS
Pivot-Based Averages : Recent pivot highs/lows are collected and averaged to create smoothed upper/lower reference levels.
if not na(ph)
phArray.push(ph)
if not na(pl)
plArray.push(pl)
if phArray.size() > avgWindow
upper := phArray.avg()
phArray.shift()
if plArray.size() > avgWindow
lower := plArray.avg()
plArray.shift()
Trend State via Crosses : Close above the averaged-highs ⇒ bullish trend; close below the averaged-lows ⇒ bearish trend.
Trend Band : A colored band (green/red) is plotted and optionally filled to visualize the active regime around price.
Structure Triggers :
In bull mode the tool watches for prior pivot-high breakouts (▲).
In bear mode it watches for prior pivot-low breakdowns (▼).
🔵 FEATURES
Adaptive Trend Detection from averaged pivot highs/lows.
Clear Visuals : Green band in uptrends, red band in downtrends; optional fill for quick read.
Breakout/Breakdown Labels :
▲ marks breaks of previous pivot highs in uptrends
▼ marks breaks of previous pivot lows in downtrends
Minimal Clutter : Uses compact lines and labels that extend only on confirmation.
Customizable Colors & Fill for trend states and band styling.
🔵 HOW TO USE
Pivot Length : Sets how swing points are detected. Smaller = more reactive; larger = smoother.
Avg Window (pivots) : How many recent pivot highs/lows are averaged. Increase to stabilize the band; decrease for agility.
Read the Band :
Green band active ⇒ prioritize longs, pullback buys toward the band.
Red band active ⇒ prioritize shorts, pullback sells toward the band.
Trade the Triggers :
In bull mode, ▲ on a prior pivot-high break can confirm continuation.
In bear mode, ▼ on a prior pivot-low break can confirm continuation.
Combine with Context : Use HTF trend, S/R, or volume for confluence and to filter signals.
Fill Color Toggle : Enable/disable band fill to match your chart style.
🔵 CONCLUSION
Pivot Trend Flow converts swing structure into an actionable, low-lag trend framework. By blending averaged pivots with clean breakout/breakdown labels, it clarifies trend direction, timing, and continuation spots—ideal as a core bias tool or a confirmation layer in any trading system.

Trendline Breakout Strategy [KedArc Quant] Description
A single, rule-based system that builds two trendlines from confirmed swing pivots and trades their breakouts, with optional retest, trend-regime gates (EMA / HTF EMA), and ATR-based risk. All parts serve one decision flow: structure → breakout → gated entry → managed risk.
What it does (for traders)
Draws Up line (teal) through the last two Higher Lows and Down line (red) through the last two Lower Highs, then extends them forward.
Long when price breaks above red; Short when price breaks below teal.
Optional Retest entry: after a break, wait for a pullback toward the broken line within an ATR-scaled buffer.
Uses ATR stop and R-multiple target so risk is consistent across symbols/timeframes.
Labels HL1/HL2/LH1/LH2 so non-coders can verify which pivots built each line.
Why these components are combined
Pure breakout systems on trendlines suffer from three practical issues:
False breaks in chop → solved by trend-regime gates (EMA / HTF EMA) that only allow trades aligned with the prevailing trend.
Uneven volatility across markets/timeframes → solved by ATR-based stop/target, normalizing distance so R-multiples are comparable.
First break whipsaws near wedge apices → mitigated by the optional retest rule that demands a pullback/hold before entry.
These modules are not separate indicators with their own signals. They are support roles inside one method.
The pivot engine defines structure, the breakout detector defines signal, the regime gates decide if we’re allowed to take that signal, and the ATR module sizes risk.
Together they make the trendline breakout usable, testable, and explainable.
How it works (mechanism; each component explained)
1) Pivot engine (structure, non-repainting)
Swings are confirmed with ta.pivotlow/high(L, R). A pivot only exists after R bars (no look-ahead), so once plotted, the line built from those pivots will not repaint.
2) Trendline builder (geometry)
Teal line updates when two consecutive pivot lows satisfy HL2.price > HL1.price (and HL2 occurs after HL1).
Red line updates when two consecutive pivot highs satisfy LH2.price < LH1.price.
Lines are extended right and their current value is read every bar via line.get_price().
3) Breakout detector (signal)
On every bar, compute:
crossover(close, redLine) ⇒ Long breakout
crossunder(close, tealLine) ⇒ Short breakdown
4) Regime gates (trend filters, not separate signals)
EMA gate: allow longs only if close > EMA(len), shorts only if close < EMA(len).
HTF EMA gate (optional): same rule on a higher timeframe to avoid fighting the larger trend.
These do not create entries; they simply permit or block the breakout signal.
5) Retest module (optional confirmation)
After a breakout, record the line price. A valid retest occurs if price pulls back within an ATR-scaled buffer toward that broken line and then closes back in the breakout direction.
This reduces first-tick fakeouts.
6) Risk module (position exit)
Initial stop = ATR(len) × atrMult from entry.
Target = tpR × (ATR × atrMult) (e.g., 2R).
This keeps results consistent across instruments/timeframes.
Entries & exits
Long entry
Base: close breaks above red and passes EMA/HTF gates.
Retest (if enabled): after the break, price pulls back near the broken red line (within the ATR buffer) and holds; then enter.
Short entry
Mirror logic with teal (break below & gates), optionally with a retest.
Exit
strategy.exit places ATR stop & R-multiple target automatically.
Optional “flip”: close if the opposite base signal triggers.
How to use it (step-by-step)
Timeframe: 1–15m for intraday, 1–4h for swing.
Start defaults: Pivot L/R = 5, EMA len = 200, ATR len = 14, ATR mult = 2, TP = 2R, Retest = ON.
Tune sensitivity:
Faster lines (more trades): set L/R = 3–4.
Fewer counter-trend trades: enable HTF EMA (e.g., 60-min or Daily).
Visual audit: labels HL1/HL2 & LH1/LH2 show which pivots built each line—verify by eye.
Alerts: use Long breakout, Short breakdown, and Retest alerts to automate.
Originality (why it merits publication)
Trades the visualization: many “auto-trendline” tools only draw lines; this one turns them into testable, alertable rules.
Integrated design: each component has a defined role in the same pipeline—no unrelated indicators bolted together.
Transparent & non-repainting: pivot confirmation removes look-ahead; labels let non-coders understand the setup that produced each signal.
Notes & limitations
Lines update only after pivot confirmation; that lag is intentional to avoid repainting.
Breakouts near an apex can whipsaw; prefer Retest and/or HTF gate in choppy regimes.
Backtests are idealized; forward-test and size risk appropriately.
⚠️ Disclaimer
This script is provided for educational purposes only.
Past performance does not guarantee future results.
Trading involves risk, and users should exercise caution and use proper risk management when applying this strategy.

Pivot Points HL DetailedThis indicator marks important turning points in the market, showing you the most recent swing high and swing low as horizontal lines across the chart. Each pivot line has a price label where it formed and a small counter that updates whenever the market touches that level again. The line’s color reflects the prevailing trend, determined by an EMA filter, so you can quickly see if the level is likely acting as support or resistance in the current market environment.
It works by scanning recent bars for points where price made a local high higher than several bars to its left and right, or a local low lower than several bars to its left and right. These pivots are calculated directly from price action using the ta.pivothigh and ta.pivotlow functions. Once identified, the level is tracked in real time, counting every time price crosses it. The EMA provides context: if price is above the EMA, the market is considered in an uptrend and the pivots are colored to match; if price is below, they’re marked as part of a downtrend.
For traders, this offers a clean way to see where the market has turned before and whether those levels are still relevant. Strong levels often show multiple touches, which can be used for entries, exits, or risk management. The built-in alert system can notify you when price approaches either the most recent swing high or swing low, so you can react quickly.
This tool can be applied in almost any market — forex, stocks, indices, commodities, or crypto — because price tends to respect recent swing points regardless of the asset class. It tends to be most effective in liquid markets, where many traders see and react to the same key levels, and it’s valuable in both trending and ranging conditions, though the EMA trend filter adds extra clarity when the market is moving directionally.
Signalgo S/RSignalgo S/R
Signalgo S/R is a cutting-edge TradingView indicator engineered for traders who want to leverage support and resistance (S/R) in a way that goes far beyond traditional methods. This overview will help you understand its unique approach, inputs, entry and exit strategies, and what truly sets it apart.
How Signalgo S/R Works
Multi-Timeframe S/R Detection
Layered Analysis: Signalgo S/R continuously scans price action across a wide spectrum of timeframes, from 1 minute up to 3 months. This multi-layered approach ensures that both short-term and long-term S/R levels are dynamically tracked and updated.
Advanced Pivot Recognition: Instead of simply plotting static lines, the indicator uses a sophisticated pivot recognition system to identify only the most relevant and recent S/R levels, adapting as the market evolves.
Synchronized Structure: By aligning S/R levels across timeframes, it builds a robust market structure that highlights truly significant zones—areas where price is most likely to react.
Intelligent Breakout & Reversal Signals
Close Confirmation: The indicator only triggers a breakout or breakdown signal when price not just touches, but closes beyond a key S/R level, dramatically reducing false signals.
Multi-Timeframe Confirmation: True buy or sell signals require agreement across several timeframes, filtering out noise and improving reliability.
One-Time Event Detection: Each breakout or breakdown is recognized only once per occurrence, eliminating repetitive signals from the same event.
Inputs & User Controls
Preset Parameters:
Pivot Length: Adjusts how sensitive the S/R detection is to price swings.
Label Offset: Fine-tunes the placement of visual labels for clarity.
Trade Management Controls:
Show TP/SL Logic: Toggle to display or hide take-profit (TP) and stop-loss (SL) levels.
ATR Length & Multipliers: Adapt SL and TP distances to current volatility.
Enable Trailing Stop: Option to activate dynamic stop movement after TP1 is reached.
Entry & Exit Strategy
Entry Logic
Long (Buy) Entry: Triggered when multiple timeframes confirm a breakout above resistance, signaling strong upward momentum.
Short (Sell) Entry: Triggered when multiple timeframes confirm a breakdown below support, indicating strong downward momentum.
Exit & Trade Management
Stop Loss (SL): Automatically set based on recent volatility, always adapting to current market conditions.
Take Profits (TP1, TP2, TP3): Three profit targets are set at increasing reward multiples, allowing for partial exits or scaling out.
Trailing Stop: After the first profit target is reached, the stop loss moves to breakeven and a trailing stop is activated, locking in gains as the trade continues.
Event Markers: Each time a TP or SL is hit, a visual label is placed on the chart for full transparency.
What Separates Signalgo S/R from Traditional S/R Indicators?
True Multi-Timeframe Synchronization: Most S/R tools only look at a single timeframe or plot static levels. Signalgo S/R dynamically aligns levels across all relevant timeframes, providing a comprehensive market map.
Event-Driven, Not Static: Instead of plotting every minor swing, it intelligently filters for only the most actionable S/R levels and signals—reducing chart clutter and focusing attention on what matters.
Breakout Confirmation Logic: Requires a close beyond S/R, not just a wick, to validate breakouts or breakdowns. This greatly reduces false positives.
Automated, Adaptive Trade Management: Built-in TP/SL and trailing logic mean you get not just signals, but a full trade management suite—something rarely found in standard S/R indicators.
Visual & Alert Integration: Every signal, TP/SL event, and trailing stop is visually marked and can trigger TradingView alerts, keeping you informed in real time.
Trading Strategy Application
Scalping to Swing Trading: The multi-timeframe logic makes it suitable for all trading styles, from fast intraday moves to longer-term position trades.
Systematic, Disciplined Execution: By automating entries, exits, and risk management, Signalgo S/R helps you trade with confidence and consistency, removing emotion from the process.
Noise Reduction: The advanced filtering logic means you only see the highest-probability setups, helping you avoid common S/R “fakeouts.”

Golden Pocket Syndicate [GPS]Golden Pocket Syndicate is a multi-layered market analysis toolkit built for precision entries and sniper-style reversals in both trending and ranging conditions. The script fuses volume dynamics, golden pocket structures, market maker behavior, and liquidation cluster tracking into one high-confluence system.
Core Features:
• 📐 Golden Pocket Zones: Dynamic GP levels from daily, weekly, monthly, and yearly timeframes. These levels update in real-time and serve as confluence zones for entries and exits.
• 📊 WaveTrend Divergence Diamonds: Momentum shifts are detected using a custom filtered WaveTrend cross system to mark high-probability reversal conditions.
• 🧠 Market Maker Premium Divergence: Tracks price dislocation between CME and Binance to detect large player manipulation using a configurable premium threshold.
• 💎 MM Reversal Diamonds: Identifies potential market maker traps and large player pivots using historical candle behavior, EMA alignment, and price structure breaks.
• 📉 Stealth Liquidation Cluster Arrows: Volume-based liquidation pressure visualized as lightweight directional arrows based on calculated wick expansion and volume bursts. Highlights key zones where price is likely to bounce or reject.
• 🧭 Trend Validation: Uses volume-based trend conditions and short-term EMA positioning to further qualify signals and eliminate noise.
How to Use:
This indicator is designed to help traders visualize confluence between key institutional price levels, momentum shifts, and volume-based pressure points. Long/short opportunities can be explored at marked reversal diamonds or liquidation zones that align with key GP levels. Intended for use on higher timeframes (15m to 4H), though flexible across any pair or market.

RTH and ETH RangesKey Functions :
Visualizes Regular Trading Hours (RTH) and Extended Trading Hours (ETH) price ranges
Tracks session highs, lows, and 50% levels where significant market reactions occur
Detects breakouts beyond previous session extremes
Trading Applications :
Exposes potential liquidity raids at session boundaries where smart money targets stop orders
Identifies critical price thresholds where institutional activity concentrates
Highlights divergences between RTH and ETH behavior that precede directional moves
Provides measurement of session volatility differences
Maps key price levels for objective entry and exit parameters
Reveals market dynamics at session transitions where institutional positioning changes

GOLDEN Trading System by @thejamiulThe Golden Trading System is a powerful trading indicator designed to help traders easily identify market conditions and potential breakout opportunities.
Source of this indicator :
This indicator is built on TradingView original pivot indicator but focuses exclusively on Camarilla pivots, utilising H3-H4 and L3-L4 as breakout zones.
Timeframe Selection:
Before start using it we should choose Pivot Resolution time-frame accordingly.
If you use 5min candle - use D
If you use 15min candle - use W
If you use 1H candle - use M
If you use 1D candle - use 12M
How It Works:
Sideways Market: If the price remains inside the H3-H4 as Green Band and L3-L4 as Red band, the market is considered range-bound.
Trending Market: If the price moves outside Green Band, it indicates a potential up-trend formation. If the price moves outside Red Band, it indicates a potential down-trend formation.
Additional Features:
Displays Daily, Weekly, Monthly, and Yearly Highs and Lows to help traders identify key support and resistance levels also helps spot potential trend reversal points based on historical price action. Suitable for both intraday and swing trading strategies.
This indicator is a trend-following and breakout confirmation tool, making it ideal for traders looking to improve their decision-making with clear, objective levels.
🔹 Note: This script is intended for educational purposes only and should not be considered financial advice. Always conduct your own research before making trading decisions.

PivotBuilderOverview
PivotBuilder is a versatile trading tool that allows traders to create up to eight pivot lines, calculated using moving averages and standard deviation offsets, for enhanced market analysis and trade signal generation. These pivot lines work in conjunction with a trigger line to generate long and short signals based on user-defined parameters.
Key features:
Build strategies based on interaction between a moving average and any one or more of the 8 pivot lines - all fully configurable.
Customizable moving average types for pivot and trigger lines (SMA, EMA, VWMA).
Optional global pivot line configuration to simplify parameter adjustments.
Signal persistence options: signals can last for only one bar or until the opposite signal is issued.
Strategy visualization on chart.
Ideal for intraday and swing traders seeking dynamic support/resistance analysis and related strategies.
Key Concepts:
Customizable Pivot Lines
Create up to eight pivot lines with individually adjustable lengths, moving average types, and standard deviation offsets.
Optionally enable or disable signal generation for each pivot line.
Global Pivot Line Settings
Use a single global length for all pivot lines with one input for quicker configuration.
Signal Persistence
Choose between signals lasting only for the current bar or remaining active until the opposite signal is issued.
Chart Highlighting
Green background: Long signal is active.
Red background: Short signal is active.
Alerts
Configure alerts for signals via email, Discord, pop-ups, or sound using TradingView's native alert function.
Input Parameters
Global Settings:
Use Global Length for Pivot Lines: Enable this to apply a single length value to all pivot lines.
Global Pivot Line Length: The length to apply when the global setting is enabled.
Signal Mode:
Signal Mode: Select how long signals persist.
One Bar Only: Signals last only for the current bar.
Until Opposite Signal: Signals remain active until the opposite signal is triggered.
Trigger Line:
Trigger Line Moving Average Length: Set the length of the moving average for the trigger line.
Trigger Line MA Type: Choose the moving average type (Simple - SMA, Exponential - EMA, Volume-Weighted - VWMA).
Pivot Lines:
Each of the eight pivot lines has the following configurable settings:
Length: Define the moving average length. Overrides the global length if global settings are disabled.
MA Type: Choose between Simple - SMA, Exponential - EMA, Volume-Weighted - VWMA.
Standard Deviation: Set the standard deviation offset for the pivot line.
Enable Signal: Turn signal generation on/off for the specific pivot line.
Example Strategy on Nasdaq Futures (NQ, 1-minute Chart)
Long Signal:
A long signal is generated when:
The trigger line crosses above Pivot Line, Pivot Line 2, Pivot Line 3, and Pivot Line 4.
Short Signal:
A short signal is generated when:
The trigger line crosses below Pivot Line, Pivot Line 2, Pivot Line 3, and Pivot Line 4.
Configuration Example:
Global Settings:
Use Global Length for Pivot Lines: Disabled (to allow individual lengths for each pivot line).
Signal Mode: Until Opposite Signal (signals persist until the opposite signal is triggered).
Trigger Line:
Trigger Line Moving Average Length: 5.
Trigger Line MA Type: EMA (Exponential Moving Average).
Pivot Line 1:
Length: 20.
MA Type: EMA (Exponential Moving Average).
Standard Deviation: 0.25.
Enable Signal: True.
Pivot Line 2:
Length: 50.
MA Type: EMA (Exponential Moving Average).
Standard Deviation: -0.5.
Enable Signal: True.
Pivot Line 3:
Length: 50.
MA Type: EMA (Exponential Moving Average).
Standard Deviation: 1.
Enable Signal: True.
Pivot Line 4:
Length: 40.
MA Type: EMA (Exponential Moving Average).
Standard Deviation: 2.0.
Enable Signal: True.
Set Pivot Lines 5-8 disabled.
Signals:
Green Highlight: Indicates a long signal is active.
Red Highlight: Indicates a short signal is active.
Alerts
PivotBuilder allows you to set alerts for long or short signals. Here’s how to set them up in TradingView:
Add the Indicator: Attach PivotBuilder to your chart.
Open Alert Menu: Right-click on the chart and select Add Alert.
Condition: Choose your symbol (e.g., NQ) and select PivotBuilder.
Alert Options:
Crossing: Choose if you want to be alerted for "long" or "short" signals.
Notifications: Configure alerts via:
Email: Receive email alerts when signals are triggered.
Webhook: Set up Discord notifications via webhooks.
Pop-ups: Show an on-screen alert in TradingView.
Sound: Play a sound when a signal is issued.
Create: Save the alert.
Signal Persistence: How It Works
PivotBuilder gives you control over how long signals remain active:
One Bar Only:
Signals are active for the current bar only.
At the close of the bar, signals reset automatically.
Until Opposite Signal:
A long signal remains active until a short signal is triggered and vice versa.
Useful for trend-following strategies.
Development Roadmap
Future updates for PivotBuilder will include:
New Moving Average Types: Expand the available moving average options for both the pivot and trigger lines. Planned additions include, Weighted Moving Average (WMA), Hull Moving Average (HMA), Least Squares Moving Average (LSMA), and more.
Dynamic Volume Filtering: Add volume-based conditions to validate signals during periods of high market activity, filtering out low-liquidity signals.
Incorporation of Support/Resistance Calculations: Integrate traditional and alternative methods of support and resistance calculations into pivot lines such as Fibonacci retracements, Average True Range (ATR), volume-profile based support.
Automated trading via Strategy companion add-on.

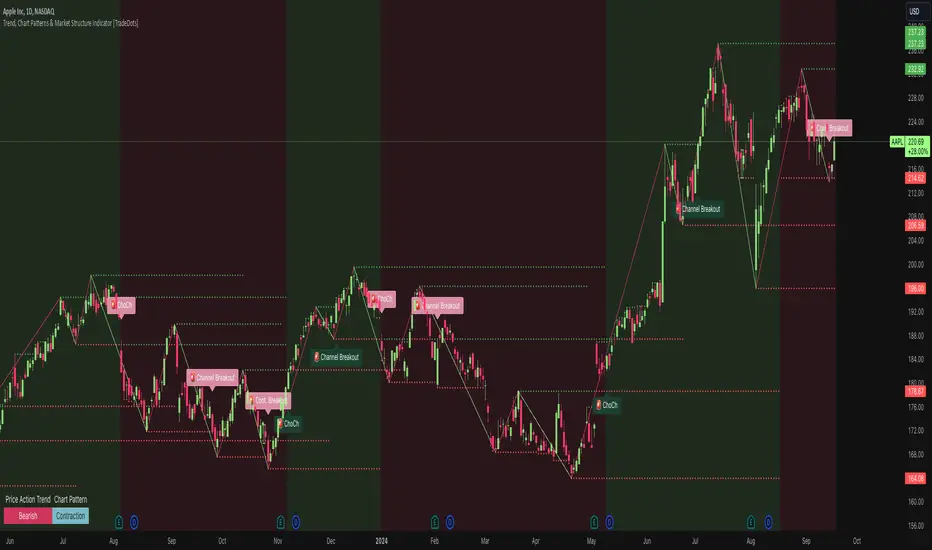
Trend, Chart Patterns & Market Structure Indicator [TradeDots]The "Trend, Chart Patterns & Market Structure Indicator" is engineered to identify pivotal price action points, revealing shifts in market dynamics. This tool aids traders to simplify any trading market in recognizing significant price levels, enhancing decision-making in diverse market conditions.
📝 HOW IT WORKS
Pivot Identification
The indicator detects pivots in price action using a complex mathematical model by analyzing a window of candlesticks to capture significant reversal patterns. It examines a series of bars, focusing on their open, high, low, close, and changes in these values, to pinpoint potential market turning points.
Support and Resistance Lines
Calculation: Automatically draws lines at key price pivots in bullish and bearish markets.
Significance: Aligning support and resistance levels highlights strong demand or supply zones, reinforcing trading biases. When multiple lines converge near a price level, it indicates robust support or resistance, as many traders focus on these levels for placing trades.
Chart Patterns Analysis
Formation: Utilizes four pivots to identify patterns such as ascending/descending channels, contraction, and expansion patterns.
Visualization: Background colors (green for bullish, red for bearish) help identify market trends.
Market Structure Shifts
Detection: Identifies price breakouts above or below previous support and resistance, indicating changes in market structure.
Confirmation: Highlights shifts in market character, aiding in trend reversal anticipation.
Types of Market Structure Shifts
Channel Breakout: The price breaks out from the current channel's resistance level.
Rev. Breakout: The price breaks out from a contraction pattern, moving in the opposite direction of the previous market trend.
Continuation Breakout: The price breaks out from a contraction pattern, continuing the previous market trend.
Change of Character (ChoCh): The price breaks out from either support or resistance, causing a change in the market trend.
🛠️ HOW TO USE
Chart Visualization
Color Coding: Background colors signify market trends, with green indicating bullish and red indicating bearish conditions.
Pattern Recognition: Identifies and labels patterns, providing insights into current market sentiment.
Reversal Signals
Signal Labels: Detects shifts in market structure indicating potential entry and exit points.
❗️LIMITATIONS
Market Noise: Accuracy may decrease in volatile and noisy markets.
Trend Confirmation Delay: Market trends are only confirmed once the price breaks out from support or resistance, potentially causing delays.
RISK DISCLAIMER
Trading involves substantial risk, and most traders may incur losses. All content, tools, scripts, articles, and education provided by TradeDots are for informational and educational purposes only.
Swing Percentile Lines [QuantVue]The Swing High/Low Percentile Indicator is designed to help traders identify key price levels based on the most recent swing high and low. By anchoring to the most recent swing high and swing low, the indicator automatically generates percentile lines ( 25%, 50%, 75%) that act as dynamic support and resistance levels.
What Does the Indicator Do?
The Swing High/Low Percentile Indicator works by identifying the most recent significant price swings, whether it's a swing high or swing low. It then calculates the range between these points and divides the distance into percentage-based levels. These levels are plotted on the chart as clear, easy-to-read lines at 25%, 50%, and 75% of the range between the swing high and low.
These percentile lines serve as dynamic price zones where traders can anticipate potential reactions, whether the market is trending or consolidating.
How Can Traders Use the Indicator?
Support and Resistance: The percentile lines act as evolving support and resistance zones. Traders can anticipate price bounces or breaks at these levels, providing opportunities for trend-following or reversal trades.
Trend Identification: The indicator helps traders determine the strength of a trend. In a strong uptrend, price will likely stay above the 50% or 75% lines, while in a downtrend, it may remain below the 50% or 25% lines. This gives traders an edge in recognizing the overall market direction.
Entry and Exit Points: Traders can use the percentile lines to time their entries and exits. For example, entering a trade on a pullback to the 25% or 50% line offers a favorable risk-to-reward ratio. Similarly, the percentile lines serve as natural profit targets, allowing traders to plan exits as the price approaches the 50% or 75% levels.
Risk Management: The clear delineation of price levels makes it easy for traders to set stop-loss orders. For example, if price falls below the 25% line in an uptrend, it may signal weakness, prompting an exit or reduced position size.
Breakout and Breakdown Scenarios: When price breaks above a recent swing high or below a swing low, the percentile lines provide traders with pullback entry opportunities or key levels to watch for continuation of the move.

Hermes Reg FIBONACCI V.4Hermes Reg Fibonacci V.4 Indicator User Guide
Overview
The Hermes Reg Fibonacci V.4 indicator is a versatile tool used for identifying market trends and channels. This indicator analyzes price movements using logarithmic regression and Fibonacci levels, helping users determine the direction of the trend and identify support/resistance levels.
Parameters and Inputs
Source: The price data to be used in the calculations of the indicator. The default is the close price.
Length: The period length for the calculations of the indicator. The default is 262 and the minimum value is 10.
Deviation Multiplier (devlen): Set to 1.6.
Extend Lines: Determines whether the lines should be extended to the right of the chart.
Show Fibonacci Levels: Determines whether Fibonacci levels should be displayed.
Show Broken Channel: Determines whether to display the broken channel lines.
Up Trend Color (upcol): The color of the uptrend line.
Down Trend Color (dncol): The color of the downtrend line.
Fibonacci Up Trend Color (fibupcol): The color of the Fibonacci uptrend line.
Fibonacci Down Trend Color (fibdncol): The color of the Fibonacci downtrend line.
Channel Line Width (widt): The width of the channel line.
Fibonacci Line Width (fibwidt): The width of the Fibonacci line.
Working Mechanism of the Indicator
Logarithmic Source and Regression Channel Calculations:
The indicator takes the logarithm of the price data and calculates the logarithmic regression channel.
It calculates the middle line of the channel, slope, and the starting and ending points.
The standard deviation and the upper/lower boundaries of the channel are determined.
Channel and Fibonacci Levels:
Depending on user preferences, channel lines and Fibonacci levels are drawn on the chart.
Channel lines and Fibonacci levels are dynamically updated based on the slope and price movement.
When the channel is broken, it is displayed with the specified color and style.
Trend Direction and Alert Conditions:
The direction of the trend is determined based on whether the slope is positive or negative.
Alert conditions are defined for trend changes and channel breaks.
Symbols indicating the trend direction are displayed on the chart.
Usage Recommendations
Trend Following: The Hermes Reg Fibonacci V.4 indicator can be used to determine the current trend direction and identify potential trend reversal points.
Support and Resistance Levels: The indicator helps identify support and resistance levels by observing how the price moves within the channel.
Fibonacci Analysis: Fibonacci levels can be used to identify potential retracement and extension points.
Alerts and Notifications: Set alerts for trend changes and channel breaks to avoid missing important price movements.
The Hermes Reg Fibonacci V.4 indicator, with its user-friendly interface and flexible parameters, can be effectively used in different market conditions. By customizing the indicator, you can tailor it to suit your trading strategy.

Support Resistance Pivot EMA Scalp Strategy [Mauserrifle]A strategy that creates signals based on: pivots, EMA 9+20, RSI, ATR, VWAP, wicks and volume.
The strategy is developed as a helper for quick long option scalping. This strategy is primarily designed for intraday trading on the 2m SPY chart with extended hours. However, users can adapt it for use on different symbols and timeframes. These signals are meant as a helper rather than fully automated trading bots.
One of the key elements is its pivot-based calculation, driven by my integrated indicator "Support and Resistance Pivot Points/Lines ". It enables multi-timeframe pivot calculations which are used to generate the signals and offers customizability, allowing you to define rounding methods and cooldown periods to refine pivot levels. The pivots, in combination with EMA crossovers, VWAP trend, and additional filters (RSI, ATR, VWAP, wicks and volume), create an entry and exit strategy for scalping opportunities that is useful for 0/1 DTE options with an average trade time of six minutes with the default setup for SPY. Option trading should be done outside TradingView. At this moment of release there is no option trading support.
All parameters used in the strategy are tweaked based on deep backtests results and real-time behavior. Be mindful that past performance does not guarantee future results.
The strategy is designed for intermediate and advanced users who are familiar intraday option scalping techniques.
How It Works
The strategy identifies entries based on multiple conditions, including: recently above pivot, recent EMA crossovers, RSI range, candle patterns, and VWAP uptrend. It avoids trades below the VWAP lower band due to poor backtesting results in those conditions. It creates a great number of signals when it detects an uptrend, which entails: VWAP and its lower/upper band slopes are going up, and the number of next high pivot points is greater than the number of lower pivot points. This indicates that we hope it will keep going up. In historical testing, this showed favorable results. This uptrend criteria runs on 15m charts max (where up to the VWAP effectiveness is the greatest).
The strategy also checks for candle and volume patterns, identified in backtesting to improve entry levels on historic data. Which include:
A red candle after multiple green ones, hoping to jump on a trend during a small pullback
Zero lower wick
Percentage and volume is up after lower volume candles
Percentage is up and the first and second EMA slopes are going up
Percentage is up, the first EMA is higher than the second, the price low is below the second EMA and price close above it
The VWAP uptrend overrules the candle and volume conditions (thus lots of signals during those moments).
The above is the base for many signals. There is a strict mode that adds extra checks such as:
not trading when there is no next low or high pivot
requiring a VWAP uptrend only
minimum candle percentages
This mode is for analyzing history and seeing performance during these conditions. It is worth it to create a separate alert for strict mode so you are aware of these conditions during trading.
When no stop has been defined, exits will always happen on pivot crossunder confirmations. If a stop is defined (default config), the strategy exits a position when:
the position is negative or no trail has been set
at least 1 bar has past
OR no stop has been defined (overrules previous)
trail has not been activated
The second exit condition happens when the close is below first EMA(9 by default) and when:
the position has been above first EMA
the gap between close and last pivot isn't small
the position is negative or no trail has been set
OR no stop has been defined (overrules above)
trail has not been activated
There are some more variations on this but the above are the most common. These exit conditions are a safety net because the strategy heavily relies on and favors stops. The settings allow changing stops, profit takers and trails. You can configure it to always sell without the conditions above.
The script will paint the pivot lines, trailing activation/stops, EMAs and entry/exits; with extra information in the data panel. For a complete view add VWAP and RSI to your chart, which are available from TradingView official indicator library. The strategy will not rely on those added indicators since VWAP and RSI are programmed in. You can add them to track the behavior of the signals based on these filters you have configured and have a complete view trading this strategy.
As mentioned earlier, the default settings are built for SPY 2m charts, with extended hours and real-time data. Open the strategy on this chart to study how all input parameters are used. If you don't have real-time data you need to adjust the minimum volume settings (set it to 0 at first).
The backtest
The default backtest configuration is set up to simulate SPY option trading.
Start capital is set to 10,000 and we risk around 5% of that per trade (1 contract)
Commission is set to 0.005%. The reason: at the time of this publication the SPY index price is approximately $580. Two ITM 0/1 DTE options contracts, each priced around $280, which is approximately $560. The typical commission for such a trade is around $3. To simulate this commission in the backtest on the SPY index itself, a commission of 0.005% per trade has been applied, approximating the options trading costs.
Slippage of 3 is set reflecting liquid SPY
The bar magnifier feature is turned on to have more realistic fills
Trading
In backtesting, setting commission and slippage to 0 on the SPY 2m chart shows many trades result around breaking even. Personally, I view them as an opportunity and safety net to help manage emotional decisions for exits. The signals are designed for short option scalps, allowing traders to take small profits and potentially re-enter during the strategy’s position window. It's advisable to take small potential profits, such as 4%, whenever the opportunity arises and consider re-entering if the setup still looks favorable, for example price still above ema9. Exiting a long position below ema9 is a common strategy for 2m scalping.
The average trade duration is approximately 6 minutes (3 bars). The choice between ITM (in-the-money), ATM (at-the-money), or OTM (out-of-the-money) options will depend on your trading style. Personally, I’ve seen better results with ITM options because they tend to move more in sync with the underlying index, thanks to their higher delta.
It’s important to note that the signals are designed to be a helper for manual trading rather than to automate a bot. Users are encouraged to take small profits and re-enter positions if favorable conditions persist. Be mindful that past performance does not guarantee future results.
For the default SPY setup the losses will mostly be 4-10% for ITM options. Be mindful of extreme volatile conditions where losses may reach 30% quickly, especially when trading ATM/OTM options.
The following settings can be changed:
8 pivot timeframes with left/right bars and days rendered
Here you can configure the timeframes for the pivots, which are crucial. The strategy wants that a crossover has happened recently (so it might enter after a crossunder if the crossover was recent) or the price is still above the crossed pivot.
When you decide to use a pivot timeframe higher than your chart, make sure it aligns the same starting point as the chart timeframe. As stated in the 43000478429 docs, there is a dependency between the resolution and the alignment of a starting point:
1–14 minutes — aligns to the beginning of a week
15–29 minutes — aligns to the beginning of a month
from 30 minutes and higher — aligns to the beginning of a year
This alignment also affects the setting of rendered days. I recommend a max value of 5 days for 1-14 minutes timeframes.
Also make sure a higher pivot timeframe can be divided by the lower. For instance I had repaint issues using 3m pivots on a 2m chart. But 4m pivots work fine.
Please look up docs 43000478429 to make sure this information is still up to date.
Pivot rounding
The pivot rounding option is used to add pivots based on a rounded price and limit the number of pivots. While this feature is disabled by default it can be useful with tweaking strategy variations, because many orders are placed at rounded levels and tend to act as strong price barriers.
There are multiple rounding methods: round, ceil/floor, roundn (decimal) and rounding to the minimal tick.
The next feature is a powerful extension called "Cooldown rounding":
Pivot cooldown rounding
This rounds new pivot levels for a cooldown period to keep the previous pivot line instead of adding a new line when they match the rounded value within the cooldown period. The existing line will be extended. This feature is useful because it makes sure the initial line is added to the exact high/low pivot level but any future lines within the rounding will just extend the existing line. This limits the number of pivots while still having precise levels (which normal rounding lacks) and allows more precise pivot trading.
This feature also helps ensure that the number of rendered lines will not exceed 500 too much, which is the render limit on TradingView.
You can set a maximum minutes for the cooldown. The default is 3 years which will enable the cooldown rounding permanently on the intraday (due to the max bar limit).
Pivot always added when new higher/lower pivot
When using cooldown rounding, one may find it useful to override this behavior when a new lower or higher pivot level has been reached. When enabled the new level will be added despite the fact that they may be rounded the same in the cooldown check. This is a good balance between limiting pivots but also allowing preciser trading.
VWAP bands multiplier
This is used to tweak the inner VWAP working for the upper and lower band. The default VWAP multiplier (0.9) is set based on backtesting since it performed better on historic data (the strategy does not trade below the lowerband). When you add the VWAP indicator from the TradingView library to the chart, make sure it uses the same multiplier setting as within this strategy so you have a correct view of the conditions the strategy acts on.
ATR EMA smoothing length
Used to tweak the ATR EMA smoothing. By default it is set up to 4 based on deep backtesting historic data.
EMA lengths
Changing the EMA length allows you to fine tune the EMA crossing behavior. By default the strategy is set up to EMA 9 and 20 which are considered commonly used values on the 2-minute chart.
Trading intraday time restrictions
For intraday charts you can configure when the strategy starts trading after market open and when it stops, including a hard sell. This makes sure there are no open positions left for the day during backtesting and can also aid in your trading style. For example some scalpers will not trade in the first two hours. Having no signals during this time can be beneficial. It is possible to configure these settings based on the number of bars or minutes.
Not trading on days the market closes earlier
By default the strategy does not trade on days the market closes earlier in the US. This makes sure there are no open positions left open during backtesting. Make sure to change it when using it on such a day. The days are: day before independence day, day after thanksgiving, Christmas eve and new years eve.
Not trading below VWAP lowerband
Backtesting has shown poor performance when trading below the VWAP lowerband but you are free to allow it to trade in such conditions. Past performance does not guarantee future results.
Minimum volume
A minimum volume can be set up. The current value is based on better deep backtest results for SPY using real-time data (48000). When you do not have a data plan for SPY, please set it to 0 and tweak based on backtests.
Minimum ATRP
The strategy has shown during my trading that it is sensitive to higher ATRP values and more volatile market conditions. There is more chance the index moves and we can profit from this during option scalping (if it moves in your favor). The default is based on SPY backtesting (0.04%), as a balance to have a lot of trades but also capture minimal movement.
RSI range
A RSI range can be set using a minimum and maximum value so we can limit trading during overbought/oversold conditions. Backtesting for SPY has shown the strategy performs better on historic data within a tighter range, so a default range has been set to 40-65.
Allow orders on every tick (no effect on stop/profit/trail)
This setting is used to allow orders on every tick. The strategy has been developed without trading on every tick but you can change this, for example when you have configured a setup different than the default configuration that you know works well with this. The default setup will not work well with it due to too many constant signals.
Stop percentage + ATRP threshold
One of the most important settings for managing the risk. I recommend setting a stop percentage first and later the ATRP threshold where the stop is calculated based on the current ATRP value. The calculated value will only be in effect when it is greater than the normal stop--the normal stop acts as baseline. The default stop is low (0.03). With a default ATRP threshold stop of 1.12, the calculated value overrules the normal stop when the value is greater. 0.03 acts as a minimum value but in reality the stop will most likely be higher on average for SPY with the default ATRP threshold.
For the default SPY setup the losses will be around 4-10% for ITM options. Be mindful of extreme volatile conditions where losses may reach 30% quickly, especially when trading ATM/OTM options.
Profit taker percentage + ATRP threshold
Same principles as the stop percentage above, but for profit taking. There is a very high ATRP threshold of 4 set by default. Backtests showed that trailing stops perform better on historic data.
Trailing stop
Used to set up a trailing stop. A useful feature to secure profit after a run-up, or get out with a small loss after initial activation. It is important to not use too tight values because they will give unrealistic backtest results and trigger too fast in real-time. Both the trail activation level and trail stop itself can be configured with a percentage value and ATRP value. I recommend setting up the ATRP last. By default the values are 0.05 for activation and 0.03 for the stop based on SPY real-time behavior.
Always sell on pivot crossunder confirmation
The strategy includes pivot crossunder confirmations as sell condition. By default it will not sell on every crossunder confirmation but checks for different conditions (explained in detail earlier in this description). You can change this behavior.
Always sell below first EMA when position has been above
The strategy sells below the first EMA when the position has been above it. By default it will not always sell but checks for different conditions (mentioned earlier in this description). You can change this behavior.
Buy modes pivot
By default the strategy buys between pivots as long as there has been a pivot crossover and EMAs crossover recently or price is still above it. You can change the behavior so it only buys on pivot crossovers or pivot crossover confirmations. Backtesting on the default setup shows decreased performance but for other strategy variations and pivot setups this feature can be useful since many scalpers do not buy between pivots.
Strict mode
There is a strict mode that adds extra checks such as not trading when there is no next low or high pivot, requiring a VWAP uptrend only and minimum candle percentages. This mode is for analyzing history and seeing performance during these conditions. It is worth it to create a separate alert for strict mode so you are aware of these conditions during trading. The deep backtests improved with these setting but past performance does not guarantee future results.
In the strict mode section you can override the stop, minimum ATRP, set up a minimum percentage, only trade VWAP uptrends and to not trade candles without a wick.
A summary and some extra detail
At the time of release only long trades are supported
The strategy is meant for quick scalping but one might find other uses for it
Enable extended hours on intraday charts so it captures more pivots
It does not trade extended hours (pre and post market) since options do not trade during those times
real-time data is recommended and required if a symbol has delayed data by default
You can configure that it trades minutes after market open and hard sells minutes after market open
The entries have a specific label text, example: "833 LE1 / 569.71 / P:569.8". This means: / / . The condition number is only for development/debug purposes for me when you have an issue.
The strategy cannot be tweaked to work on multiple symbols and timeframes with a single config. So you will have to make a config for every timeframe and symbol. I recommend using the Indicator Templates feature of TradingView. This way you can save the settings per timeframe and symbol
The strategy is per default config very dependent on (trailing) stops because it trades between pivots too. It wants that a pivot and EMA crossover has happened more recently than a crossunder. But you can change this behavior to always force crossover buys and crossunder sells.
It’s recommended to set up alerts to notify you of entry and exit signals. Watching the chart alone might cause you to miss trades, especially in fast-moving markets.
Only a max of 500 lines can be rendered on the chart, but the strategy will function with more under the hood. When you exceed 500 you will notice the beginning of the chart has no pivots, but beneath everything functions for backtesting.
Changing settings
Changing the settings for a different symbol and/or timeframe can be a challenging task. Here's a how-to you could use the first time to help you get going:
Set commission and slippage to 0. I prefer to do this so it is more clear whether you are balancing on break-even trades
Enable the pivot timeframe equal or above your chart timeframe. Avoid repainting as discussed earlier by choosing timeframes that align with the same timeframe
Set all volume, ATR, stop, profit takers and trail values to 0
Make sure strict mode is disabled at the bottom of the settings
You now have a clean state and you should see the backtest results purely based on pivot and EMA conditions
Tweak the stop and profit taker, beginning with the simple values and then ATRP threshold
At the last moment tweak the trailing stops. Tight trailing stops create an unrealistic backtest so you will need to tweak them based on real-time behavior of the symbol you're using which you will have to monitor during signals while the market is open. The default values are low (2m intraday SPY). Only with the bar magnifier feature it is somewhat possible to tweak realistic with history data. The tighter they are, the more unrealistic your backtest results. As a starting point, set the trailing stop low and find the highest activation level that doesn't change the results drastically, then increase the stop to the value you think reflects real-time behavior.
Keep refining by testing it during real-time behavior. Does it exit too early according to your own judgment? You need to increase the stop and maybe the activation level.
I hope you will find this useful!
DISCLAIMER
Trading is risky & most day traders lose money. This indicator is purely for informational & educational purposes only. Past performance does not guarantee future results.

Central Pivot Point Cross & Retrace Strategy // AlgoFyreThe Central Pivot Point Cross & Retrace Strategy uses pivot points for trend identification and trade entry. It combines accumulation/distribution indicators with pivot point levels to generate signals. The strategy incorporates dynamic position sizing based on a fixed risk amount and allows for both long and short positions with customizable stop-loss levels.
TABLE OF CONTENTS
🔶 ORIGINALITY
🔸Pivot Point-Based Trading
🔸Accumulation/Distribution
🔸Dynamic Position Sizing
🔸Customizable Risk Management
🔶 FUNCTIONALITY
🔸Indicators
🞘 Pivot Points
🞘 Accumulation/Distribution
🔸Conditions
🞘 Long Entry
🞘 Short Entry
🞘 Take Profit
🞘 Stop Loss
🔶 INSTRUCTIONS
🔸Adding the Strategy to the Chart
🔸Configuring the Strategy
🔸Backtesting and Practice
🔸Market Awareness
🔸Visual Customization
🔶 CONCLUSION
▅▅▅▅▅▅▅▅▅▅▅▅▅▅▅▅▅▅▅▅▅▅▅▅▅▅▅▅▅▅▅▅▅▅▅▅▅▅▅▅▅▅▅▅▅
🔶 ORIGINALITY The Central Pivot Point Cross & Retrace Strategy uniquely combines pivot point analysis with accumulation/distribution indicators to identify optimal entry and exit points. It employs dynamic position sizing based on a fixed risk amount, ensuring consistent risk management across trades. This approach allows traders to adapt to varying market conditions by adjusting position sizes according to predefined risk parameters, enhancing both flexibility and control in trading decisions. The strategy's integration of customizable stop-loss levels further refines its risk management capabilities.
🔸Pivot Point-Based Trading This strategy utilizes daily pivot points to identify key support and resistance levels, providing a framework for trend identification and trade entry. The central pivot point serves as the intraday point of balance between buyers and sellers, with the largest amount of trading volume assumed to take place in this area.
🔸Accumulation/Distribution The strategy incorporates the Accumulation/Distribution (A/D) line, an underrated volume-based indicator, to establish the main trend. The A/D line is used in conjunction with a trend based indicator like the 200-period Exponential Moving Average (EMA) to confirm trend direction and strength.
🔸Dynamic Position Sizing Position sizes are calculated dynamically based on a fixed risk amount, allowing traders to maintain consistent risk exposure across trades.
🔸Customizable Risk Management Traders can set flexible risk-reward ratios and adjust stop-loss and take-profit levels, tailoring the strategy to their risk tolerance and market conditions. The strategy recommends taking partial profits at S1 or R1 levels and moving the stop-loss to break-even for remaining positions.
🔶 FUNCTIONALITY The Central Pivot Point Cross & Retrace Strategy leverages pivot points and accumulation/distribution indicators to identify optimal trading opportunities. This strategy is designed to capitalize on price movements around key pivot levels by dynamically adjusting position sizes based on predefined risk parameters. It allows traders to manage risk effectively while taking advantage of both long and short positions.
🔸Indicators 🞘 Pivot Points: Calculates daily pivot points (PP, R1, R2, S1, S2) to identify key support and resistance levels. The central pivot point is crucial for determining market bias and entry points.
🞘 Accumulation/Distribution: Uses the A/D line and with a trend based indicator like the 200 EMA to determine market direction and trend strength. This combination helps eliminate noise and provides more reliable trend signals. We recommend using the Adaptive MAs (Hurst, CVaR, Fractal) // AlgoFyre , but any moving average could be used.
🔸Conditions 🞘 Long Entry: Initiates a long position when the price crosses above the central pivot point (PP), retraces back to it and the A/D line is above its 200 EMA, indicating an uptrend. A limit entry order is set at the PP for entering the long trade.
🞘 Short Entry: Initiates a short position when the price crosses below the central pivot point (PP), retraces back to it and the A/D line is below its 200 EMA, indicating a downtrend. A limit entry order is set at the PP for entering the short trade.
🞘 Take Profit: 50% of the position is closed as profit when R1 for Longs and S1 for Shorts is reached. The position is fully closed when R2 for Longs and S2 for Shorts is reached.
🞘 Stop Loss: Stop loss is set via strategy settings. When the first 50% take profit for both long and shorts is taken, stop loss for both will be moved to break-even/entry.
🔶 INSTRUCTIONS
The Central Pivot Point Cross & Retrace Strategy can be set up by adding it to your TradingView chart and configuring parameters such as the accumulation/distribution source, stop-loss percentage, and risk management settings. This strategy is designed to capitalize on price movements around key pivot levels by dynamically adjusting position sizes based on predefined risk parameters. Enhance the accuracy of signals by combining this strategy with additional indicators like trend-following or momentum-based tools. Adjust settings to better manage risk and optimize entry and exit points.
🔸Adding the Strategy to the Chart Go to your TradingView chart.
Click on the "Pine Editor" button at the bottom of the chart.
Copy and paste the strategy code into the Pine Editor.
Click "Add to Chart" to apply the strategy.
Add the technical indicator "Accumulation/Distribution" to the chart.
Add the trend indicator " Adaptive MAs (Hurst, CVaR, Fractal) // AlgoFyre " or any other MA to the chart and move it to the "Accumulation/Distribution" pane.
Set the source of your trend indicator to "Accumulation/Distribution".
🔸Configuring the Strategy Open the strategy settings by clicking on the gear icon next to its name on the chart.
Accumulation/Distribution Source: Select the source for the accumulation/distribution indicator.
Accumulation/Distribution EMA Source: Select the source for the trend indicator.
Stop Loss Percentage: Set the stop loss distance from the pivot point as a percentage.
Risk Amount: Define the fixed risk amount for position sizing.
Base Order Size: Set the base order size for position calculations.
Number of Positions: Specify the maximum number of positions allowed.
Time Frame: Adjust the time frame based on the currency pair or asset being traded (e.g., 15-minute for EUR/USD, 30-minute for GBP/USD).
🔸Backtesting and Practice Backtest the strategy on historical data to understand how it performs in various market environments.
Practice using the strategy on a demo account before implementing it in live trading.
Test different time frames and asset pairs to find the most suitable combinations.
🔸Market Awareness Keep an eye on market news and events that might cause extreme price movements. The strategy reacts to price data and might not account for news-driven events that can cause large deviations.
Remember that this strategy is not recommended for stocks due to the A/D line's inability to account for gaps in its calculation.
🔸Visual Customization Visualization Settings: Customize the display of entry price, take profit, and stop loss levels.
Color Settings: Switch to the AlgoFyre theme or set custom colors for bullish, bearish, and neutral states.
Table Settings: Enable or disable the information table and adjust its position.
🔶 CONCLUSION
The Central Pivot Point Cross & Retrace Strategy provides a robust framework for capitalizing on price movements around key pivot levels by combining pivot point analysis with accumulation/distribution indicators. This strategy leverages pivot point crossovers to identify entry points and utilizes the A/D line crossover with its 200 EMA for trend confirmation, ensuring trades align with prevailing market conditions. By incorporating dynamic position sizing based on a fixed risk amount, traders can effectively manage risk and adapt to varying market conditions. The strategy's focus on trading around the central pivot point and its customizable stop-loss and take-profit levels further enhance its risk management capabilities, making it a versatile tool for both trending and ranging markets. With its strategic blend of technical indicators and risk management, the Central Pivot Point Cross & Retrace Strategy offers traders a comprehensive approach to optimizing trade execution and maximizing potential returns across various currency pairs and commodities.

Pivot Data [QuantVue]The Pivot Data Indicator is designed to provide traders with valuable insights by identifying and analyzing pivot points on the price chart. It calculates both pivot highs and lows, then presents detailed statistics on the distance and time between these pivots.
a pivot point is defined as a specific point on the chart where the price either reaches a high or a low, with no bars higher or lower than it for a set number of bars on both sides (left and right). Essentially, it's a local high or low point, with the market moving in the opposite direction after the pivot forms.
For example:
A pivot high occurs when there are no bars with higher prices for a specified number of bars before and after that point.
A pivot low occurs when there are no bars with lower prices for the same number of bars on either side.
The number of bars to the left and right is adjustable via the Pivot Lookback Bars setting, allowing you to define how many bars are used to determine these pivot points.
Key features include:
Pivot Highs and Lows Identification: Automatically marks significant pivot highs and lows based on a user-defined lookback period, helping traders identify potential trend reversals or continuation points.
Prediction Labels: Provides forecasted pivot levels based on historical pivot price and time patterns, with options to show predictions for pivot highs, lows, or any pivot point.
Customizable Table Display: Displays a table summarizing important statistics, such as the average price percentage and the number of bars between pivots, along with the distance and time from the most recent pivot.
Traders can use this tool to map out potential levels of support and resistance based on historical data on pivot points.

False Breakouts [TradingFinder] Fake Breakouts Failure🔵 Introduction
Technical indicators are essential tools for analysts and traders in financial markets, helping them predict price movements and make better trading decisions. One of the key concepts in technical analysis that should be carefully considered is the "False Breakout."
This phenomenon occurs when a price temporarily breaks through a significant support or resistance level but fails to hold and quickly returns to its previous range. Understanding this concept and applying it in trading can reduce risks and increase profitability.
🟣 What is a False Breakout?
A Fake Breakout, as the name suggests, refers to a breakout that appears to occur but fails to sustain, leading the price to quickly revert back to its previous range. This situation often happens when inexperienced or non-professional traders, under psychological pressure and eager to enter the market quickly, initiate trades.
This creates opportunities for professional traders to take advantage of these short-term fluctuations and execute successful trades.
🟣 The Importance of Recognizing False Breakouts
Recognizing False Breakouts is crucial for any trader aiming for success in financial markets. False Breakouts typically occur when the market approaches a critical support or resistance level.
In these situations, many traders are waiting to see if the price will break through this level. However, when the price quickly returns to its previous range, it indicates weakness in the movement and the inability to sustain the breakout.
🟣 How to identify False Breakouts?
To identify Fake Breakouts, it is important to carefully analyze price charts and look for signs of a quick price reversal after breaking a key level.
Here are some chart patterns that may help you identify a False Breakout :
1. Pin Bar Pattern : The Pin Bar is a candlestick pattern that indicates a price reversal. This pattern usually appears near support and resistance levels, showing that the price attempted to break through a key level but failed and reversed.
2. Fakey Pattern : This pattern, which consists of several candlesticks, indicates a False Breakout and a quick price return to the previous range. It usually appears near key levels and can signal a trend reversal.
3. Using Multiple Timeframes : One way to identify False Breakouts is by using charts of different timeframes. Sometimes, a breakout on a one-hour chart may be a False Breakout on a daily chart. Analyzing charts across multiple timeframes can help you accurately identify this phenomenon.
🔵 How to Use
Once you identify a False Breakout, you can use it as a trading signal. For this, it is best to look for trading opportunities in the opposite direction of the False Breakout. In other words, if a False Breakout occurs at a resistance level, you might consider selling opportunities, and if it happens at a support level, you might look for buying opportunities.
Here are some key points for trading based on False Breakouts :
1. Patience and Discipline : Patience and discipline are crucial when trading with False Breakouts. Wait for the False Breakout to clearly form before entering a trade.
2. Use Stop Loss : Setting an appropriate stop loss is vital when trading based on False Breakouts. Typically, the stop loss can be placed near the level where the False Breakout occurred.
3. Seek Confirmations : Before entering a trade, look for additional confirmations. These can include other analyses or technical indicators that show the price is likely to return to its previous level.
🔵 Settings
🟣 Logical settings
Swing period : You can set the swing detection period.
Max Swing Back Method : It is in two modes "All" and "Custom". If it is in "All" mode, it will check all swings, and if it is in "Custom" mode, it will check the swings to the extent you determine.
Max Swing Bac k: You can set the number of swings that will go back for checking.
🟣 Display settings
Displaying or not displaying swings and setting the color of labels and lines.
🟣 Alert Settings
Alert False Breakout : Enables alerts for Breakout.
Message Frequency : Determines the frequency of alerts. Options include 'All' (every function call), 'Once Per Bar' (first call within the bar), and 'Once Per Bar Close' (final script execution of the real-time bar). Default is 'Once per Bar'.
Show Alert Time by Time Zone : Configures the time zone for alert messages. Default is 'UTC'.
🔵Conclusion
False Breakouts, as a key concept in technical analysis, are powerful tools for identifying sudden price changes and using them in trading. Understanding this phenomenon and applying it can help traders perform better in financial markets and avoid potential losses.
To benefit from False Breakouts, traders need to carefully analyze charts and use the appropriate analytical tools. By leveraging this strategy, traders can achieve lower-risk and higher-reward trades.

Pivot Point Calculator [JP&Dia]English User Guide
Script Name: Pivot Point Calculator
What Does This Script Do? This script calculates classic and Camarilla pivot points used in financial markets. Pivot points are used to identify key support and resistance levels, and this script helps traders better understand market movements.
How to Use It?
Add the script to your charts on TradingView.
Enter your desired time frame in the “Enter Time Frame” field (e.g., M, W, D).
Choose either or both “Classic Pivot” and “Camarilla Pivot” options to display them.
The script will automatically calculate the pivot points and display them on the chart.
Why Is This Script Unique? This script combines both classic and Camarilla pivot calculations, allowing users to easily utilize both pivot styles through a single script.
How Can People Benefit? Traders can use this script to identify potential buy-sell points and market trends. They can also conduct their market analyses more efficiently and effectively.
Script Adı: Pivot Noktası Hesaplayıcı
Script Ne İşe Yarar? Bu script, finansal piyasalarda kullanılan klasik ve Camarilla pivot noktalarını hesaplar. Pivot noktaları, önemli destek ve direnç seviyelerini belirlemek için kullanılır ve bu script, yatırımcıların piyasa hareketlerini daha iyi anlamalarına yardımcı olur.
Nasıl Kullanılır?
Scripti TradingView’deki grafiklerinize ekleyin.
“Zaman Dilimi Girin” alanına istediğiniz zaman dilimini girin (Örneğin: M, W, D).
“Classic Pivot” ve “Camarilla Pivot” seçeneklerinden birini veya her ikisini de seçerek gösterilmesini sağlayabilirsiniz.
Script otomatik olarak pivot noktalarını hesaplayacak ve grafik üzerinde gösterecektir.
Neden Özgü Bir Script? Bu script, hem klasik hem de Camarilla pivot hesaplamalarını birleştirir ve kullanıcıların her iki pivot stilini de tek bir script üzerinden kolayca kullanmalarını sağlar.
İnsanlar Nasıl Faydalanabilir? Yatırımcılar, bu scripti kullanarak potansiyel alım-satım noktalarını ve piyasa trendlerini belirleyebilirler. Ayrıca, piyasa analizlerini daha verimli ve etkili bir şekilde yapabilirler.
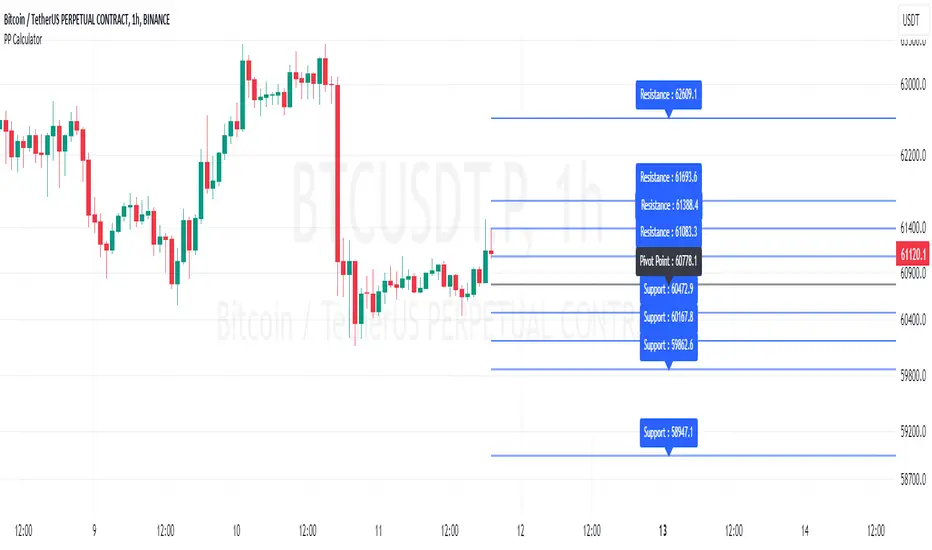
AI SuperTrend x Pivot Percentile - Strategy [PresentTrading]█ Introduction and How it is Different
The AI SuperTrend x Pivot Percentile strategy is a sophisticated trading approach that integrates AI-driven analysis with traditional technical indicators. Combining the AI SuperTrend with the Pivot Percentile strategy highlights several key advantages:
1. Enhanced Accuracy in Trend Prediction: The AI SuperTrend utilizes K-Nearest Neighbors (KNN) algorithm for trend prediction, improving accuracy by considering historical data patterns. This is complemented by the Pivot Percentile analysis which provides additional context on trend strength.
2. Comprehensive Market Analysis: The integration offers a multi-faceted approach to market analysis, combining AI insights with traditional technical indicators. This dual approach captures a broader range of market dynamics.
BTC 6H L/S Performance
Local
█ Strategy: How it Works - Detailed Explanation
🔶 AI-Enhanced SuperTrend Indicators
1. SuperTrend Calculation:
- The SuperTrend indicator is calculated using a moving average and the Average True Range (ATR). The basic formula is:
- Upper Band = Moving Average + (Multiplier × ATR)
- Lower Band = Moving Average - (Multiplier × ATR)
- The moving average type (SMA, EMA, WMA, RMA, VWMA) and the length of the moving average and ATR are adjustable parameters.
- The direction of the trend is determined based on the position of the closing price in relation to these bands.
2. AI Integration with K-Nearest Neighbors (KNN):
- The KNN algorithm is applied to predict trend direction. It uses historical price data and SuperTrend values to classify the current trend as bullish or bearish.
- The algorithm calculates the 'distance' between the current data point and historical points. The 'k' nearest data points (neighbors) are identified based on this distance.
- A weighted average of these neighbors' trends (bullish or bearish) is calculated to predict the current trend.
For more please check: Multi-TF AI SuperTrend with ADX - Strategy
🔶 Pivot Percentile Analysis
1. Percentile Calculation:
- This involves calculating the percentile ranks for high and low prices over a set of predefined lengths.
- The percentile function is typically defined as:
- Percentile = Value at (P/100) × (N + 1)th position
- Where P is the desired percentile, and N is the number of data points.
2. Trend Strength Evaluation:
- The calculated percentiles for highs and lows are used to determine the strength of bullish and bearish trends.
- For instance, a high percentile rank in the high prices may indicate a strong bullish trend, and vice versa for bearish trends.
For more please check: Pivot Percentile Trend - Strategy
🔶 Strategy Integration
1. Combining SuperTrend and Pivot Percentile:
- The strategy synthesizes the insights from both AI-enhanced SuperTrend and Pivot Percentile analysis.
- It compares the trend direction indicated by the SuperTrend with the strength of the trend as suggested by the Pivot Percentile analysis.
2. Signal Generation:
- A trading signal is generated when both the AI-enhanced SuperTrend and the Pivot Percentile analysis agree on the trend direction.
- For instance, a bullish signal is generated when both the SuperTrend is bullish, and the Pivot Percentile analysis shows strength in bullish trends.
🔶 Risk Management and Filters
- ADX and DMI Filter: The strategy uses the Average Directional Index (ADX) and the Directional Movement Index (DMI) as filters to assess the trend's strength and direction.
- Dynamic Trailing Stop Loss: Based on the SuperTrend indicator, the strategy dynamically adjusts stop-loss levels to manage risk effectively.
This strategy stands out for its ability to combine real-time AI analysis with established technical indicators, offering traders a nuanced and responsive tool for navigating complex market conditions. The equations and algorithms involved are pivotal in accurately identifying market trends and potential trade opportunities.
█ Usage
To effectively use this strategy, traders should:
1. Understand the AI and Pivot Percentile Indicators: A clear grasp of how these indicators work will enable traders to make informed decisions.
2. Interpret the Signals Accurately: The strategy provides bullish, bearish, and neutral signals. Traders should align these signals with their market analysis and trading goals.
3. Monitor Market Conditions: Given that this strategy is sensitive to market dynamics, continuous monitoring is crucial for timely decision-making.
4. Adjust Settings as Needed: Traders should feel free to tweak the input parameters to suit their trading preferences and to respond to changing market conditions.
█Default Settings and Their Impact on Performance
1. Trading Direction (Default: "Both")
Effect: Determines whether the strategy will take long positions, short positions, or both. Adjusting this setting can align the strategy with the trader's market outlook or risk preference.
2. AI Settings (Neighbors: 3, Data Points: 24)
Neighbors: The number of nearest neighbors in the KNN algorithm. A higher number might smooth out noise but could miss subtle, recent changes. A lower number makes the model more sensitive to recent data but may increase noise.
Data Points: Defines the amount of historical data considered. More data points provide a broader context but may dilute recent trends' impact.
3. SuperTrend Settings (Length: 10, Factor: 3.0, MA Source: "WMA")
Length: Affects the sensitivity of the SuperTrend indicator. A longer length results in a smoother, less sensitive indicator, ideal for long-term trends.
Factor: Determines the bandwidth of the SuperTrend. A higher factor creates wider bands, capturing larger price movements but potentially missing short-term signals.
MA Source: The type of moving average used (e.g., WMA - Weighted Moving Average). Different MA types can affect the trend indicator's responsiveness and smoothness.
4. AI Trend Prediction Settings (Price Trend: 10, Prediction Trend: 80)
Price Trend and Prediction Trend Lengths: These settings define the lengths of weighted moving averages for price and SuperTrend, impacting the responsiveness and smoothness of the AI's trend predictions.
5. Pivot Percentile Settings (Length: 10)
Length: Influences the calculation of pivot percentiles. A shorter length makes the percentile more responsive to recent price changes, while a longer length offers a broader view of price trends.
6. ADX and DMI Settings (ADX Length: 14, Time Frame: 'D')
ADX Length: Defines the period for the Average Directional Index calculation. A longer period results in a smoother ADX line.
Time Frame: Sets the time frame for the ADX and DMI calculations, affecting the sensitivity to market changes.
7. Commission, Slippage, and Initial Capital
These settings relate to transaction costs and initial investment, directly impacting net profitability and strategy feasibility.

Pivot Percentile Trend - Strategy [presentTrading]
█ Introduction and How it is Different
The "Pivot Percentile Trend - Strategy" from PresentTrading represents a paradigm shift in technical trading strategies. What sets this strategy apart is its innovative use of pivot percentiles, a method that goes beyond traditional indicator-based analyses. Unlike standard strategies that might depend on single-dimensional signals, this approach takes a multi-layered view of market movements, blending percentile calculations with SuperTrend indicators for a more nuanced and dynamic market analysis.
This strategy stands out for its ability to process multiple data points across various timeframes and pivot lengths, thereby capturing a broader and more detailed picture of market trends. It's not just about following the price; it's about understanding its position in the context of recent historical highs and lows, offering a more profound insight into potential market movements.
BTC 6h L/S
Where traditional methods might react to market changes, the Pivot Percentile Trend strategy anticipates them, using a calculated approach to identify trend strengths and weaknesses. This foresight gives traders a significant advantage, allowing for more strategic decision-making and potentially increasing the chances of successful trades.
In essence, this strategy introduces a more comprehensive and proactive approach to trading, harnessing the power of advanced percentile calculations combined with the robustness of SuperTrend indicators. It's a strategy designed for traders who seek a deeper understanding of market dynamics and a more calculated approach to their trading decisions.
Local picture
█ Strategy, How It Works: Detailed Explanation
🔶 Percentile Calculations
- The strategy employs percentile calculations to assess the relative position of current market prices against historical data.
- For a set of lengths (e.g., `length * 1`, `length * 2`, up to `length * 7`), it calculates the 75th percentile for high values (`percentilesHigh`) and the 25th percentile for low values (`percentilesLow`).
- These percentiles provide a sense of where the current price stands compared to recent price ranges.
Length - 10
Length - 15
🔶 SuperTrend Indicator
- The SuperTrend indicator is a key component, providing trend direction signals.
- It uses the `currentTrendValue`, derived from the difference between bull and bear strengths calculated from the percentile data.
* used the Supertrend toolkit by @EliCobra
🔶 Trend Strength Counts
- The strategy calculates counts of bullish and bearish indicators based on comparisons between the current high and low against high and low percentiles.
- `countBull` and `countBear` track the number of times the current high is above the high percentiles and the current low is below the low percentiles, respectively.
- Weak bullish (`weakBullCount`) and bearish (`weakBearCount`) counts are also determined by how often the current lows and highs fall within the percentile range.
*The idea of this strength counts mainly comes from 'Trend Strength Over Time' @federalTacos5392b
🔶 Trend Value Calculation
- The `currentTrendValue` is a crucial metric, computed as `bullStrength - bearStrength`.
- It indicates the market's trend direction, where a positive value suggests a bullish trend and a negative value indicates a bearish trend.
🔶 Trade Entry and Exit Logic
- The entry points for trades are determined by the combination of the trend value and the direction indicated by the SuperTrend indicator.
- For a long entry (`shouldEnterLong`), the `currentTrendValue` must be positive and the SuperTrend indicator should show a downtrend.
- Conversely, for a short entry (`shouldEnterShort`), the `currentTrendValue` should be negative with the SuperTrend indicating an uptrend.
- The strategy closes positions when these conditions reverse.
█ Trade Direction
The strategy is versatile, allowing traders to choose their preferred trading direction: long, short, or both. This flexibility enables traders to tailor their strategies to their market outlook and risk appetite.
█ Default Settings and Customization
1. Trade Direction: Selectable as Long, Short, or Both, affecting the type of trades executed.
2. Indicator Source: Pivot Percentile Calculations, key for identifying market trends and reversals.
3. Lengths for Percentile Calculation: Various configurable lengths, influencing the scope of trend analysis.
4. SuperTrend Settings: ATR Length 20, Multiplier 18, affecting indicator sensitivity and trend detection.
5. Style Options: Custom colors for bullish (green) and bearish (red) trends, aiding visual interpretation.
6. Additional Settings: Includes contrarian signals and UI enhancements, offering strategic and visual flexibility.
