Percentile Trend Channel [DW]This is an experimental study designed to identify the trend of price action over a specified period using percentiles.
First, the 50th percentile is calculated over the sampling period using the nearest rank method. I've found that this calculation is useful as a proxy for moving averages and other filters of that class.
Next, the channel levels are calculated. In this study, there are three channel methods to choose from:
-Percentile Donchian, which calculates Donchian Channels using the 100th and 0th percentile ranks
-Percentile Keltner, which calculates the 50th percentile true range multiplied by a specified amount, then adds it to and subtracts it from the 50th percentile
-Percentile Bollinger, which calculates 50th percentile standard deviation multiplied by a specified amount, then adds it to and subtracts it from the 50th percentile
I also included a squeeze box option within this script, which is derived from my original Squeeze Box tool.
This option detects squeezes in the specified channel's range by a specific percentage, and plots the channel values where the squeeze begins.
The box also has a range multiplier, which can be used to expand or contract its range.
Custom bar colors are included. The color scheme is based on the perceived trend over the specified sampling period.
Priceaction

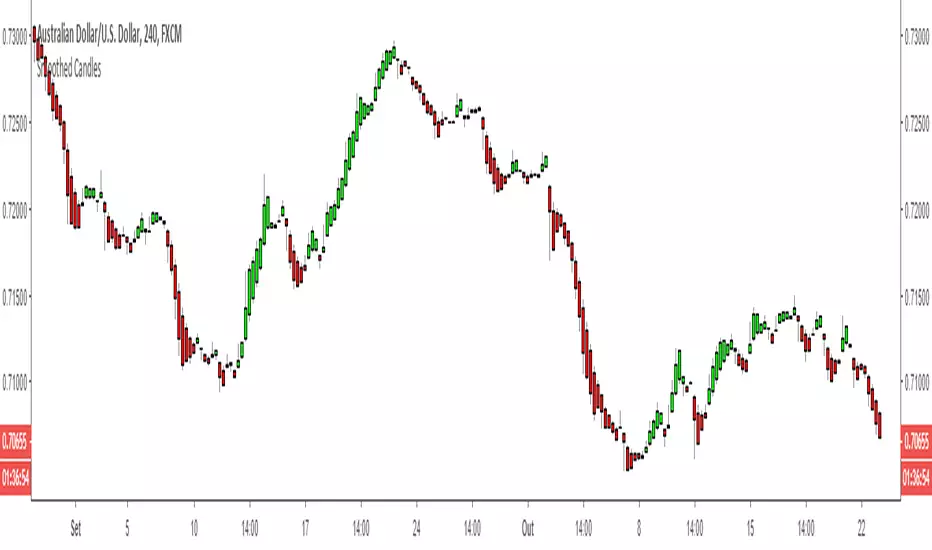
Smoothed Candles ProIt is a graphical indicator used to identify trends and pullbacks. Through it, it is possible to eliminate the noises and clearly see the smoothed pattern.
How should I use it ? This is just a example to be used with this indicator.
Let's assume that we are looking for sell opportunities.
step 1: identify some (at least 3) positives (green) candles with a good volume , excluding consolidation regions.
step 2: wait for negative (red) candles with a good volume and also all previous candles must be by majority green.
step 3: wait for pullback with high volume or consolidation region to close the position.
AUDUSD
The example can be better described in the image below:
EURUSD
Another example os use, displayed in the image below:
EURJPY
Look how makes it easy to identify tops and bottoms.
BTCUSD
Very easy to indetify trends:
GBPUSD
Very easy to indetify pullbacks:
It can be used with almost of pairs!
Send me a private msg to get the script!
You can purchase the script here:
perfect-cat-87.localtunnel.me

Smoothed CandlesIt is a graphical indicator used to identify trends and pullbacks. Through it, it is possible to eliminate the noises and clearly see the smoothed pattern.
How should I use it ? This is just a example to be used with this indicator.
Let's assume that we are looking for sell opportunities.
step 1: identify some (at least 3) positives (green) candles with a good volume, excluding consolidation regions.
step 2: wait for negative (red) candles with a good volume and also all previous candles must be by majority green.
step 3: wait for pullback with high volume or consolidation region to close the position.
FX:AUDUSD
The example can be better described in the image below:
FX:EURUSD
Another example os use, displayed in the image below:
FX:EURJPY
Look how makes it easy to identify tops and bottoms.
BITFINEX:BTCUSD
Very easy to indetify trends:
OANDA:GBPUSD
Very easy to indetify pullbacks:
FX_IDC:AUDGBP
It can be used with almost of pairs!
You can buy the script here:
502a96d9.ngrok.io
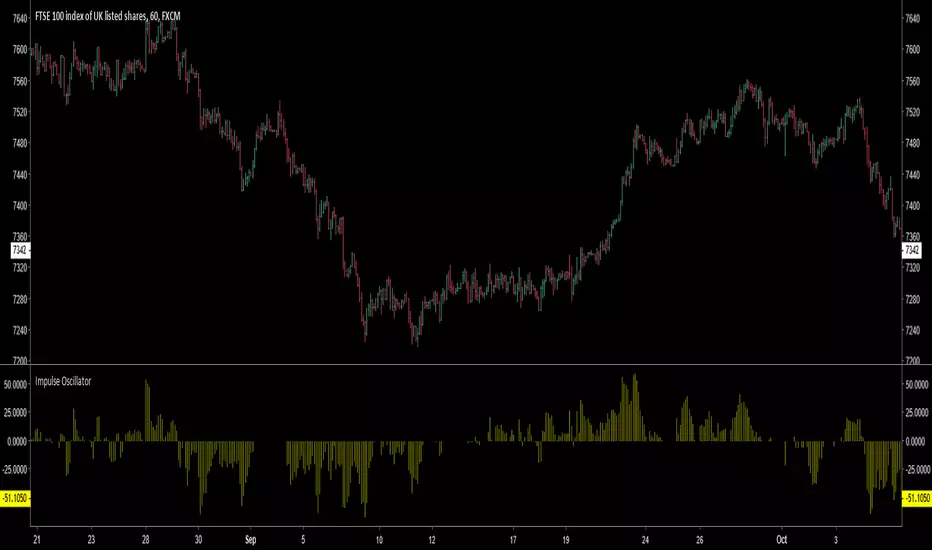
Impulse Oscillator without legs for Price Action & Elliott WavesHi Traders,
I have a newcomer for impulsetrading.
This indicator is an oscillator that show without legs impulses of Price Action .
For the expertise: you can use it for counting elliott waves !
Have fun and winning trades!
NeoIchi
The idea of this oscillator / indicator came from Ichimoku , how it draws and how it calculates different averages in different scales.
The formula used for this indicator is totally different from Ichimoku , as you can compare the left and right charts, with same setting between my indicator and ichimoku , different results show up.
The inputs that you can use for this indicator/oscillator :
1- HLC3 (better to through it on the chart just like ichimoku
2- acceleration - deceleration (set the first parameter to 5 and the second to 34 for standard calculations)
3- pure volume
4- OBV ( On Balance Volume )
5- Bill Williams MFI ( Market Facilitation Index )
6- Momentum : This one can have different options : set with Barry Burn's formula and bar scale for when the charts are 1 to 3 ratio (B 3) or when they are not 1 to 3 (B), Bill William standard (W), Hybrid with barry's input (Would be bar close but I replaced it with HLC3, better results) but Bill William time scale for calculations (H), and finally, use Bill Williams MFI as input but use Barry Burn's time scales in formula (H M)
If you have any specific input in mind that you think would be nice to have in this system, through a comment bellow and I will add it to the system.
This oscillator / indicator is for sale, you can buy a life long licence that would include all updates with 0.01 BTC. Send the BTC + transaction fee to the wallet address bellow :
12EDAYA52DzcXdh9aLC9Pqqfhm1jNMjxNo
after sending the BTC , contact me in pm and send the transaction ID with your trading view's ID and I will give you access to this oscillator / indicator

-TEXAS KARATE MONKEY DEATH HOLD´EMthis is an updated version of the Swinging Karate monkey Death Crossing PRO, now it includes a tool for longer lasting Swing Trades
default upload of the indicator shows the regular previous indicator (placing the price line on top of the chart, you´ll have to manually reposition it, sorry newbie coder headaches ): )
on settings you have the option to activate the SwingZone, which will load and area signaling the Swing Zones on red or green for longs and shorts, which you should look for entry points and a white/red moving average, which crossings with the price line might be taken as an early exit signal (not perfect, but its best i could come up after a lot of trial and error), or you could use the stopcrossing line from the previous indicator :)
the Swing feature can be used on any timeframe, 1h its recomended
Happy Swing Trading

New Candlestick PatternsI have redesigned the first candlestick patterns. This one works with most time frames... The only time frames that it have some difficulties is the 1min to 15min and only on the doji, because sometimes the doji doesnt have any points(pips) in movement.
1. This is a editable indicator. You can change all the colors the way you want them. I have changed my background to the gray/black so that I can see the bright colors easily.
2. I have coded the indicator so that whenever you have a candlestick pattern forming it will send you an alert if you have created one. You can create one alert for all the patterns happening on the chart. (P.S - The higher highs and lower lows is not included in the alert system because its only a indication of the trend/support & resistance)
3. If you want only one of the indicators that is all in one here, you are more than welcome to let me know if you would like to have only one of them.
Note - I will give anyone access to this for a trail period of 2 weeks. Please let me know if you want to test this.
Thank you for your support and likes :)

Taribo EMA StrategyIt is a simple script that take price action and EMA 13 crossovers to give visual buy and sell signals which works on all timelines.
Sample Chart:

ULTIMATE ICHIMOKU TRADING SUITEThis is an update of "Uncle Mo's Ultimate Ichimoku V1"
Main features:
2 x Ichimoku Cloud
5 x EMA
2 x MA
1 x HullMA
Williams Fractal
Bollinger Bands - ***NEW***
ATR - ***NEW***
PSAR - ***NEW***
Candlestick Patterns - ***NEW***
Price Action Bars- ***NEW***
List of credits:
@br0qn for the Ichimoku
@RicardoSantos for the Bill Williams Fractal
@EmilianoMesa for the EMAs/MAs
@mohamed982 for the HullMA
@ymaheshreddy4u for the Bollinger Bands
@ChrisMoody for the Price Action Bars and PSAR
@HPotter for the ATR
@repo32 for the Candlestick Patterns
The script is open source and free to use. Feel free to change it around to suit your needs.
***If you copy & paste code from other traders to make your own script, please do remember to give them credit for their amazing work.***
Happy trading!

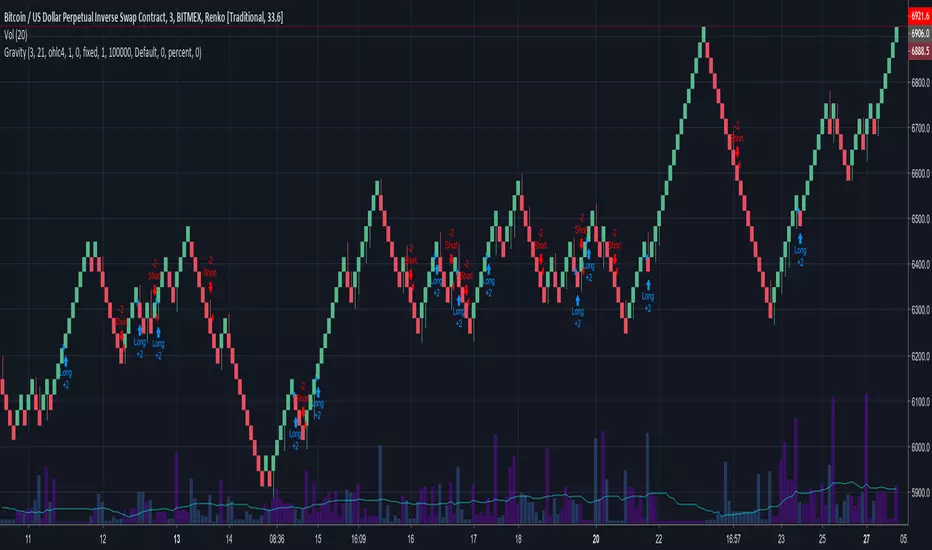
GravityBuys and sells make relative ripples in the market that can be leaned into for the trader's advantage. In order to get the most out of these ripples we need to consider space (price) as much as time. Renko charts with traditional box sizes (representing about a 0.4% move) can help us to achieve this.
This strategy is a drop in the cosmic bucket compared to what's out there, but it can help anyone who's lost money between January and now.
For traders who are looking for more of an edge, visit here:
Enjoy!
{CDT} v1.10- Market X-rayHi
This is a personal project at the moment...depends if anyone thinks this is remotely useful...?
I made this script to learn how to trade, like most new to trading i was foolish until i really, really, looked at the dynamics of the market in detail...zoom in, see what i mean, but see the many, many opportunities... for success, and failure!
There is a lot going on in this script, but its all the good stuff, don't be overwhelmed! Once you understand what all the colours and lines are you will be fine. I hate looking at charts with like 10 oscillators below the price... yeah, divergence i hear you say, but no.
If you want a buy / sell signal script thats certain, then this is not for you. This is going to show you the technical opportunities, the decision is yours.
If you want a "BOT", then this isn't it... they don't work anyway.... You need to press the button...it's your money!
It doesn't repaint, or use securities, or anything like that, and it works with all candle types, time frames and assets. I like heiken simply to shut out the noise.
If you want to see and learn about the dynamic of the marketplace so you can pick you buy / sell signal and want to know what all the lines and colours mean, then this is for you.
If anyone is interested in access to this then let me know. I'll then polish it up into something you might enjoy and provide full information on what all the colour bands and lines are etc..
Regards

Price Volume ActionReal price movement vs. expectation based on volume. Useful for evaluating price/volume relationship and drawing insight.
The blue line is real % price movement. The background columns represent the expected % price movement based on the volume of that candle.
Similar to Ease of Movement in concept, but more appropriate for studying price action bar by bar.
The blue line (with default colors) being higher than it's gray column denotes ease of movement; a disproportionate amount of price movement compared to it's volume, basically a lack of resistance. The blue line being lower than the gray column implies higher resistance than expected.
In combination with the candles and volume this allows a deeper insight into the market action in context.
Options to switch between High/Low values and Open/Close values. Optional colorblind friendly color schemes.

Best Parabolic SAR Study and StrategyCustom built Parabolic Stop and Reversal (SAR)
Produces more responsive results.
Also included is an ATR based SAR which better indicates trend.
Long and short stops are marked on the chart and can be found in the style tab.
PSAR source is variable and is shown on the chart.
Trading source is variable, this is what is used to determine a change in direction against the calculate PSAR and for stops/reversals.
Access is open for now so long as I am getting constructive feedback. Thanks for trying it out!

SignalToSignal.com - Logical Trade LevelsOur Logical Trade Levels (Targets and Stall Points) indicator is a simple but powerful version of support and resistance. We do a fair bit a behind the scenes algorithmic magic but essentially these levels act as very strong support and resistance for entries and also targets. Many of our previously published ideas use these levels to determine likely stall points for our entries as well as best targets up and down. You can see from those published levels how easily you know where price will likely stall out or needs to move through.
While these levels work great for simple support and resistance style break out trading, they work even better when used in combination with our other systems. When using Logical Trade Levels with our other indicators you have a complete solution for not only entering trades correctly (using our Volume Analysis Trading System) but also exiting and avoiding trades at what are the best and worst areas based on the Logical Trade Levels.
To gain access to the Logical Volume Trading System, please visit our website .
If you have any questions, please contact us through the Contact link on our website - signaltosignal.com

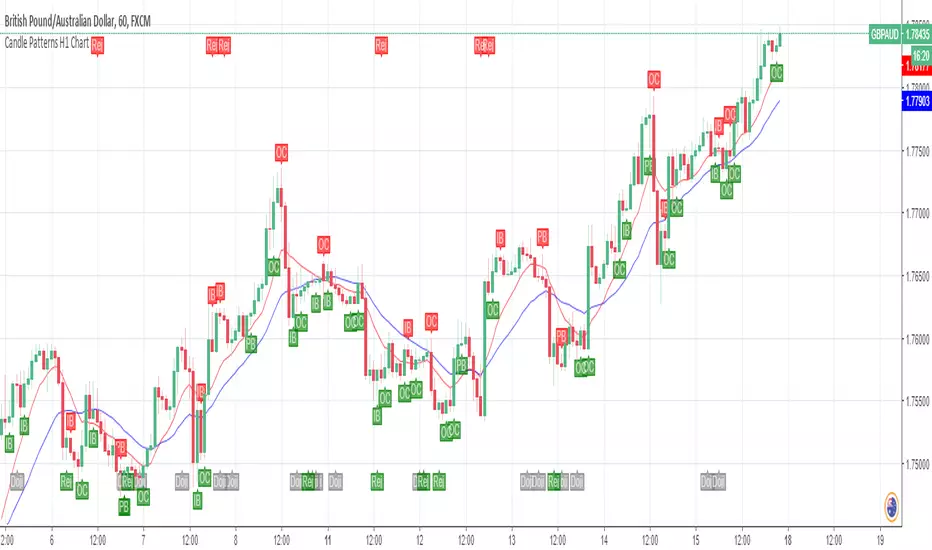
5x EMA RSI Candles, Price action candles
Hi all
Build in functions:
1. Price candle recognition;
a) Dark shadow cover,
b) Piercing line,
c) Doji, bearish and bullish
d) Bullish and bearish engulfing
e) Inside and outside bars
f) Up Reject Green Pin & Down Reject Red Pin Bar
g) Hammer & Inverted Hammer
2, RSI overbought and oversold candles
a.) Red = Overbought
b.) Geen = Oversold
3. EMA Background change:
a) Light green is Ema 21 greater than EMA 55 and above EMA 200 (In up trend)
b) Dark green is EMA 21 greater than EMA 55 and below EMA 200 (Start of up trend)
c) Light red is EMA 21 less than EMA 55 and above EMA 200 (Start of Down trend)
d) Dark red is EMA 21 less than EMA 55 and below EMA 200 (In Down trend)
4. Alerts:
a.) RSI Overbought
b.) RSI Oversold
c.) EMA Buy = Light green
d.) EMA Sell = Light red
e.) Price candle alerts
I would recommend to use
RSI - CM_Ultimate RSI MTF
MACD CM_MacD_Ult_MTF
For confirmation of trades.
Please take note this is invite only via BTC donation, keep the donation in mind when asking for access.
Thanks

Signal StreamSIGNAL STREAM
Want a TL;DR?
Signal Stream gives you actionable trading signals. It’s as simple as that.
LONG ANSWER
Signal Stream is the culmination of years and years of research, testing, and analysis of The Big Three data points of market information.
• Major Data Point One – PRICE. The one everyone cares about most.
• Major Data Point Two – TIME. We’re all bound by it. We can’t escape it.
• Major Data Point Three – VOLUME. With this third point, the market takes on an entirely new dynamic.
Signal Stream takes these points into account, runs them all through tested (ridiculously so) algorithms based of our knowledge and experience trading.
The result? Clean, actionable signals you can trade.
Primarily used on and around the 1 hour time frame. That’s the power of TradingView! So many custom time frames to look at!
Blue arrow pointing up? Go long!
Red arrow pointing down? Go short!
SIMPLY PRESENTED – COMPLEXITY HIDING UNDER THE HOOD
To be perfectly clear, this isn’t some script that does a couple MA crossovers and checks RSI against the Elliot Wave Fib Zig Zag on a Bollinger Band.
Signal Stream is 2000+ lines of tested, rigorous logic built in Pine for TradingView.
It’s based on a method of price action and volume analysis that has been proven profitable over and over for the past 10 years.
What method exactly? Weeeeell…. That’s our secret sauce. :)
But it’s a secret sauce developed over the past ten years by traders with a combined 25+ years in trading and trading system development.
We’ve refined our analysis of PRICE and TIME and VOLUME.
It’s a little bit like if pattern analysis and VSA had a kid and then taught that kid a lot of other really important market confluence ideas.
Okay, maybe that analogy got away from me….
Signal Stream is hours and and days and weeks and months and years spent in front of charts, writing code, staring at spreadsheets, testing, refining, and trading.
All distilled into a simple, power signal system.
SIGNAL STREAM GUARANTEE - NOT GONNA GIVE YOU THE RUN AROUND
Look, I can’t guarantee you will make money. That’s not only illegal, it’s also a ridiculous promise and absolutely a red flag. Anyone guaranteeing that you will make money is probably selling you snake oil and you should steer clear of them.
What I can guarantee is that there is no other indicator on TradingView right now that looks as deeply into PRICE, TIME, and VOLUME as Signal Stream does.
I guarantee you that Signal Stream provides clear, actionable signals based on 25+ years of experience and 10+ years of hardcore testing and live trading.
PM US TO GET PAYMENT INSTRUCTIONS AND ACCESS.

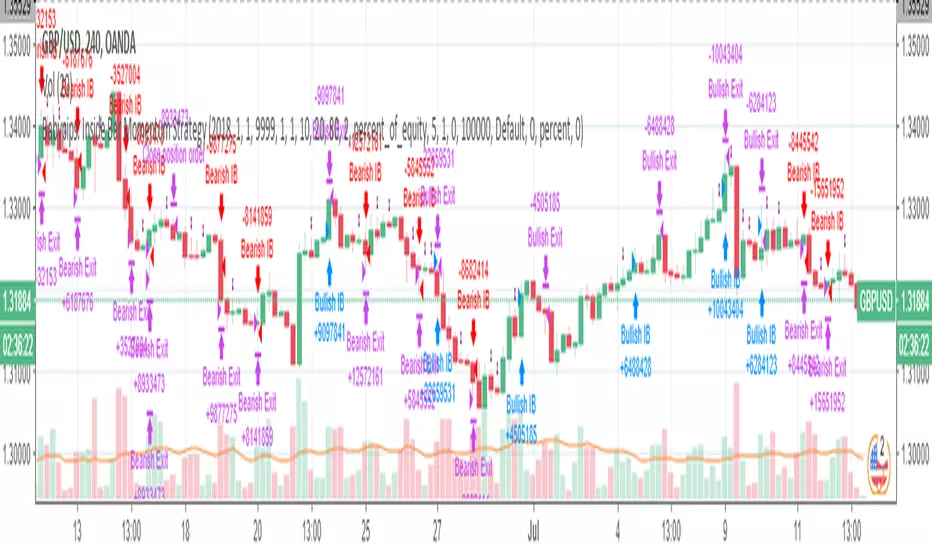
Babypips: Inside Bar Momentum StrategyThe strategy contained in this post comes courtesy of babypips (.com), an excellent resource for all thing forex related. If you are new to trading, the site is definitely worth checking out!
Code commentary and an introduction to Inside Bars are available for this post on the Backtest-Rookies (.com) website.
Note: If you are interested in custom development services, please check out our services page on the Backtest-Rookies site.
Strategy Overview
Inside Bar Momentum Strategy.
Inside Bar Detection
Position sizing based on stoploss distance ( Note: Based on equity and assumes that the account currency is the counter currency.
Stop buys for entries
Takeprofit / Stoplosses for exits
Control Stopbuy, Takeprofit and Stoploss targets with inputs
Control Backtest start/end dates
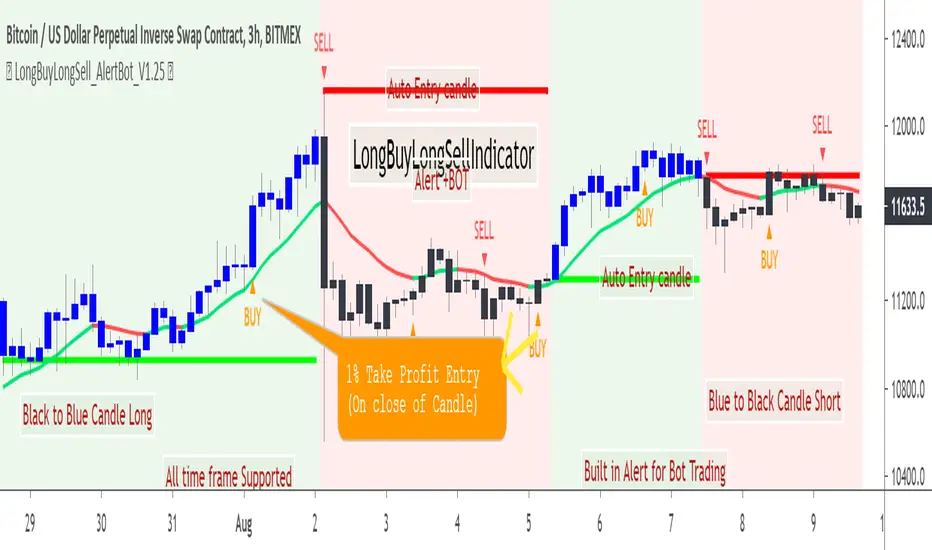
LongBuyLongSellIndicatorHello Friends,
Here is one more very simple to use LongBuyLongSellIndicator for trading. Details are given above in the chart.Happy trading.
This indicator can be used for very long term trading in any time frame. This is designed to avoid many noise in between the trade.
This indicator does not require any additional indicator setup ;as like traders do in price action trading ,just need to follow the colors for trading .
Always remember Black to Blue transition BUY (or cover the short position)
Blue to Black transition SELL(or cover the buy position)
Do not trade in the middle and ignore other colors if appear in the chart
Other Indicator that may be useful:
BUY2SELL2BUYindicator
SELL2BUY2SELLindicator
ProfitCandleBillionWayIndicator
Access is through invite only
AGHYAD_Renko+Sniper+PAB+TZ+ICHIMOKU_V21. MUST: RENKO ATR 2 YELOOW
2. STRONG: SNIPER 8,8 BUY SIGNAL
3. WEAK: TZ 6,6 BUY SIGNAL
========= SELL =========
1. STRONG: SNIPER 8,8 SELL SIGNAL
2. WEAK: TZ 6,6 SELL SIGNAL
3. WEAK: RENKO ATR 2 RED
=========NOTE=========
RENKO > SNIPER > TZ
6 minutes ago
the sniper buy signal is now based on renko

AGHYAD_Renko+Sniper+PAB+TZ========= BUY =========
1. MUST: RENKO ATR 3 YELOOW
2. STRONG: SNIPER 8,8 BUY SIGNAL
3. WEAK: TZ 6,6 BUY SIGNAL
========= SELL =========
1. STRONG: SNIPER 8,8 SELL SIGNAL
2. WEAK: TZ 6,6 SELL SIGNAL
3. WEAK: RENKO ATR 3 RED
=========NOTE=========
RENKO > SNIPER > TZ

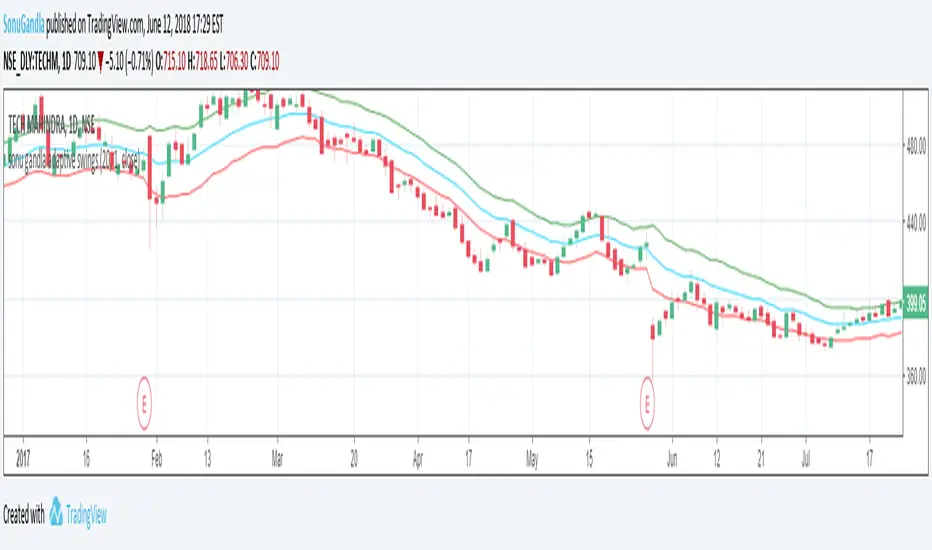
sonu gandla Adaptive swingssonu gandla adaptive swings is a price extreme adaptive indicator which make the trend more visible. When an asset is trending higher, it should regularly reach the upper adaptive (or very close to it), and even move past the upper adaptive on occasion. The price should also stay above the lower adaptive, and will often stay above the middle adaptive (or just barely dip below it). and as When an asset is trending lower, it should regularly reach the lower adaptive (or very close to it), and even move past it on occasion. The price should also stay below the upper adaptive , and will often stay below the middle adaptive (or just barely push above it) this is more price action oriented
YTC - Swing Highs & LowsThis Indicator Plots Swing Highs & Swing Lows based on Lance Beggs of (Your Trading Coach) definition:
A Swing High (SH) is a price bar high preceed by two lower highs (LH) and followed by two lower highs (LH)
In the event of multiple candles forming equal highs, this will still be defined as a swing high, provided that there are two candles with lower highs both preceding and following the multiple candle formation.
