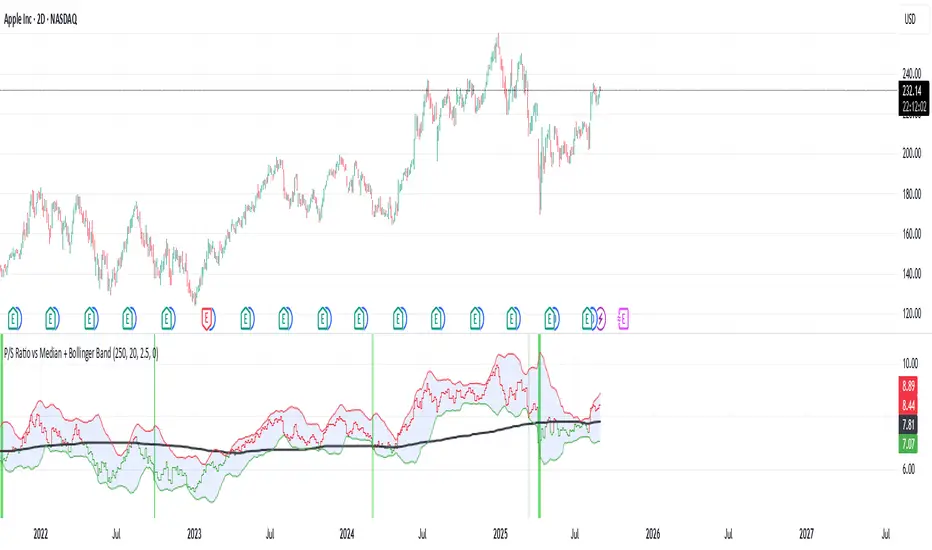
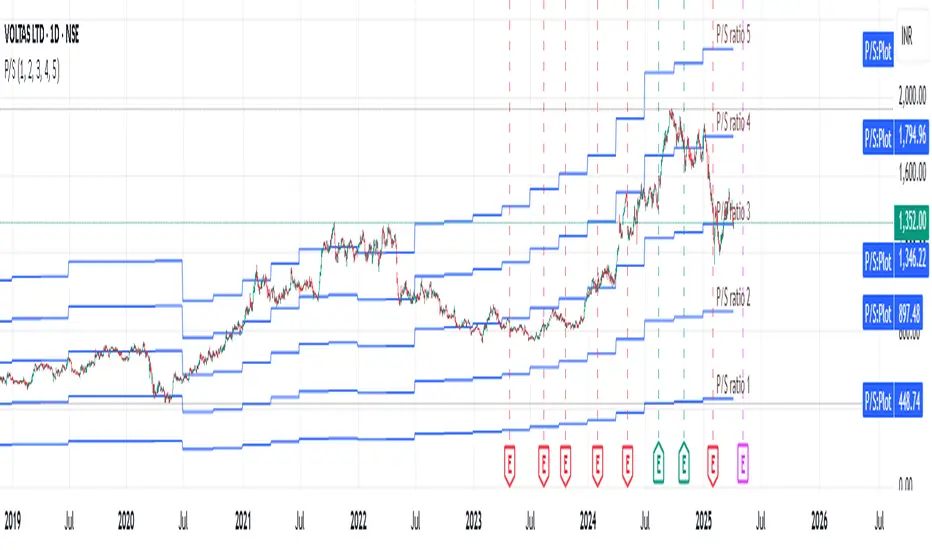
P/S Ratio vs Median + Bollinger Band- 📝 This indicator highlights potential buying opportunities by analyzing the Price-to-Sales (P/S) ratio in relation to Bollinger Bands and its historical median.
- 🎯 The goal is to provide a visually intuitive signal for value-oriented entries, especially when valuation compression aligns with historical context.
- 💡 Vertical green shading is applied when the P/S ratio drops below the lower Bollinger Band, which is calculated directly from the P/S ratio itself — not price. This condition ofte
Индикатор