Enhanced Widner Projection Bands - Mel Widner, Ph.D.Everybody has heard of Bollinger banding right? Well, if you are looking for those, you have come to the wrong place. This is something very similar though! These are "Enhanced Widner Projection Bands" in the overlay panel employing PSv4.0, originally devised by Mel Widner, Ph .D. for an article in TASC - July of 1995 Traders Tips. This indicator is freely available for all members to use.
Also, this is a companion indicator for my "Projection Oscillator"(displayed underneath) using modified code from that. The projection bands visually display how the wave forms are generated for the "Projection Oscillator" when the period controls are matched between both indicators. You will then see how the alignments are correlated between the projection bands and the projection oscillator. In this script however, the upper and lower banding is controlled independently, but can be controlled tandemly by enabling an override. I decided to incorporate some of my banding technology as well, offering color schemes, line thickness, and transparency controls. I also discovered a way to improve 1px line dithering using a simple technique. Overall, it's fairly easy to use, so I won't elaborate beyond what you have read already.
The comments section below is solely just for commenting and other remarks, ideas, compliments, etc... regarding only this indicator, not others. When available time provides itself, I will consider your inquiries, thoughts, and concepts presented below in the comments section if you do have any questions or comments regarding this indicator. When my indicators achieve more prevalent use by TV members, I may implement more ideas when they present themselves as worthy additions. As always, "Like" it if you simply just like it with a proper thumbs up, and also return to my scripts list occasionally for additional postings. Have a profitable future everyone!
Projection

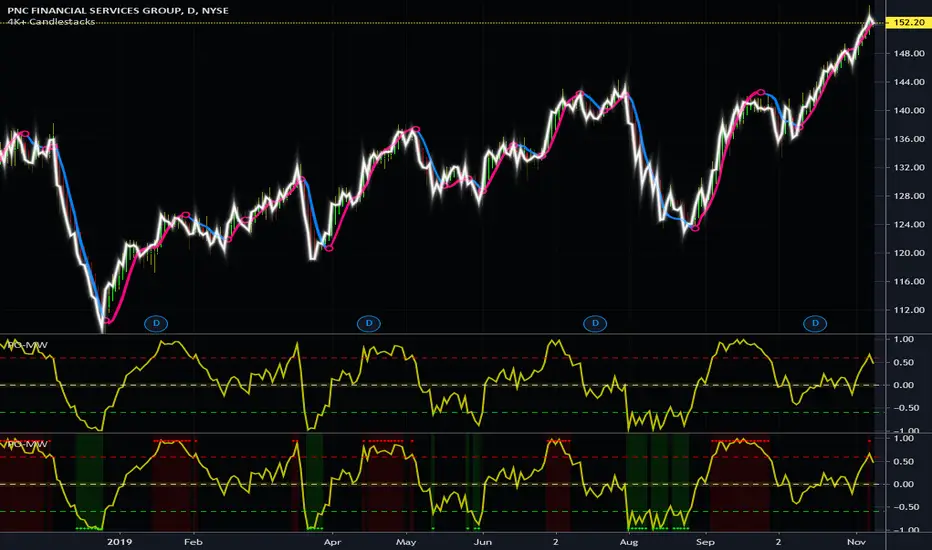
Projection Oscillator - Mel Widner, Ph.D.For any Mel Widner, Ph.D fans out there, I present this decades old "Projection Oscillator" employing PSv4.0, originally formulated by Mel Widner for TASC - July of 1995 Traders Tips. Just when you may have thought it was the end of the evolutionary line for Mel Widner technology, it's not! Basically it's a hybridization of linear regression, banding, and a stochastic rolled into one. It's purpose is intended to help identify reversal points.
While working on another member's project, I discovered other implementations on TV and a few scarcely found on the internet, they are not entirely correct and not in a package like this. I'm submitting this as a complimentary indicator for their trading system AND also for the TV community for hybridized indicator evolution. My implementation is a heavily modified version of the original indicator using novel techniques, surpassing Widner's original intended design.
Utilizing the "Power of Pine", I included the maximum amount of features I could surmise in an ultra small yet impressive package. Configurations are displayed above in multiple scenarios that should be suitable for most traders. Of notable mention, the original design was a range from 0-100 just like any other stochastic, but I rescaled the oscillator more towards a zero mean unity scale(+/-1.0), while still leaving the waveforms completely intact.
Features List Includes:
Dark Background - Easily disabled in indicator Settings->Style for "Light" charts or with Pine commenting
AND much, much more... you have the source!
For those of you who are new to Pine Script, this script also may help you understand advanced programming techniques in Pine and how they may be utilized in a most effective manner. I would like to see Tradingview become the go to platform for the best indicators attainable with this contribution to the TV community. This is commonly what my dense intricate code looks like behind the veil. If you are wondering why there is no notes, that's because the notation is in the variable naming. If you wish to contribute additional ideas, please do so below in the comments about all things Pine in regards to this indicator.
NOTICE: Copy pasting bandits who may be having nefarious thoughts, DO NOT attempt this, because this may violate Tradingview's terms, conditions and/or house rules regarding publishing and "fair" reuse of code. "WE" are always watching the TV community vigilantly for mischievous behaviors and actions that exploit well intended authors for the purpose of unscrupulously increasing brownie points in reputation scores. Hiding behind a "protected" wall may not protect you from investigation and account penalization by TV staff. Be respectful, and don't just throw a meaningless feature in there, then branding it as "your" gizmo if you reuse this code for publishing another indicator. Fair enough? Alrighty then... I firmly believe in "innovating" future state-of-the-art indicators, and please contact me if you wish to do so.
The comments section below is solely just for commenting and other remarks, ideas, compliments, etc... regarding only this indicator, not others. When available time provides itself, I will consider your inquiries, thoughts, and concepts presented below in the comments section if you do have any questions or comments regarding this indicator. When my indicators achieve more prevalent use by TV members, I may implement more ideas when they present themselves as worthy additions. As always, "Like" it if you simply just like it with a proper thumbs up, and also return to my scripts list occasionally for additional postings. Have a profitable future everyone!
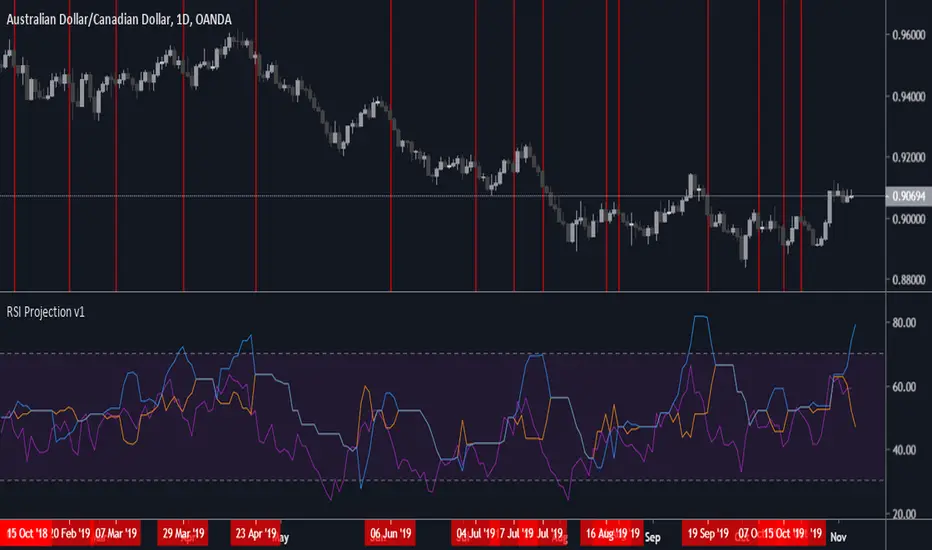
RSI Projection v1Application of concepts from Constance Brown "Technical Analysis for Trading Professionals", specifically: Chapter 7: Price Projections By Reverse Engineering Indicators , and Chapter 8: Price Objectives Derived From Positive and Negative Reversals In The RSI .
Specifically: I wanted to see if better Exit signals for the RSI could be generated from a basic application of some of the concepts in those chapters, and that is what I've found so far:
Exit when the RSI (purple) crosses below the orange line
Orange line is forecasted RSI for positive price reversals, blue line is forecasted RSI for negative price reversals
From what I can tell, this indicator does not work well during chop/consolidation and ranging periods, generating too many false signals without additional confluence from trending indicators and price analysis
This indicator should be considered highly experimental - do not use live trading without proper backtesting and parameter adjustment.
Tuning per asset and timeframe is required due to calculation type for highs/lows used for projection calculations
Projecting From StabilityStable periods that are projected can be found using Bollinger Band Percent Width Crossing RSI
The projected periods are paying most attention to the drop in % BBand width.

[RS]Channel Projection V1EXPERIMENTAL:
note: angle calculation is not correct.
added optional time calculation and bar calculation

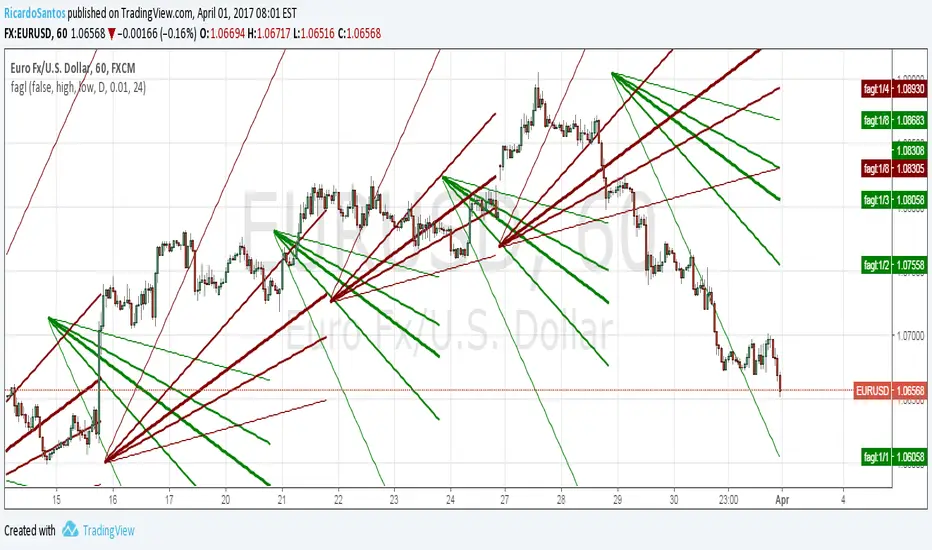
[RS]Fractal Auto Gann LinesEXPERIMENTAL:
GANN lines projection based on zigzag tops/bottoms, use at your own risk.