R-Smart - Relative Strength On observing the market for years I learned that Relative Strength will help us in staying invested in strong bullish stocks (relative to primary indices of your country, in my case it's Nifty 50 for India). Once you identify a strong stock, it's important to know if the stock is trending and is in momentum. To identify, trends and momentum, I used ADX and MACD indicators respectively as part of the R-Smart.
In R-Smart, I used Relative Strength primarily to plot the chart, if the Histogram is positive (greater than 0) then the security is bullish. But then how do we know that it's in trend and having momentum. Well the below color code will help you identify them
1. Histogram in Green : Strong Bullish
2. Histogram in Blue : Weak Bullish
3. Histogram in Orange: Bearish
Apart from the above indicator, I would like to use Super Trend to know the immediate support/resistances on the chart.
# StayInvested
# StayProfitable
# ManageYourRisk
Индикатор сравнение относительной силы

Comparative Relative Strength(CRS), ARS,SRS,Beta,RocShows comparative relative strength(CRS) against any benchmark script , if CRS is above ARS line than ARS is Positive and if CRS turns green than SRS is positive and vice versa.

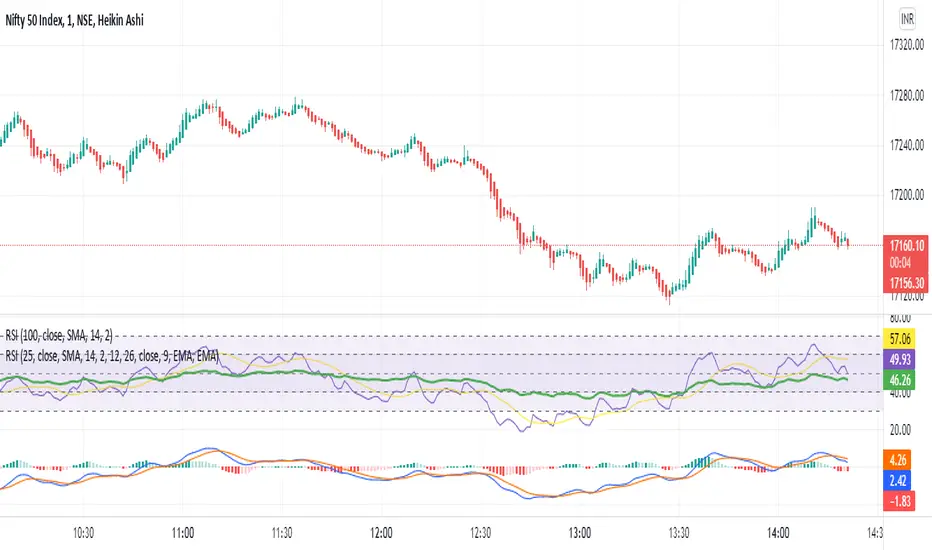
Aryangel_MACD+RSICombination of MACD and RSI, strong signal for buy/sell with MACD and RSI crossover.
Multiple Relative Strength (Multiple RS) (XP)Multiple Relative Strength (Multiple RS) (XP)
You can see three Relative Strength lines.
The lines are thicker going from RS1 to RS2 to RS3, for differentiation.
Using the three RS, you can see long, medium, and short term performance at once.

Relative StrengthRelative strength is a calculation of the price trend of a stock or a financial instrument in comparison to another instrument, stock, or industry. It shall be determined by taking the price of one commodity and dividing it by another.
Relative strength is a strategy used for determining value stocks and is used in momentum investing as well. It involves investing in stocks that have done well, in relation to their index or benchmark. For example, a relative strength investor might pick technology companies that have outperformed the Nasdaq Composite Index or large-cap stocks that are lagging against the S&P 500 index(Adjustable in the settings).
This indiator will give you a plot for relative strength between the current pair with another pair (adjustable in the settings), with a plotshape for RSNHBP & RSNH
Features :
1. Relative Strength
2. Double EMA of Relative Strength
3. RSNHBP & RSNH
How to use it :
1. Adjust All the settings parameter
2. For Alerting, Just use any alert function call, it will give you an alert of RSNHBP and RSNH

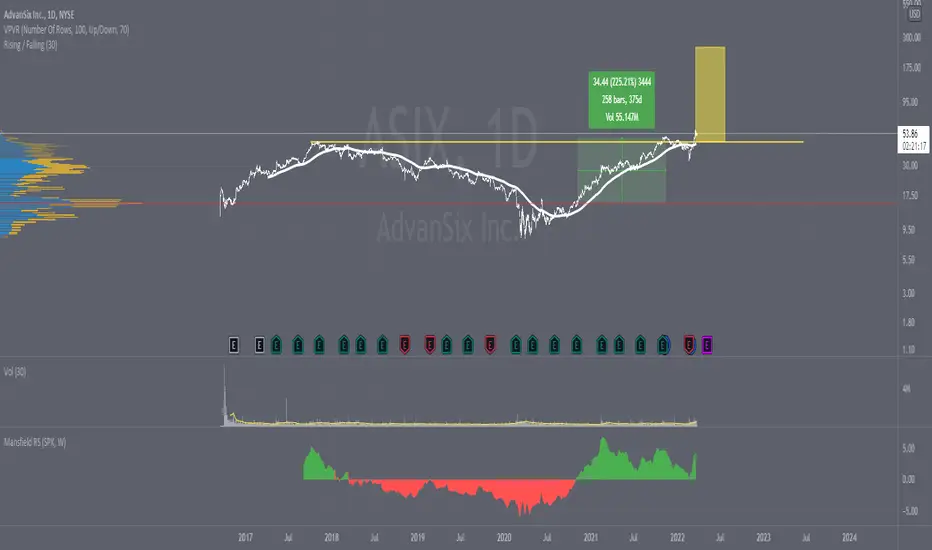
Mansfield RSHello,
I hope you like this representation of the Mansfield Relative Strength Indicator.
The calculations have been made based on the following formulas:
Standard Relative Performance indicator
RP = ( stock_close / index_close ) * 100
Mansfield Relative Performance indicator
MRP = (( RP (today) / sma ( RP (today), n)) - 1 ) * 100
Where:
RP = Standard Relative Performance indicator (see above)
SMA = Simple moving average over n days.
n = 52 for weekly charts, and n = 200 on daily charts
Thanks,
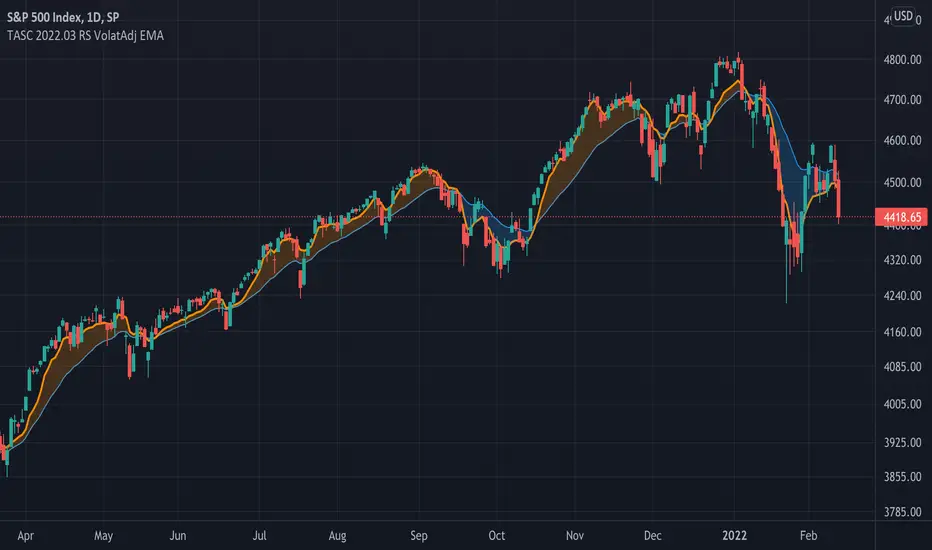
TASC 2022.03 Relative Strength Volatility-Adjusted EMA█ OVERVIEW
TASC's March 2022 edition of Traders' Tips includes the "Relative Strength Moving Averages - Part 3: The Relative Strength Volatility-Adjusted Exponential Moving Average" article authored by Vitali Apirine. This is the code that implements the "RS VolatAdj EMA" from the article.
█ CONCEPTS
In a three-part article series, Vitaly Apirine examines ways to filter price movements and define turning points by applying the Relative Strength concept to exponential moving averages . The resulting indicator is more responsive and is intended to account for the relative strength of volatility .
█ CALCULATIONS
The calculation process uses the following steps:
Select an appropriate volatility index (in our case it is VIX ).
Calculate up day volatility (UV) smoothed by a 10-day EMA.
Calculate down day volatility (DV) smoothed by a 10-day EMA.
Take the absolute value of the difference between UV and DV and divide by the sum of UV and DV. This is the Volatility Strength we need.
Calculate a MLTP constant - the weighting multiplier for an exponential moving average.
Combine Volatility Strength and MLTP to create an exponential moving average on current price data.
Join TradingView!
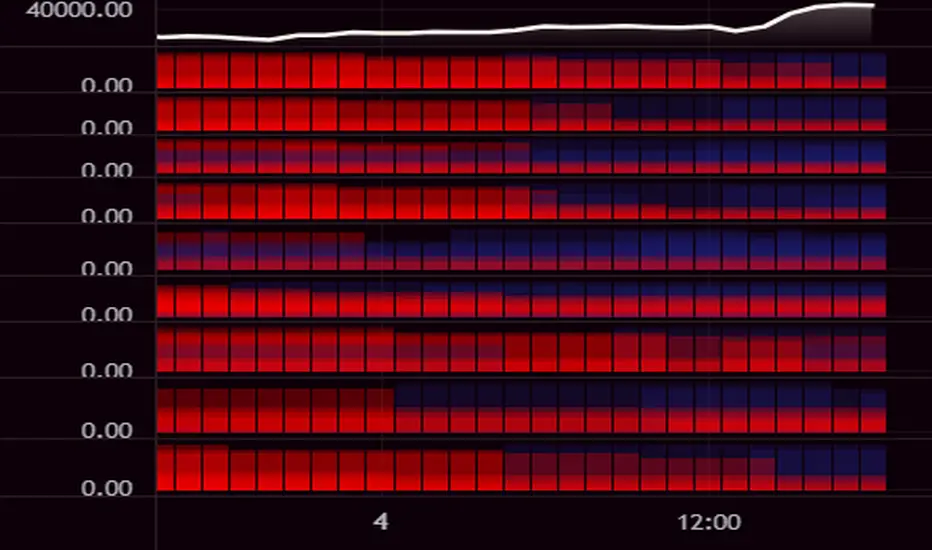
Williams Alligator Trend Filter HeatmapHello I've decided that the alligator lines can be used to find a trend. This script expands on that and checks 10 different multipliers to see trend over the long term and have 10 values. Those 10 values each give a color to one of the 10 lines in turn giving this Fire like plotting. I personaly use this to see if there is fear (red) in the markets or greed (blue), plotted 9 different crypto coins on the chart and have 4 columns in my setup to see the values on different timeframes. In the chart preview this is 1H,30M,10M,1M to see current environment. The colors use alot of data to generate especialy the bottom part, that colors based on a very long time zone.
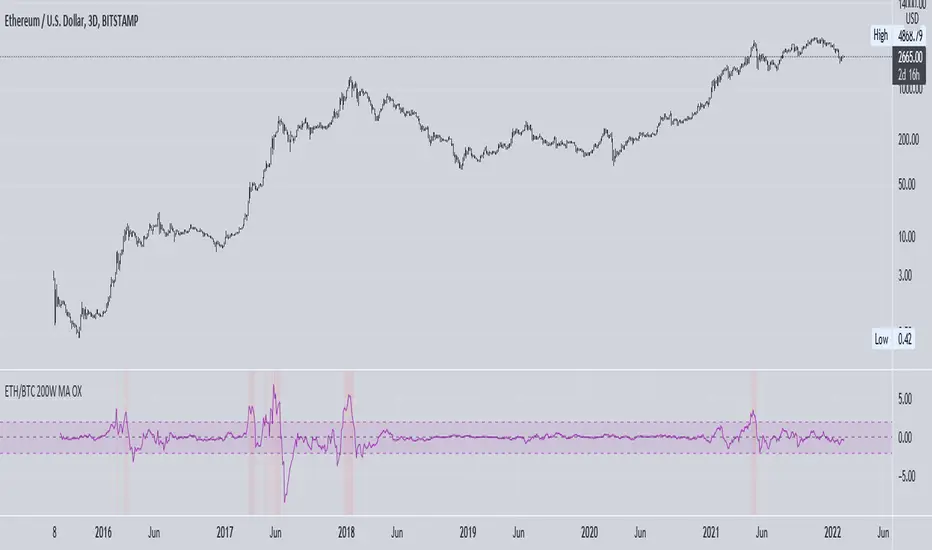
ETH vs BTC 200W SMA OverextensionHistorically, when BTC suffers a correction and ETH continues to rally, this hints at an impending market-wide correction. In Jan 2018, ETH rallies while BTC corrects, signalling the end of the bull cycle. In May 2021, ETH rallies while BTC ranges between $50-$60k, then a major correction occurs. This indicator attempts to monitor this phenomenon in order to help spot potential macro tops in the cryptocurrency market.
The indicator takes the price of the asset and divides it by the 200 week SMA value. This gives an over/undervaluation in percentage terms. When ETH becomes significantly more overvalued relative to BTC, the indicator will warn of a potential top forming (see red shaded areas).
This is for edutainment purposes only. Don't make financial decisions based on this indicator.
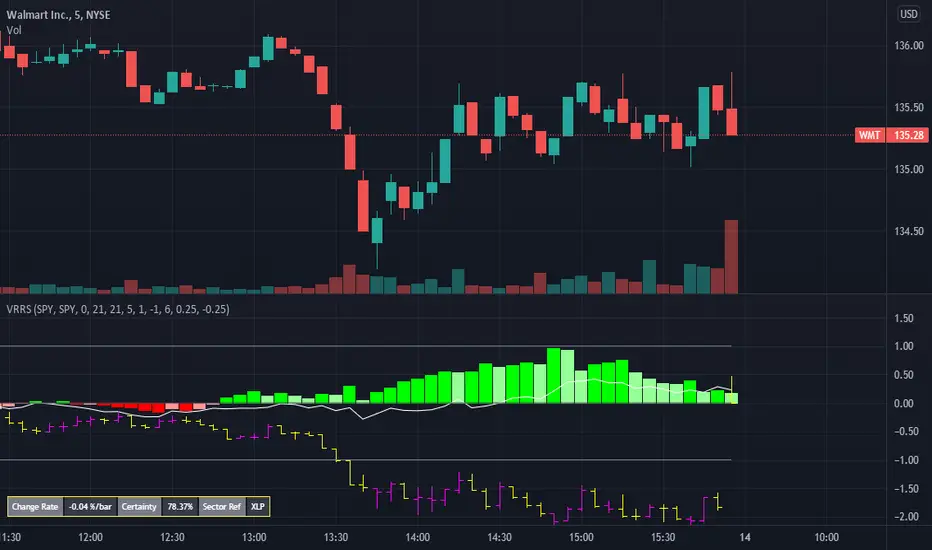
Volume Weighted Real Relative Strength (RS/RW)Volume Weighted Real Relative Strength (VRRS) measures the relative strength of a tickers vs. a benchmark ticker for the market, i.e. $SPY, and a benchmark ticker for the sector it is in. The calculation of VRRS is done as follow:
VRRS = * VolWeighted * 100
Where :
Close is Close price
smaClose is the last simple moving average value.
Ref is Reference ticker
VolWeighted is the volume weighted factor and is defined as (smaVol_short / smaVol_long); where smaVol_short, smaVol_long are the simple moving average of volume calculated for a short period (i.e. 21 period) and long period (i.e. 5 days), respectively.
Feature :
1. It can show two VRRS, one calculated against a market benchmark (i.e. $SPY) and one for a sector benchmark.
2. It shows also the bar plot of the benchmark ticker.
Linear Regression Relative Strength[image/x/iZvwDWEY/
Relative Strength indicator comparing the current symbol to SPY (or any other benchmark). It may help to pick the right assets to complement the portfolio build around core ETFs such as SPY.
The general idea is to show if the current symbol outperforms or underperforms the benchmark (SPY by default) when bought some certain time ago. Relative performance is displayed as percent and is calculated for three different time ranges - short (1 mo by default), mid (1 quarter), and long (half a year). To smooth the volatility, the script uses linear regression to estimate the trend and takes the start and the end points of the linear regression line to compute the relative strength.
It is important to remember that the script shows the gain relative to SPY (or other selected benchmark), not the asset's gain. Therefore, it may indicate that the asset is profitable, but it still may lose value if SPY is in downtrend.
Therefore, it is crucial to check other indicators before making a decision. In the example above, standard linear regression for one quarter is used to indicate the direction of the trend.

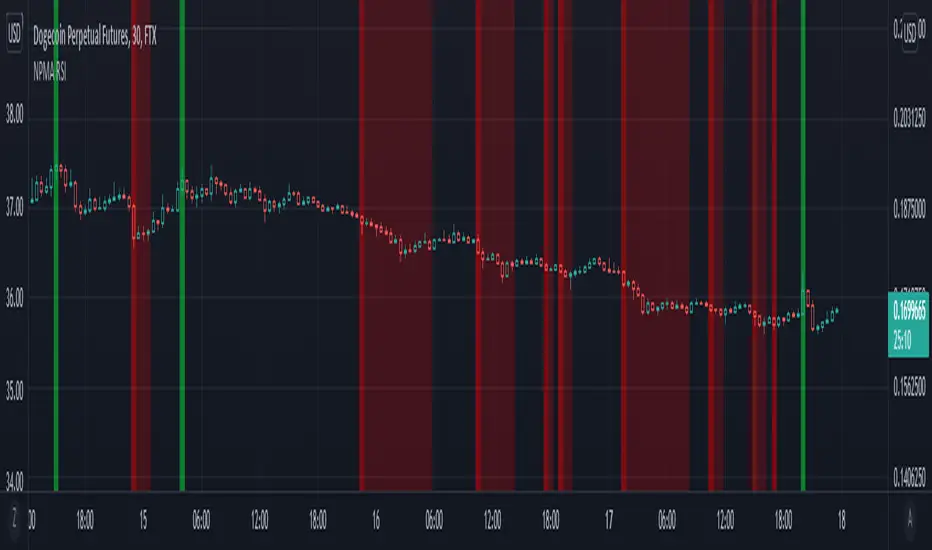
NPMA Relative Strength IndexRecently been amased by the potential of percentile nearest rank. You can apply this to almost any indicator to find extremes, this script might the simplest form of using it while being very powerful. The background will color green when the rsi is in the top percentage ranges of last X amount of bars. I'm currently searching optimal settings to apply this to a simple 3commas bot. Feel free to comment good settings and help the community out making profitable bots.
ETH ratioCompares the currently selected symbol to a configurable symbol (defaults to ETHUSD).
Normalizes the ratio to be >= 0.1 and <= 10 to be readable for symbols with radically different ranges.
Sectors ScreenerThis screener compares the corresponding market sectors in relation to the complete market.
If a sector rises or falls equal to the market, the value is on the dashed line.
If a sector rises faster or falls slower than the market, the sector's line is green and above the dashed line.
If a sector falls faster or rises slower than the market, the sector's line is red and below the dashed line.

Comparative Strength [FT]This indicator calculates the comparative strength between 2 variables by subtracting them instead of division/ratio.
Example:
A is stronger than B, then if A-B, it would be positive because value A is bigger than B.
A is weaker than B, then when A-B, this would be negative because A is lower than B.
What it does:
It takes the difference of averages of variable A (ie: stock), and the same for variable B (ie: index), and then the result of those is substracted to get a value.
Why is this indicator useful ?
To visualise comparative values between 2 related variables. IE: stock-index, stock-commodities, forex-interest rates, forex-bond, forex-inflation.
DISCLAIMER: Nothing in this content should be interpreted as financial advice or a recommendation to buy or sell any sort of security, investment, currencies or assets.

Dominion - Bitcoin Altcoin Dominance [mutantdog]A simple and easy reference tool displaying a plot of the market cap dominance values for several significant cryptocurrencies.
The most widely used of these is bitcoin dominance (the top indicator shown above) which calculates the total market cap of bitcoin in relation to the total cryptocurrency market cap, displayed as a percentage. This is commonly used by traders to assess the strength of bitcoin in relation to the broader crypto market; increasing values being indicative of larger bitcoin moves and decreasing values often indicative of potential altcoin cycles. Likewise, ethereum dominance (the bottom indicator shown above) is frequently used as a means to indicate the strength of ethereum in relation to the broader crypto market.
Included options for marketcap dominance values are:
Bitcoin : CRYPTOCAP:BTC.D
Ethereum : CRYPTOCAP:ETH.D
Total DeFi (a composite of multiple top defi tokens): CRYPTOCAP:TOTALDEFI.D
Stablecoins (shows the combined dominance values for usdt and usdc): CRYPTOCAP:USDT.D + CRYPTOCAP:USDC.D
Flippening (shows the difference between bitcoin and ethereum dominance values): CRYPTOCAP:BTC.D - CRYPTOCAP:ETH.D
When used in combination with each other, these can provide a good overview of the general flow of capital within the crypto market.
Additional functionality:
up to three optional moving averages with a choice of SMA, EMA, WMA and RMA for each.
multi timeframe selector
alert condition presets for various moving average crosses.
Please be aware that, while useful as reference, dominance calculations are known to repaint frequently. As such the use of this indicator and its alerts should require caution.

NVTNetwork Value to Transactions Ratio (NVT) is defined as the ratio of market capitalization divided by transacted volume.
NVT Ratio can be thought of as an indicator that measures whether the blockchain network is overvalued or not.
If it is upper than red line, it means overvalued.
NVT Golden Cross targets to generate short or long signals by comparing the short-term trend of NVT and the long-term trend of NVT. If the short-term trend is way greater than the long-term trend is, the network can be interpreted as overpriced and will soon revert to mean value, meaning short signal. Similarly, the opposite case may imply a long signal.
Over the red line is short signal and under the green line is long signal.
You can find divergence in this indicator.
There are two sources
cryptocap
glassnode

Adaptive Relative Strength (ARS by Premal Parekh)Dear All,
This is my first public script modified to adapt the concept of Mr. Premal Parekh on Adaptive Relative Strength - ARS)
The original Script is developed by modhelius.
I have proved the version as per my requirement and included concept of ARS.
This script will remove the manual calculation task which is required on daily basis to calculate number of sessions from ARS Date.
Hope this script will be helpful.
If yes, do hit like button and share with your friends.
Ashish Kesarkar
India

Relative Strength Improved (Premal Parekh ASR Version)This script is improved over the existing script developed by Mr. modhelius
I have added ASR Concept of Mr. Premal Parekh.
This script will remove manual calculation of Trading Days from ASR Date.

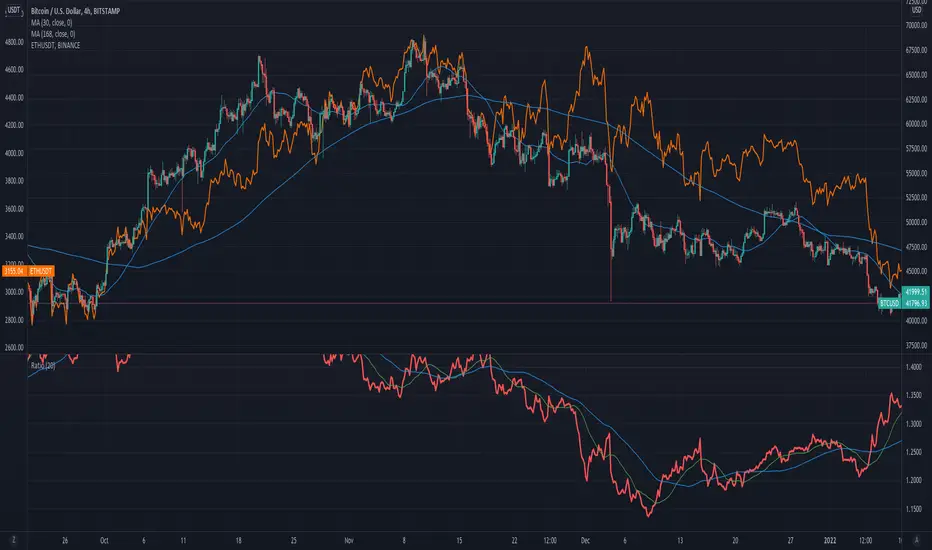
Ratio (Relative Strength) & EMAsRatio (Relative Strength) & EMAs
This indicator is used to compare the actual symbol with another one by calculating the ratio. EMA1 and EMA2 of the ration are shown as well. The idea is to choose an index like the NDX or SPX for comparison and to determine if the actual symbol outperforms the index or not - separate the wheat from the chaff. The rules are as follow:
When the calculation ratio (symbol divided ratio symbol) is above EMA1 and EMA1 is above EMA2) the background turs green. If not the background turn red.
Relative Strength (IBD Style)This script is meant to give you a Relative Strength indication of the stock. The goal is to use a similar calculation as used by IBD.
It calculates the performance of the current stock for the last year (most recent quarter is weighted double) and compares it to the performance of a reference index or ticker (default is "SPY").
IBD would give you a value between 0 and 100 because this value is the percentile within all stocks. This is not possible with Pine Script at the moment.
So here you get a Relative Strength value that is >0 if the stock is stronger than the index and <0 if it is weaker than the index.
You can still compare the Relative Strength values between stocks (bigger is better) but you won't know which percentile it is right off the bat.

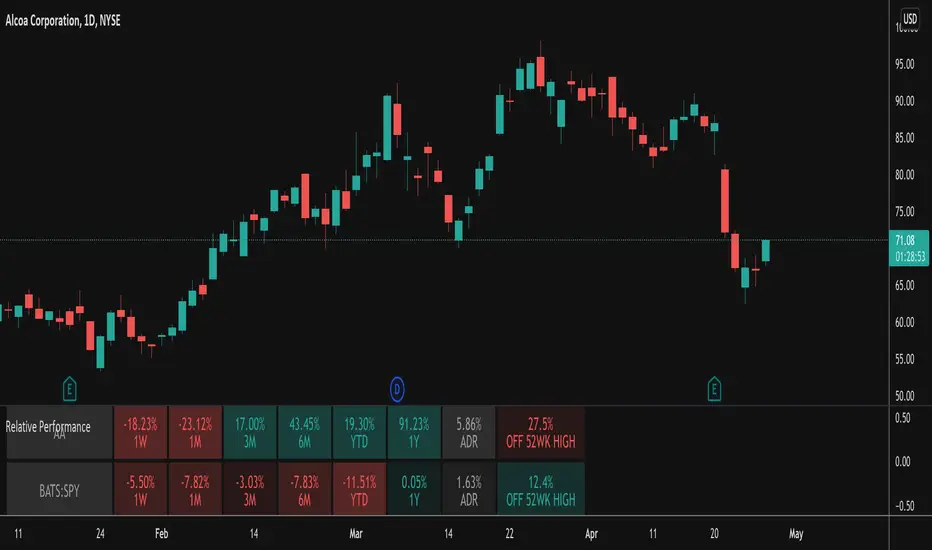
Relative PerformanceThis indicator takes the Performance Table from @BeeHolder and converts it to a Relative Performance table so you can compare the current chart vs. an Index (or whatever other ticker you want) to see the relative performance of one vs. the other. I also added a cell for ADR, which is also the same value as "Monthly Volatility" in the stock screener. This can be useful when screening stocks based on performance and volatility.
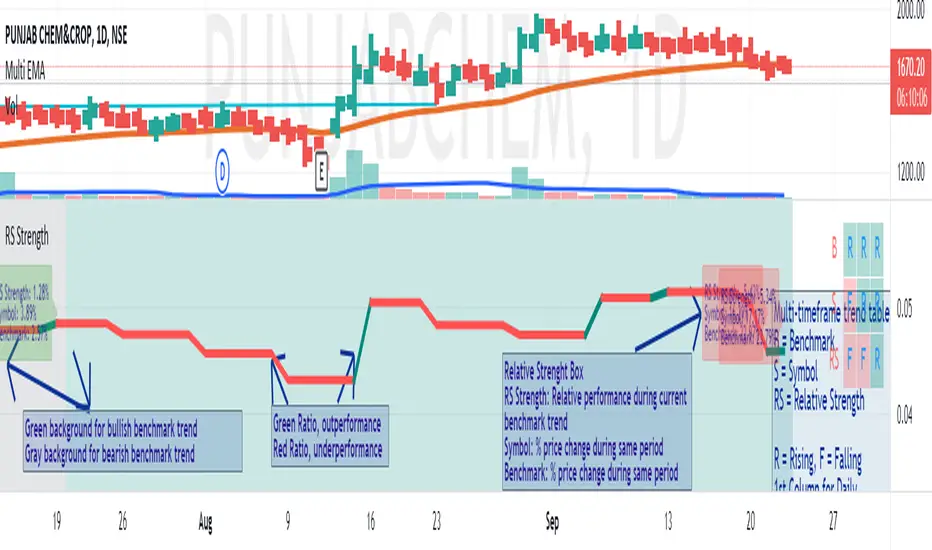
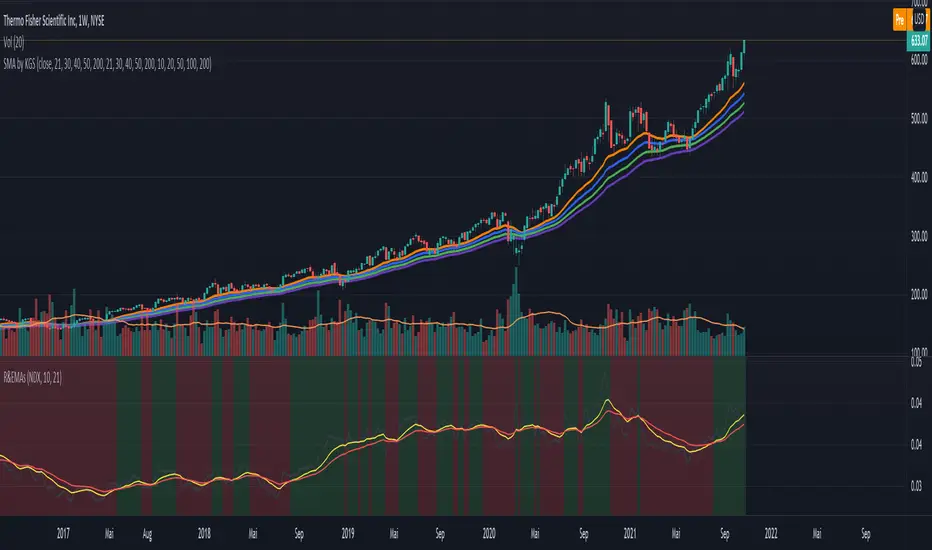
Measure of Relative Strength on Trend ReversalDescription
The Measure of Relative Strength on Trend Reversal displays the relative strength of the symbol vis-a-vis a benchmark based on the trend reversal of the benchmark. At the end of the trend (i.e. when the trend of the benchmark moves from Uptrend to Downtrend, or vice-versa) the strength (measure) of the symbol's performance with respect to the benchmark is calculated. Additionally, the change% of the symbol and the benchmark are calculated and displayed. This 3 information is helpful in determining the relative performance of the symbol with respect to the broader benchmark trend.
Example
For example, consider that the benchmark turned from a downtrend to an uptrend, then at the last bar of the downtrend, the "RS Strength%", the "Symbol%" and the "Benchmark%" shall be displayed. The RS Strength% shows the outperformance/underperformance of the symbol with respect to benchmark for the duration of the downtrend. A negative% means underperformance and a positive% means outperformance. The Symbol% is the % change in the price of the symbol during the downtrend and likewise, Benchmark% is the selected benchmark for the downtrend.
Working
These counters are reset at the beginning of each trend reversal of the benchmark. When the performance of a symbol is stronger on benchmark downtrend for successive times, it is an indication of a strong stock in the making once the larger market recovers.
The trend of the benchmark is established on the basis of a lookback period that is configurable at the input. The trend is established on the reversal of the key moving average by the lookback that is configured. A downtrend in the benchmark is denoted by a gray background and a uptrend in the benchmark is denoted in green.
The input is explained below:
Comparative Symbol - The benchmark. Nifty50 is the default value
Chart Type - Line or Candle plot of the Relative Strength with respect to Benchmark
Lookback for benchmark trend - Lookback to determine the trend of the benchmark
Display RS Strength% - Option to disable the RS strength value and focus only on the RS trend
Ways to use
Backtests show that this indicator is best used on a Weekly Timeframe, with 10 lookback for the benchmark. Any symbol that is constantly beating the benchmark on a downtrend is a strong candidate for outperforming once the market recovers.
On selecting a group index as the benchmark it is possible to identify the strong stocks in the group, those with the highest RS Strengths are the outperformers of the group.