PSAR + EMA/TEMA/RSI/OBVThe Parabolic Stop-and-Reservse (PSAR) is a trend indicator, intended to capture reversal signals and show entry and exit points. The PSAR is bullish when the PSAR is below the candle body (usually indicated by a dot) and bearish when the PSAR is above the candle body. The PSAR generally only moves in the direction of the trend, making it useful for markets with an upward or downward trend, as well as swing markets. It is weaker when the market it sideways, as it can be prone to frequent flips (bull-to-bear or vice versa) in markets where a predominant trend is not present.
In order to combat the tendency for rapid swings in the PSAR, it is commonly paired with a second indicator. Often, this is a moving average (MA) to confirm the PSAR signal. Here is a common example:
PSAR + 2 EMAs: A trade would consider entering long when the PSAR is bullish and the fast EMA is above the short EMA.
PSAR + 3 EMAs: As above, but the trader could also add a very long EMA (200, for example) and use that as an additional filter.
In addition to using EMA, other MAs can be used and may be more appropriate to certain instruments and timeframes. Using TEMA, for example, may result in less lag but introduce more noise. Likewise, the Ehler's MAMA is an option.
Some traders use other indicators as PSAR confirmation signals, such as the relative strength index (RSI) on on-balance volume (OBV). The strategy is similar:
bullish PSAR + RSI oversold = consider long entry
bullish PSAR + OBV oscillator > 0 = consider long entry
The strategy presented here is based on my PSAR + EMA + TEMA study. Any of the above strategies are supported by this script:
1. The PSAR is the primary signal.
2. Confirmation is provided by any of the following: EMA , TEMA , Ehler's MAMA , RSI , or OBV.
3. You may use a third EMA (set to 200 as the default) to filter entries -- if used, the strategy will only show signals if the price is above the third (additional) EMA .
For example, a normal long signal would be a bullish PSAR + fast EMA > slow EMA + price > ema 200.
In addition, you may use a SL, which is set to the PSAR dots shown. You may also limit the backtesting dates. (Please note in the chart above, I do not have a limit on the trading dates. I believe this exaggerates the success of the strategy, but the house rules demand I not limit the timeframe to show you a more accurate picture.)
Индекс относительной силы (RSI)

3Commas DCA Bot Strategy v1.0Introduction
The strategy attempts to implement a majority all of the settings found on the 3Commas DCA Bot setting page that can be implemented within a TradingView indicator. Specifically, it will implement the "Open new trade ASAP" and "Trading View Custom Signal" deal start conditions. In this way, you can leverage the power of TradingView's backtester to model your settings and analysis past performance as well as leverage TradingView's alert notification subsystem to send Deal Start and Close signals to 3Commas using almost any of the thousands of scripts found in the Public Library (see "What does it do and how does it do it?" section below for more information on how to do this using the RSI indicator as an example).
How is it original and useful?
This strategy is unique in that it's the only one (as of the initial publications) that can handle 28 out of 32 bot settings (88% coverage) that are found on the 3Commas bot settings page. In addition, because it is a TradingView script, you will benefit from the following:
Model your bot's configuration using the backtester on any timeframe and evaluate its performance using the chart's history.
View a table of detailed statistics pertaining to deals started and completed, win/loss rates, daily P&L, true max drawdown, and detailed statistics on bars in deal along with safety orders filled.
View a table of "Used amount for each step" as presented in 3Commas as well.
Ability to link to almost any TradingView chart indicator that provides a single data point for buy/sell signals.
Make use of the 3Commas TA Start Conditions indicator to emulate the 3Commas built-in indicators for further performance evaluation with the backtester.
How does it compare to other scripts in the Public Library?
This strategy offers a very detailed, comprehensive settings and maybe the only one (as of the initial publication) that can handle 28 out of the 32 bot settings that are found on the 3Commas bot settings page (that can be handled within TradingView, because some cannot be modeled due to chart and language constraints). Specifically, the following 3Commas bot settings and inputs are addressed with asterisks denoting specific limitation due to TradingView's platform architecture and/or constraints:
Main settings
✅ Name
❌ Exchange* (Not handled since it is inherited from chart)
⚠ Bot type* (Only Single-pair because you simply apply the indicator to as many pairs you desire in separate charts to simulate a Multi-pair setting)
Pairs
❌ Pairs* (Not handled since it is inheriting the symbol from the chart)
Strategy
✅ Strategy
❌ Profit currency* (Not handled since there is no equivalence in TradingView)
✅ Base order size / unit
✅ Safety order size / unit
✅ Start order type
Deal start condition
⚠ TradingView* (You can modify the "Technical Rating" indicator by TradingView to output a signal yourself like @TheTradingParrot has done in the TV signal for DCA backtest script)
⚠ QFL* (See Quickfingers Luc's Base Breaking Strategy v2.5 - 3Commas Edition for an alternative)
❌ Manually/API* (Not handled since there is no equivalence in TradingView)
✅ Trading View custom signal
✅ Open new trade asap
Take profit
✅ Take profit (%)
✅ Take profit type
✅ Trailing
⚠ Trailing deviation* (modified to handle TradingView's broker emulator properly)
Stop loss
✅ Stop Loss (%)
✅ Stop Loss action
⚠ Stop Loss timeout* (modified to use "bars" as the unit of measure)
Safety orders
✅ Max safety trades count (a total of 100 safety orders are supported!)
⚠ Max active safety trades count* (Not handled since there is no equivalence in TradingView)
✅ Price deviation to open safety orders (% from initial order)
✅ Safety order volume scale
✅ Safety order step scale
Advanced settings
✅ Don't start deal(s) if the daily volume is less than
✅ Minimum price to open deal
✅ Maximum price to open deal
⚠ Deal start delay (QFL and standard TV signals only)* (modified to use "bars" as the unit of measure)
✅ Cooldown between deals
✅ Open deals & stop
Close deal after timeout
⚠ The time after which, deal will be closed automatically* (modified to use "bars" as the unit of measure)
In addition to the above inputs, the script will also support the same output data points that are found on the bot settings page, which are:
Assistant
✅ Balance
✅ Max amount for bot usage (Based on current rate)
✅ Max safety order price deviation
✅ % of available balance to be used by the bot
Table (Used amount for each step)
✅ Order No.
✅ Deviation %
✅ Order Size (Base currency)
✅ Order Volume (Quote currency)
✅ Price
✅ Average price
✅ Required price
✅ Required change
✅ Total Size (Base currency)
✅ Total Volume (Quote currency)
What does it do and how does it do it?
When applied to the chart for the first time, the default settings will work to execute the "Open new trade asap" deal start condition using a take profit of 4%, a base order size of 1.335% of equity (initial capital + net profit), a safety order size of 2.003% of equity (initial capital + net profit), a safety order volume scale of 1.5, a safety order step scale of 1.21, and a max safety trades count of 8. With these settings, as you scroll through the chart's history you should see price action crossing the DCA layers (denoted with blue triangles), and a green take-profit price line will render (with green triangle denoting the crossings). Lastly, in the upper-right corner of the chart the table of DCA statistics will render showing you all the gathered data that took place since the chart's starting history until the current time.
Using the "TV Custom Signal" section will allow you to "link" other chart indicators to supply "Start" and "Close" signals for the script. For example, here's how you can use the standard RSI indicator to generate an entry signal:
1) Add the stock RSI indicator and configure it to your desire.
2) Select the "RSI" indicator in the "Chart/Indicator Data Point" input.
3) Select "Chart/Indicator Data Point" in the "Start Deal When" input.
4) Select "Less Than" in the "Is" input.
5) Select "Custom Value(s)" in the "The Value Of" input.
6) Enter "25" in the "Custom Value 1 (Single or Lower Bound)" input.
7) Select "Trading View Custom Signal" in the "Open new trade" input (in the DEAL START CONDITION section).
8) Lastly, check the checkbox with a horizontal straight line above the "Start Deal When" input.
This means that the indicator will start a deal when the "RSI indicator" is "Less Than" the value of "25".
Strategy Results
The default settings are designed to ensure that the indicator will render chart elements when first loaded as well as to allow the backtester to gather order executions and display performance summary. The chart above is is using $10,000 initial capital, a commission rate of 0.1% for both entries and exits, and a 1 tick slippage setting. It is also using 3.22581% of the equity for the Base Order Size, 6.45161% of equity for the first Safety Order Size. The Maximum Safety Trade Count is 4 with a Safety Order Volume Scale of 2, a Safety Order Step Scale of 1.53, Price Deviation To Option Safety Orders at 5.3, and a take profit of 4.5% with Trailing turned on at a deviation of 1.5%. All other settings are defaults.
It is recommended that the indicator be "tuned" for your specific market in order to best implement the strategy and obtain better desirable results. You do so by using the backtester and statistics table and observe the output values and learn how the indicator is performing in the chart history. Using this information, you can adjust the settings accordingly until you find the settings acceptable to your trading goals and risk tolerance.
Always keep in mind that past performance may not be indicative of future results. Settings that seem favorable for one market may be found to be disastrous in another. Therefore, do take the time needed to understand how the settings will behave with the given chart symbol.
Enjoy! 😊👍
How to obtain access to the script?
You have two choices:
Use the "Website" link below to obtain access to this indicator, or
Send us a private message (PM) in TradingView itself.

Go_up vwap-rsiIt is the popular RSI indicator with VWAP as a source instead of close.
VWAP (Volume Weighted Average Price) is one of the derived moving average indicators that takes volumes into account in price averaging. VWAP stands for Volume Weighted Average Price.
//LOGIC ENTRY:
Length RSI+VWAP
Oversold - bottom line RSI-VWAP
//EXIT SETTING:
Take profit and stop loss when a certain percentage is reached
//Settings next entry and grid:
Allow signal lower than,% - the next entry into a trade from logic occurs only when a decrease by a certain percentage
Allow grid,% - when the price drops by the percentage specified in the settings, the entry will take place, but only on the next bar.
//DATA RANGE:
-Testing results for any period of time
//PS:
For this strategy, we use pyramiding, we adjust the number of inputs in the "properties" section, by default left 20.
Look at the results in the past and adjust the settings for your capabilities and pitfalls. The default costs 25 entries for $ 400
Change the settings - find better results. share in the comments

EMR Strategy [H1 Backtesting]EMR Strategy base on EMA, MACD and RSI to supply signal on time frame H1.
Details of Rule as below:
===
1.EMA
+ Time frame: H1
+ Periods: 25, 100 (~ EMA 25 H4), 600 (~ EMA 25 D1)
===
2.MACD
+ Time frame: H1
+ Periods: 12,26,9
===
3.RSI
+ Time frame: H1
+ Periods: 14
===
4.Trading Rule
4.1.Long Position
+ MACD>0 and RSI>50 and close price moving above EMA 25
+ Close price crossed EMA 100 or crossed EMA 600 at the first time
4.2.Short Position
+ MACD<0 and RSI<50 and close price moving below EMA 25
+ Close price crossed EMA 100 or crossed EMA 600 at the first time
===
5.Money Management
+ This strategy concentrate into winrate.
+ So use trailing stop to protect your profits.
+ And use stoploss to avoid big loss on trades.

MACD + BB + RSI Strategy [Alorse]A very simple and highly effective strategy that combines 3 famous indicators:
MACD
Bollinger Bands
RSI
Entry conditions are:
The MACD line crosses over the signal line.
RSI less than 50
Price below the BB baseline
Exit conditions are:
RSI greater than 70
Closing price higher than the upper BB
Or when the price hits the Stop Loss defined by you (Feature).

RSI Rising Crypto Trending StrategyThis is crypto and stock market trending strategy designed for long timeframes such as 4h+
From my tests it looks like it works better to trade crypto against crypto than trading against fiat.
Indicators used:
RSI for rising/falling of the trend
BB sidemarket
ROC sidemarket
Rules for entry
For long: RSI values are rising, and bb and roc tells us we are not in a sidemarket
For long: RSI values are falling, and bb and roc tells us we are not in a sidemarket
Rules for exit
We exit when we receive an opposite direction.
Cuation: Because this strategy uses no risk management, I recommend you takje care with it.
If you have any questions, let me know !

RSI Centered PivotsJust a simple RSI central pivot strategy I made for a friend.
Backtested on BYBIT:BTCUSD, 155m.
DISCLAIMER : Please do your own research into anything you use before using it to trade.

RSI Strategy with alerts via TradingConnector to ForexSoftware part of algotrading is simpler than you think. TradingView is a great place to do this actually. To present it, I'm publishing each of the default strategies you can find in Pinescript editor's "built-in" list with slight modification - I'm only adding 2 lines of code, which will trigger alerts, ready to be forwarded to your broker via TradingConnector and instantly executed there. Alerts added in this script: 12 and 17.
How it works:
1. TradingView alert fires.
2. TradingConnector catches it and forwards to MetaTrader4/5 you got from your broker.
3. Trade gets executed inside MetaTrader within 1 second of fired alert.
When configuring alert, make sure to select "alert() function calls only" in CreateAlert popup. One alert per ticker is required.
Adding stop-loss, take-profit, trailing-stop, break-even or executing pending orders is also possible. These topics have been covered in other example posts.
This routing works for Forex, indices, stocks, crypto - anything your broker offers via their MetaTrader4 or 5.
Disclaimer: This concept is presented for educational purposes only. Profitable results of trading this strategy are not guaranteed even if the backtest suggests so. By no means this post can be considered a trading advice. You trade at your own risk.
If you are thinking to execute this particular strategy, make sure to find the instrument, settings and timeframe which you like most. You can do this by your own research only.

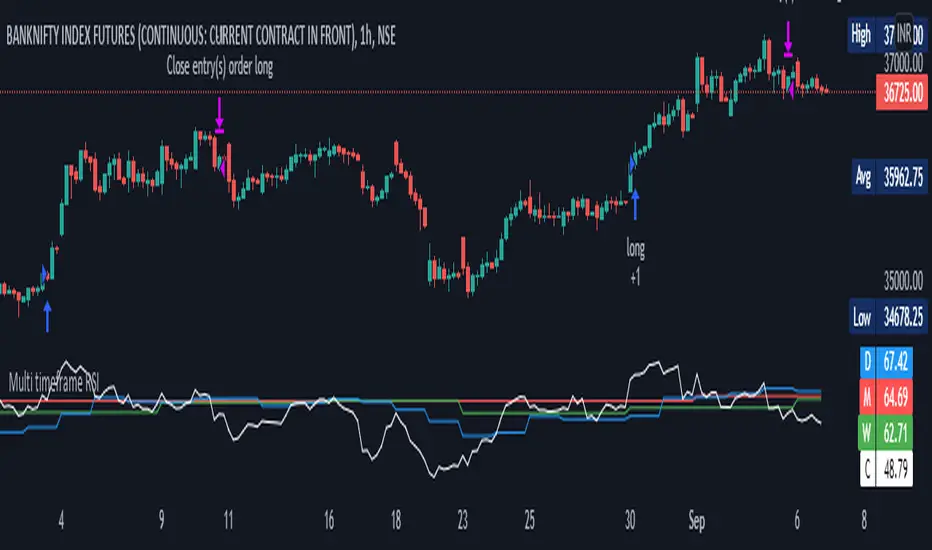
Multi timeframe RSI StrategyMulti Time Frame RSI is based on Concept of capturing Higher Time frame Momentum. Generally Higher TF Trends are more reliable and long
This strategy get the Monthly Weekly Daily and Current Time frame RSI and then trade on lower time frame taking as base of Higher TF
For Monthly, Weekly and Daily TF => RSI is set to = 40
for Lower TF => Upper RSI is = 65 Lower RSI is = 45
Trading Logic
Long = Current RSI > ( upper RSI and Monthly, Weekly and Daily TF RSI )
Short = Current RSI < ( Lower RSI and Monthly, Weekly and Daily TF RSI )
Brokerages Set to = 0.03%
Risk Mgmt=> Per trade risk = 5000 Rs
Alert=> alert are coded once you schedule TV alert, following singnal will get generated at current TF Candle close
Long = LE,
Close Long = LX
Short = SE,
Close Short= SX
For Bank Nifty = 1 hrs TF is preffered and Nifty = 15 Min TF
Ultimate Triple Supertrend Strategy [PrismBot] [Lite]Initial Release on Prism Core 1.7.r493
Included in this Ultimate Supertrend Lite Strategy:
✔️ Tweak a multitude of specific settings (MA lengths, R:R, SL distance etc)
✔️ Enable advanced setup filters
✔️ Use money management and risk calculations
✔️ Draw trade info directly to chart (eg. SL size in percent, win rate etc)
✔️ Use various filters (eg. time filter, date filter, MA slope angle etc)
✔️ Manage risk per position when auto-trading forex through AutoView
✔️ Choose from various alert conditions!
✔️ Sync to any bot or algorithmic trading system
Some details about this strategy:
This strategy is a triple Supertrend strategy that includes multi-timeframe analysis built-in to the supertrend function. You also have a multitude of strategies to choose from, such as the newest addition to Prism Core - Stochastic. Our stochastic strategies includes Standard / Strict Standard which buys when overbought and sells when oversold, and a couple of %K cross strategies as well.
There are also many other filters such as RSI, ADX, and more, as well as built-in DCA (dollar cost averaging), position sizing, take profit and stoplosses, and so much more.

Forex Scalping 1min Bollinger Bands, RSI and ADX Trading SystemThis is a Forex Scalping Trading Sytem based on the Bollinger Bands.
Its suited for major pairs, with lowest possible comission (below 1 pip) and with timeframes ranging between 1-15 min.
Indicators:
Bollinger bands
ADX
RSI
Rules for entry:
Long Entry: price to move below the upper Bollinger Bands RSI raise above the 30 line and ADX<32 at the same time.
Short Entry: price to move above the upper Bollinger Bands, RSI raise below the 70 line and ADX<32 at the same time.
Rules for exit
Profit Exit: 3 options: 1, exit position when the price touches the middle band, 2) when the price touches the opposite band, X pips target profit.
Loss Exit: X pips loss

MACD-Extendido-Estrategia por Neil--------------------------------
MACD-Extendida-Estrategia
--------------------------------
DESCRIPTION
Resource that identifies entry and exit operations using the indicator
Average Convergence and Divergence Movements ( MACD ) and 5 strategies
INTERESTING
Novel strategies are implemented such as:
1. Overbought and oversold band to avoid horizontal movements
2. Control inputs and outputs at positions opposite the histogram line
3. Make a profit (take profit) without prior purchase orders
HOW DOES IT WORK (STRATEGIES)
1) Overbought and oversold:
Allows you to define an overbought upper band
Allows you to define an oversold ower band
Operations that occur within the band are ignored
2) Place of next operation (either side):
Indicates that the next operation can occur on either side of the histogram
3) Place of next operation (opposite side):
Indicates that the next operation must occur on the opposite side of the histogram
4) Take profit:
It allows defining the deviation in favor to execute a take profit.
It does not place a buy order at a distant point, instead it looks back and if the shift meets the expected deviation, take profit is executed
5) Loss control (stop loss):
It allows to define the deviation against to execute a stop loss.
It does not place a stop order at a distant point, instead it looks back and if the displacement meets the expected deviation the stop loss is executed
How to use it:
Press the "Indicators" option, go to the "Public Librarian" segment, write the name "MACD-Extended-Strategy by Neil", double-click on the record in question and you will have it added in your work panel, now, just It remains to be used to identify the inputs and outputs and you can do it visually or by defining the automatic notification alerts.
--------------------------------
MACD-Extendida-Estrategia
--------------------------------
DESCRIPCION
Recurso que identifica operaciones de entradas y salida haciendo uso del indicador
Media móvil de Convergencia/Divergencia ( MACD ) y 5 estrategias
NOVEDADES
Se implementan estrategias novedosas como:
1. Banda de sobrecompra y sobreventa para esquivar movimientos horizontales
2. Control de entradas y salidas en posiciones contrarias a la línea del histograma
3. Toma de ganancias (take profit) sin ordenes de compra previa
COMO FUNCIONA (ESTRATEGIAS)
1) Sobrecompra y Sobreventa:
Permite definir una banda superior de sobrecompra
Permite definir una banda inferior de sobreventa
Operaciones que ocurren dentro de la banda son ignoradas
2) Lugar de próxima operación (cualquier lado):
Indica que la próxima operación puede ocurrir en cualquier lado del histograma
3) Lugar de próxima operación (lado opuesto):
Indica que la próxima operación debe ocurrir en el lado opuesto del histograma
4) Toma de ganancias (take profit):
Permite definir la desviación a favor para ejecutar una toma de ganancia.
No coloca una orden de compra en un punto distante, en su lugar mira hacia atrás y si el desplazamiento cumple con la desviación esperada se ejecuta la toma de ganancia
5) Control de pérdida (stop loss):
Permite definir la desviación en contra para ejecutar una parada de pérdida.
No coloca una orden de parada en un punto distante, en su lugar mira hacia atrás y si el desplazamiento cumple con la desviación esperada se ejecuta la parada de la pérdida
Como usarlo:
Presione la opción "Indicadores", ubíquese en el segmento "Libreria Publica", escriba el nombre "MACD-Extendido-Estrategia por Neil", haga doble clic sobre el registro en cuestión y lo tendrá agregado en su panel de trabajo, ahora, solo resta usarlo para identificar las entradas y salidas y puede hacerlo de forma visual o definiendo las alertas de notificación automática.

Strategy TemplateThis is the fastest way to create a Trading View strategy. The template I have created includes stoploss and take profit enabling and plotting, date range, and strategy buy and sell conditions. I believe this will benefit the people in the Trading View community by creating a strategy faster and more efficiently than just repeating pine script code. All that needs to be done by the person using this script is to add their own indicators, and create their own buy and sell signals. Then they can immediately start back testing their new strategy!
Crypto swing correlation RSI and SMAThis is a crypto swing strategy, designed for long term periods and correlated pairs with crypto market total(or other coins used as correlation, however I recommend total of crypto or btc)
Its components are:
RSI with a very length
Correlation candles
SMA 9
Rules for entry:
For long : RSI is above 51 level and going higher and close of the candle is above the SMA
For short :RSI is below 49 and going lower and close of the candle is below the SMA
Rules for exit:
We exit when we encountered an opposite condition than the entry one, or based on take profit/stop loss levels.
If you have any questions let me know !

Zendog V2 backtest DCA bot 3commasHi everyone,
After a few iterations and additional implemented features this version of the Backtester is now open source.
The Strategy is a Backtester for 3commas DCA bots. The main usage scenario is to plugin your external indicator, and backtest it using different DCA settings.
Before using this script please make sure you read these explanations and make sure you understand how it works.
Features:
- Because of Tradingview limitations on how orders are grouped into Trades, this Strategy statistics are calculated by the script, so please ignore the Strategy Tester statistics completely
Statistics Table explained:
- Status: either all deals are closed or there is a deal still running, in which case additional info
is provided below, as when the deal started, current PnL, current SO
- Finished deals: Total number of closed deals both Winning and Losing.
A deal is comprised as the Base Order (BO) + all Safety Orders (SO) related to that deal, so this number
will be different than the Strategy Tester List of Trades
- Winning Deals: Deal ended in profit
- Losing deals: Deals ended with loss due to Stop Loss. In the future I might add a Deal Stop condition to
the script, so that will count towards this number as well.
- Total days ( Max / Avg days in Deal ):
Total Days in the Backtest given by either Tradingview limitation on the number of candles or by the
config of the script regarding "Limit Date Range".
Max Days spent in a deal + which period this happened.
Avg days spent in a deal.
- Required capital: This is the total capital required to run the Backtester and it is automatically calculated by
the script taking into consideration BO size, SO size, SO volume scale. This should be the same as 3commas.
This number overwrites strategy.initial_capital and is used to calculate Profit and other stats, so you don't need
to update strategy.initial_capital every time you change BO/SO settings
- Profit after commission
- Buy and Hold return: The PnL that could have been obtained by buying at the close of the first candle of the
backtester and selling at the last.
- Covered deviation: The % of price move from initial BO order covered by SO settings
- Max Deviation: Biggest market % price move vs BO price, in the other direction (for long
is down, for short it is up)
- Max Drawdown: Biggest market % price move vs Avg price of the whole Trade (BO + any SO), in the other
direction (for long price goes down, for short it goes up)
This is calculated for the whole Trade so it is different than List of Trades
- Max / Avg bars in deal
- Total volume / Commission calculated by the strategy. For correct commission please set Commission in the
Inputs Tab and you may ignore Properties Tab
- Close stats for deals: This is a list of how many Trades were closed at each step, including Stop Loss (if
configured), together with covered deviation for that step, the number of deals, and the percentage of this
number from all the deals
TODO: Might add deal avg value for each step
- Settings Table that can be enabled / disabled just to have an overview of your configs on the chart, this is a
drawn on bottom left
- Steps Table similar to 3commas, this is also drawn on bottom left, so please disable Settings table if you want
to see this one
TODO: Might add extra stats here
- Deal start condition: built in RSI-7 or plugin any external indicator and compare with any value the indicator plots
(main purpose of this strategy is to connect your own studies, so using external indicator is recommended)
- Base order and safety orders configs similar to 3commas (order size, percent deviation, safety orders,
percent scale and volume scale)
- Long and Short
- Stop Loss
- Support for Take profit from base order or from Total volume of the deal
- Configs help (besides self explanatory):
- Chart theme: Adjust according to the theme you run on. There is no way to detect theme at the moment.
This adjust different colors
- Deal Start Type: Either a builtin RSI7 or "External indicator"
- Indicator Source an value: If using External Indicator then select source, comparison and value.
For example you could start a deal when Volume is greater than xxxx, or code a custom indicator that plots
different values based on your conditions and test those values
- Visuals / Decimals for display: Adjust according to your symbol
- BO Entry Price for steps table: This is the BO start deal price used to calculate the steps in the table

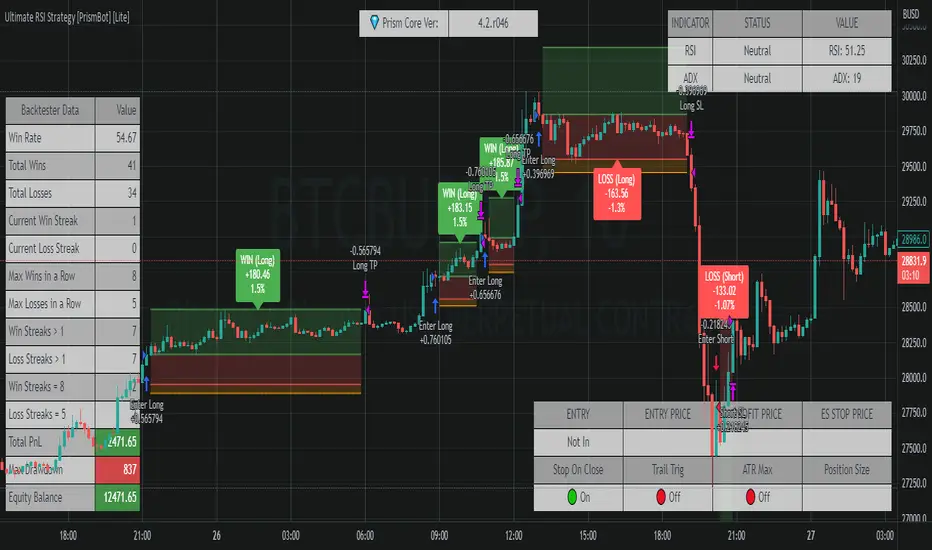
Ultimate RSI Strategy [PrismBot] [Lite]Included in this Ultimate MACD Lite Strategy:
✔️ Tweak a multitude of specific settings (MA lengths, R:R, SL distance etc)
✔️ Enable advanced setup filters
✔️ Use money management and risk calculations
✔️ Draw trade info directly to chart (eg. SL size in percent, win rate etc)
✔️ Use various filters (eg. time filter, date filter, MA slope angle etc)
✔️ Manage risk per position when auto-trading forex through AutoView
✔️ Choose from various alert conditions!
✔️ Sync to any bot or algorithmic trading system
Some details about this strategy:
There are several strategies that people use for the RSI , and one of my favorites is very different than one you have probably heard from every online RSI strategy source.
In order to compliment the RSI , there is also a built-in ADX / DMI strategy (per our All-In-One strategy on my profile as well) and you will also find a Global Trend filter (200 EMA by default).
You can also use a pullback confirmation prior to a trade entering. I.E., you have the RSI signal, wait for a pullback to the pullback EMA , and then the strategy will enter a trade.
You can easily enable and disable strategies using the checkbox.
This strategy incorporates a risk to reward system where the user can select between ATR and Percent based stop losses and take profit targets. This means that the user has much better control over money management when utilizing this strategy and it doesn't require you to babysit the strategy to ensure it's entering and existing strategies in an ideal place.
Keltner Worm Strategy [PrismBot] [Lite]Included in this Keltner Worm Lite Strategy:
✔️ Tweak a multitude of specific settings (MA lengths, R:R, SL distance etc)
✔️ Enable advanced setup filters
✔️ Use money management and risk calculations
✔️ Draw trade info directly to chart (eg. SL size in percent, win rate etc)
✔️ Use various filters (eg. time filter, date filter, MA slope angle etc)
✔️ Manage risk per position when auto-trading forex through AutoView
✔️ Choose from various alert conditions!
✔️ Sync to any bot or algorithmic trading system
Some details about this strategy:
- it incorporates 2 strategies - Keltner Re-entry and Baseline MA Crossing
- it uses a take profit and stop loss level fixed
- there are up to 6 allowable "worms"
- the worm multipliers are exponential, so a value of 2 will mean that the 6th worm is multiplied by 6
- you can multiply the offset or the Keltner Channel default values
- You can enable alerts for order entry, take profit, and stop loss values
- You can easily enable and disable strategies using the checkbox.
- This strategy incorporates a risk to reward system where the user can select between ATR and Percent based stop losses and take profit targets. This means that the user has much better control over money management when utilizing this strategy and it doesn't require you to babysit the strategy to ensure it's entering and existing strategies in an ideal place.

[VJ]Phoenix Force of PSAR +MACD +RSIThis is a simple intraday strategy for working on Stocks or commodities based out on PSAR, MACD , RSI and chop index . You can modify the start time and end time based on your timezones. Session value should be from market start to the time you want to square-off
Important: The end time should be at least 2 minutes before the intraday square-off time set by your broker
Comment below if you get good returns
Strategy: Entry Exits using PSAR and momentum and trend using MACD and RSI. A chop index is used as filtering
Indicators used :
Parabolic SAR is a technical indicator that is used to determine the price direction of stocks and it also draws attention to the traders when the price is changing
PSAR helps you:
Identify when a certain price trend is going to change direction
Indicate the most effective level at which to enter into the trade
Indicate the most effective exit point for the trade
Moving average convergence divergence (MACD) is a trend-following momentum indicator that shows the relationship between two moving averages of a security's price. ... Traders may buy the security when the MACD crosses above its signal line and sell—or short—the security when the MACD crosses below the signal line
RSI is intended to chart the current and historical strength or weakness of a stock or market based on the closing prices of a recent trading period.
Buying/Selling
When trading with the parabolic SAR, you would buy a market when the dots move below the current asset price and are green in colour. Alternatively, you would sell a market when the dots move above the current asset price and are red in colour. We use MACD , RSI to ensure that a right trade is picked when PSAR gives an indication. CI is used to stay away from the range bound market as much as possible.
Usage & Best setting :
Choose a good volatile stock and a time frame - 5m.
MA length : 200
RSI threshold : 50
MACD: 12,26,9
There is stop loss and take profit that can be used to optimise your trade
The template also includes daily square off based on your time.

QuickSilver Intraday using RSIThis is a simple intraday strategy using very basic intraday super indicators - RSI & VWAP for working on Stocks . You can modify the values on the stock and see what are your best picks. Comment below if you found something with good returns
Strategy:
Indicators used :
The Relative Strength Index (RSI) is one of the most popular and widely used momentum oscillators.The values of the RSI oscillator, typically measured over a 14-day period, fluctuate between zero and 100. The Relative Strength Index indicates oversold market conditions when below 30 and overbought market conditions when above 70
VWAP identifies the true average price of a stock by factoring the volume of transactions at a specific price point and not based on the closing price. VWAP can add more value than your standard 10, 50, or 200 moving average indicators because VWAP reacts to price movements based on the volume during a given period.
Buying happens at VWAP Breakouts which is then validated with RSI to check for overbought & oversold conditions.
Aggressive trade stop can be employed by using the % for long and shorts in the strategy.
Usage & Best setting :
Choose a good volatile stock and a time frame - 10m.
RSI : 9
Overbought & Oversold - can be varied as per user
There is stop loss and take profit that can be used to optimise your trade
Extending this to,
In general guidelines for RSI :
Short-term intraday traders (day trading) often use lower settings with periods in the range of 9-11.
Medium-term swing traders frequently use the default period setting of 14.
Longer-term position traders often set it at a higher period, in the range of 20-30.
The template also includes daily square off based on your time.

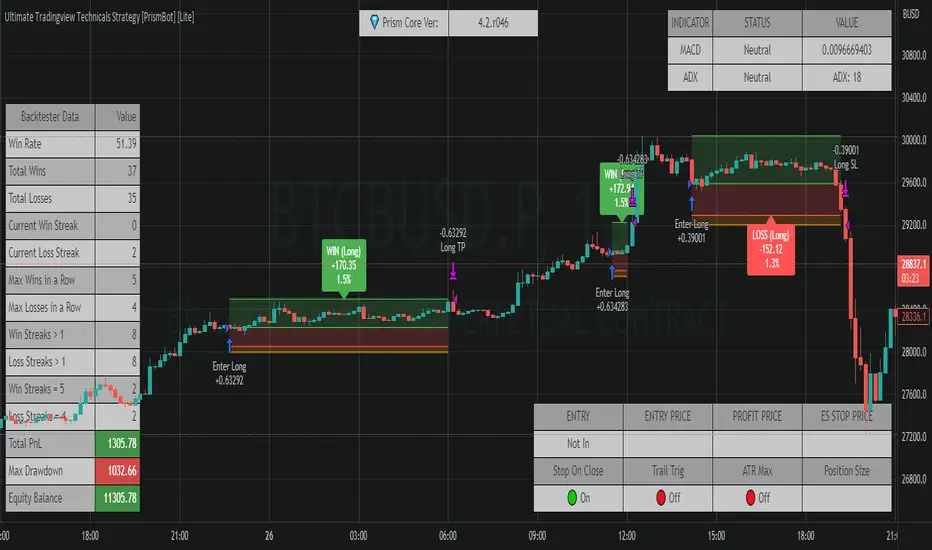
Ultimate Tradingview Technicals Strategy [PrismBot] [Lite]Included in this builder:
MACD
RSI
Tradingview Technical Analysis
Ichimoku
Global Trend Filter
Pullback Filter
Our most robust strategy to date with MACD , RSI , and many other basic strategies included as well as additional filters and alert options.
It is an advanced trading strategy built with the intent to make it easy for anyone to begin trading, but also avoid too much complication of strategy concepts.
For instance, you can change the MACD settings to be "more sensitive" by using a simple dropdown menu, and adjust which strategy you are employing with the MACD on the fly with another.
You can easily enable and disable strategies using the checkbox.
The strategy demo results use 100% equity per trade as an example - the reason for this is that the stop loss is set to 1%, so each trade is risking 1% (give or take slippage). Slippage is set to 5 ticks, and a 0.04% commission (Binance average for market and limit orders)
This strategy incorporates a risk to reward system where the user can select between ATR and Percent based stop losses and take profit targets. This means that the user has much better control over money management when utilizing this strategy and it doesn't require you to babysit the strategy to ensure it's entering and existing strategies in an ideal place.
The status box shows the current state of the various strategies and their values. A red circle indicates the filter / strategy is not valid for entry yet. A green circle indicates that filter / strategy is valid for entry. When all selected strategies are valid simultaneously, the next bar will trigger an entry signal.
If you have any questions about this strategy, please leave them in the comments below, or DM for more details. Thanks!
Additional features in this lite strategy:
✔️ Tweak a multitude of specific settings (MA lengths, R:R, SL distance etc)
✔️ Use money management and risk calculations
✔️ Draw trade info directly to chart (eg. SL size in percent, win rate etc)
✔️ Use various filters (eg. time filter, date filter etc)
✔️ Manage risk per position
✔️ Sync to any bot or algorithmic trading system
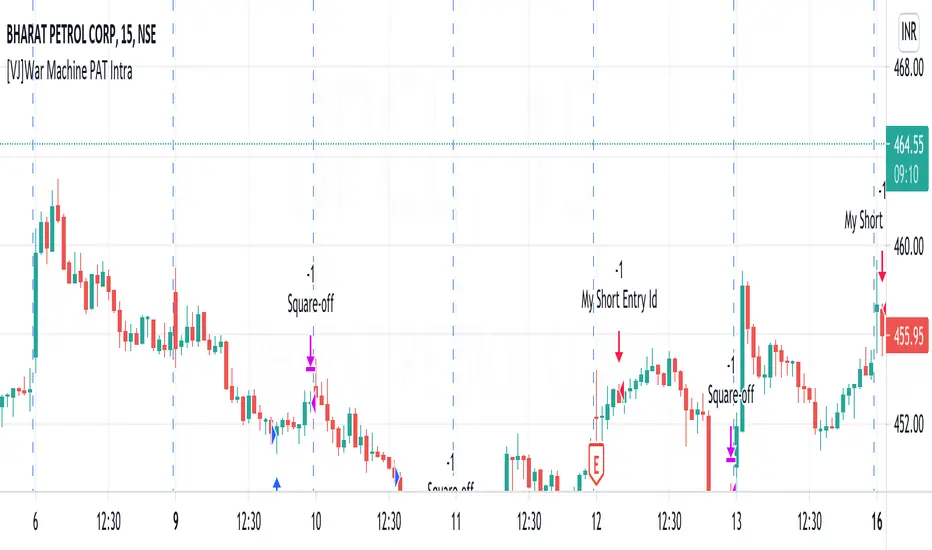
[VJ]War Machine PAT IntraThis is a simple intraday strategy for working on Stocks . You can modify the values on the stock and see what are your best picks. Comment below if you found something with good returns
Strategy:
Indicators used :
The Choppiness Index is designed to determine whether the market is choppy or trading sideways, or not choppy and trading within a trend in either direction. Using a scale from 1 - 100, the market is considered to be choppy as values near 100 (over 61.80) and trending when values are lower than 38.20)
The Money Flow Index (MFI) is a momentum indicator that measures the flow of money into and out of a security over a specified period of time. It is related to the Relative Strength Index (RSI) but incorporates volume, whereas the RSI only considers price. The MFI is calculated by accumulating positive and negative Money Flow values (see Money Flow), then creating a Money Ratio. The Money Ratio is then normalized into the MFI oscillator form.
Using the combination of CI (trend factor as constant) and varying MFI, we can buy/sell when conditions are met
Buying with MFI
1. MFI drops below 20 and enters inside oversold zone.
2. MFI bounces back above 20.
3. MFI pulls back but remains above 20.
4. A MFI break out above its previous high is a good buy signal.
Selling with MFI
1. MFI rises above 80 and enters inside overbought zone.
2. MFI drops back below 80.
3. MFI rises slightly but remains below 80.
4. MFI drops lower than its previous low is a signal to short sell or profit booking
Usage & Best setting :
Choose a good volatile stock and a time frame - 5m.
Trending factor : 50
Overbought & Oversold - can be varied as per user
There is stop loss and take profit that can be used to optimise your trade
The template also includes daily square off based on your time.
Combo Backtest 123 Reversal & RSIThis is combo strategies for get a cumulative signal.
First strategy
This System was created from the Book "How I Tripled My Money In The
Futures Market" by Ulf Jensen, Page 183. This is reverse type of strategies.
The strategy buys at market, if close price is higher than the previous close
during 2 days and the meaning of 9-days Stochastic Slow Oscillator is lower than 50.
The strategy sells at market, if close price is lower than the previous close price
during 2 days and the meaning of 9-days Stochastic Fast Oscillator is higher than 50.
Second strategy
The RSI is a very popular indicator that follows price activity.
It calculates an average of the positive net changes, and an average
of the negative net changes in the most recent bars, and it determines
the ratio between these averages. The result is expressed as a number
between 0 and 100. Commonly it is said that if the RSI has a low value,
for example 30 or under, the symbol is oversold. And if the RSI has a
high value, 70 for example, the symbol is overbought.
WARNING:
- For purpose educate only
- This script to change bars colors.

RSI Divergence + EMA @DaviddTechVery simple strategy that will look for Divergence on the RSI.
My Strategy for this was mixed with the 55 EMA which you can activate in the settings.
WARNING:
- For purpose educate only - My mission is to debunk fake strategies with code to find THE ONE.
- Plots EMAs and other values on chart.
- This script to change bars colors.
