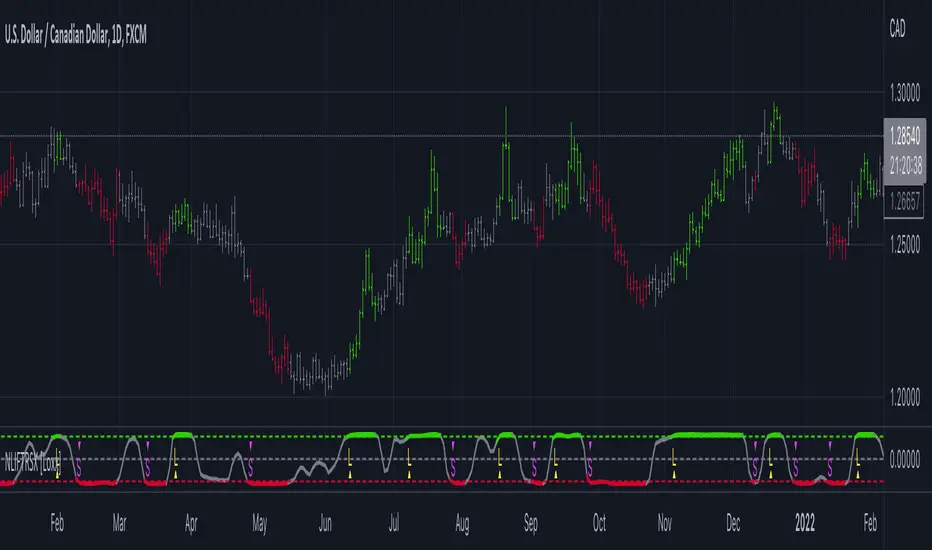
Crypto Force IndexIntroduction
The Crypto Force Index (CFI) indicator helps us understand the current strength and weakness of the price. It is very useful when used on high timeframes for investment purposes and not for short term trading.
To determine the strength and weakness of the price, a level grid based on the RSI indicator is used.
Based on the RSI value, red circles (oversold condition) and green circles (overbought condition) appear under the price candles. The more intense the color of the circles, the more that the current price is in an overbought or oversold condition.
The signal levels are all configurable to adapt the indicator across multiple instruments and markets.
The default configuration have been designed to obtain more accurate signals on Ethereum and Bitcoin, using the weekly timeframe.
Why Crypto Force Index?
The Crypto Force Index (CFI) is the consequence of my study of investments based on the accumulation plan. I wanted to demonstrate that I am improving the returns of the classic DCA ( dollar cost averaging ) and VA ( value averaging ).
After finding my own model of an accumulation plan, I decided to create the Crypto Force Index to help me visually enter the market.
The formulas of the indicator are very simple, but my studies confirm the power of this tool.
How are the signals to be interpreted?
The Crypto Force Index helps us to highlight the overbought and oversold areas, with the use of circles under the price of candles and with a thermometer inserted at the base of the graph, where all the phases of strength and weakness are highlighted.
As soon as the red circles start to appear on the chart, that may be a good time to enter LONG to the market and start accumulating. If the circles are green, we can consider decreasing the current exposure by selling part of your portfolio, or decide to stay flat.
I personally use these signals on the weekly timeframe, to decide to feed my accumulation plan at the beginning of each month.
I hope it can be of help to you! Please help me improve the Crypto Force Index! :)
Индекс относительной силы (RSI)

RSI based support resistance levelsThis indicator draws support line and resistance lines in the price chart.
How ?
For drawing the support/resistance line we need to first determine the demand and supply.
We are using too-familiar indicator RSI to determine when the script is oversold and overbought.
Now oversold (in RSI) is not a point, it’s a zone. The RSI indicator comes below 30, stays there and goes up above 30. Similarly for overbought.
Now if you carefully look at the oversold region – the lowest point of the oversold region is the place where the demand came (for surety) and push the indicator (and price) up.
Similarly: the highest point of overbought is the place where (for surety) the supply came and push the indicator (and price) down.
So that’ the supply / demand line (for surety).
In this indicator, based on the RSI we are just drawing support and resistance lines in the chat. That’s all.
What is unique ?
Trendline concept is not new. RSI is not new. RSI overbought/oversold is not new.
There are indicators exist to draw trendlines. Some of them works beautifully.
However, none of these, we are aware of, uses RSI to determine it. And, we believe, the most logical way to determine support/resistance is RSI.
Note: We are not responsible for any trading/investment decision you are taking out of the outcome of this indicator.

Simple Buy Sell SignalsIt is a simple indicator that provides buy or sell signals based on the intersection of two EMAs and a simple moving average (SMA). once the Relative Strength Index has confirmed it. For greater accuracy, add additional indicators like stochastic RSI, MACD, etc. Use only for intraday trading, Not for Positional Trading

RSI OS/OS Levels MTFThis plots the overbought and oversold (70 and 30) levels from RSI on price, there are often levels where a market will bounce or retrace/reverse.
By default it shows 15 min, 60 min and 4 hour levels but I intend to make these configurable along with some other stuff. For now it works how I use it, nice and simple

RSI TrendRSI Hull Trend is a hybrid indicator with RSI of HULL Signal. The Hull MA is combined with RSI to see if the Hull MA Buy/Sell Signal is in overbought or oversold condition. Buy Sell Signals are plotted based on settings of OB/OS or RSI. This indicator is very useful to see if the Trend is in Exhaustion or Beginning of a Trend. Entry and Exit conditions can be more precise based on OB/OS condition of price action. In addition normal RSI trend is plotted with trend color from Hull MA. Best Performance with Heiken Ashi Candles.
OB/OS Settings provided
Hull Buy/Sell Signals plotted
Double RSI FAST and DEFAULT signal with crossover
Bar Color applied based on Hull RSI Trend
Hull Trend + RSI + Price Action

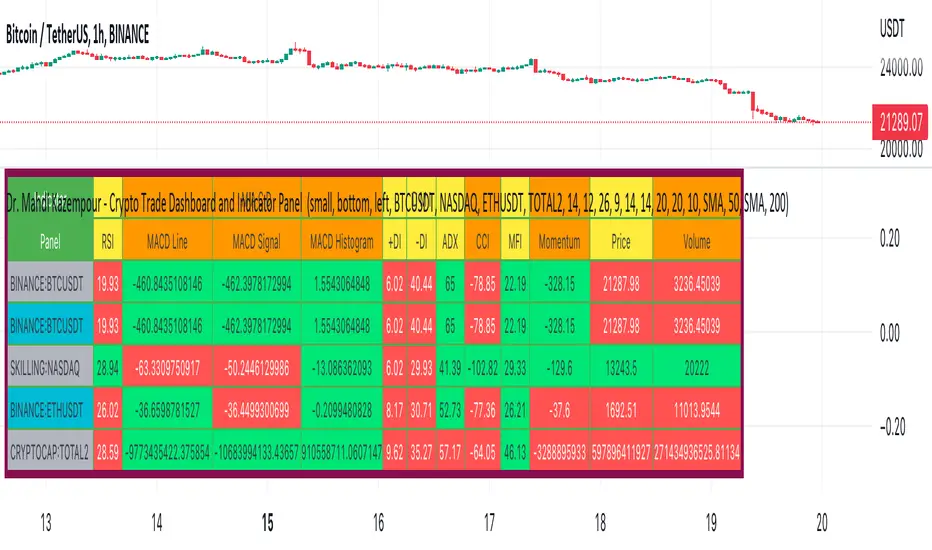
Dr. Mahdi Kazempour - Crypto Trade Dashboard and Indicator PanelA great panel for crypto traders all in one table:
Price, Volume, RSI, MACD, ADI, MOM
1) current symbol
2) BTCUSDT
3) NASDAQ
4) ETHUSDT
5) TOTAL2
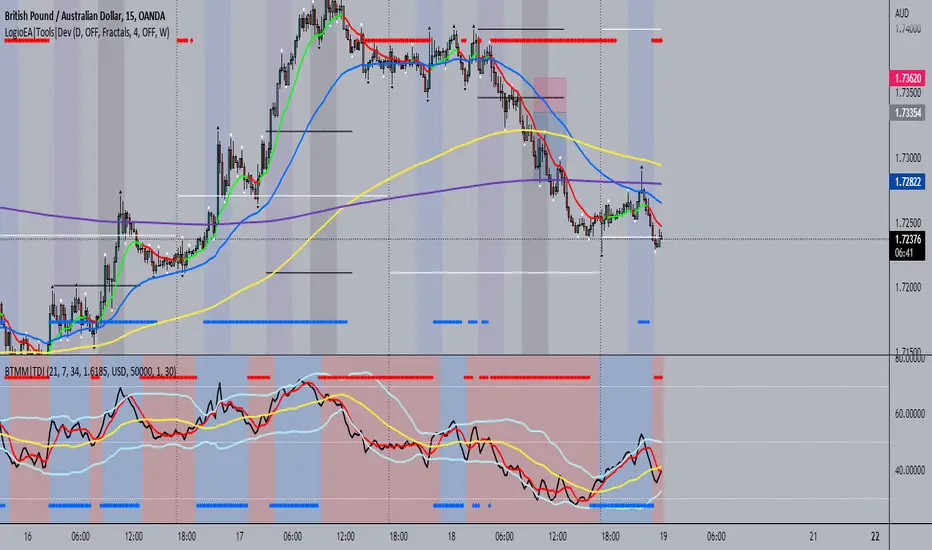
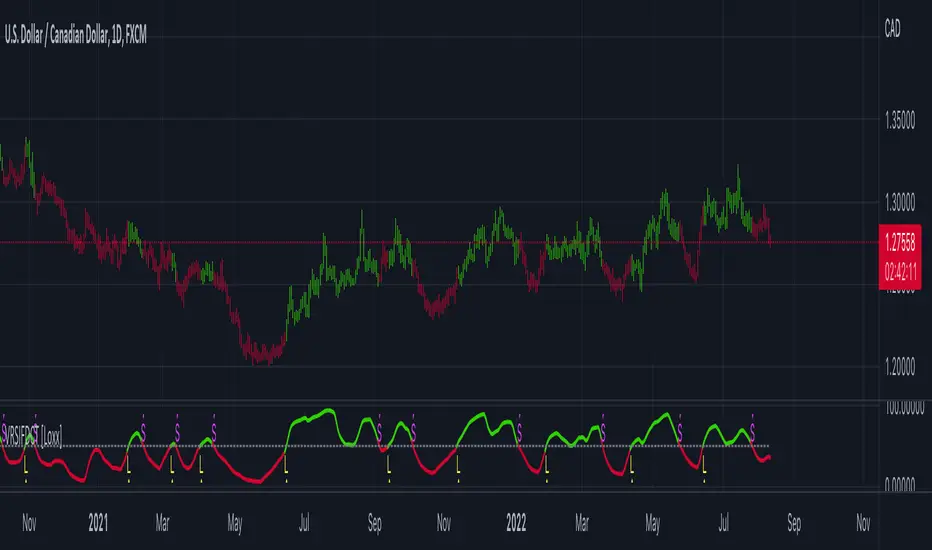
BTMM|TDIThis is the trader's dynamic index inspired by Steve Mauro's BTMM strategy.
In addition to the RSI, Trendline, Baseline, Volatility Bands I have also included additional trend biases that are painted in the background to provide more confluence when the markets break out in either direction.
For convenience, a position size calculator is included for all users to quickly calculate lot sizes on forex pairs with difference account balance currencies. The calculator works accurately on forex pairs. DO NOT USE for crypto or indices as some brokers have unique contract sizes that could not be fully incorporated into the tool.
There is also data table that displays historical values of the RSI, Trendline, Baseline, and an EMA vs Price scoring procedure that covers the current candle (t0) and up to 3 candles back. The table is meant to provide a snapshot view of either bullish or bearish dominance that can be deciphered with a quick glance.
Rsi/W%R/Stoch/Mfi: HTF overlay mini-plotsOverlay mini-plots for various indicators. Shows current timeframe; and option to plot 2x higher timeframes (i.e. 15min and 60min on the 5min chart above).
The idea is to de-clutter chart when you just want real-time snippets for an indicator.
Useful for gauging overbought/oversold, across timeframes, at a glance.
~~Indicators~~
~RSI: Relative strength index
~W%R: Williams percent range
~Stochastic
~MFI: Money flow index
~~Inputs~~
~indicator length (NB default is set to 12, NOT the standard 14)
~choose 2x HTFs, show/hide HTF plots
~choose number of bars to show (current timeframe only; HTF plots show only 6 bars)
~horizontal position: offset (bars); shift plots right or left. Can be negative
~vertical position: top/middle/bottom
~other formatting options (color, line thickness, show/hide labels, 70/30 lines, 80/20 lines)
~~tips~~
~should be relatively easy to add further indicators, so long as they are 0-100 based; by editing lines 9 and 11
~change the vertical compression of the plots by playing around with the numbers (+100, -400, etc) in lines 24 and 25

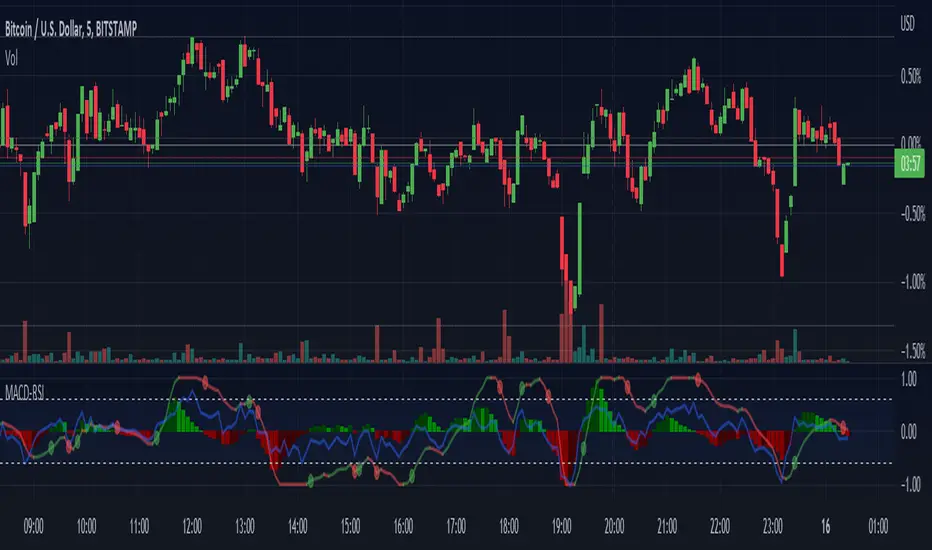
Normalized MACD with RSI [bkeevil]This indicator normalizes the MACD and RSI indicators to a range between -1.0 and 1.0 so they can be displayed together on the same chart to save screen real-estate.
While the MACD is a good indicator to detect trend changes, in some circumstances (such as a sideways range market) it can give false signals. The MACD is more likely to give a false signal when the RSI indicator is close to the centerline than if the RSI is signaling an overbought or oversold condition. Thus the RSI indicator and MACD indicator are commonly used together.
I have included a few features found in other MACD indicators that I have found helpful:
MACD line changes color if it is rising or falling
Dots at the MACD line to signal crossovers
The MACD signal line is hidden it by default as the information it contains is redundant. Hiding the signal line makes the indicator less busy.
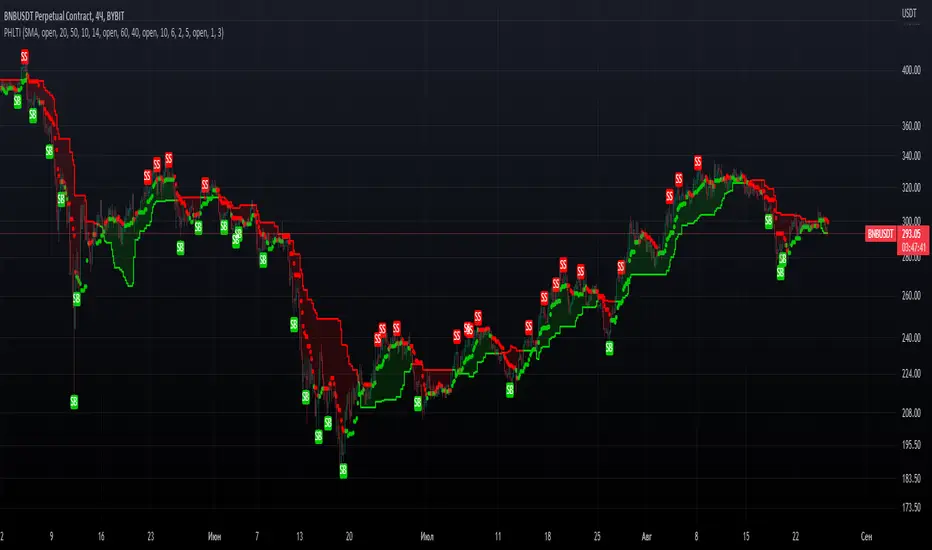
PrevHighLow Trend IndicatorPrevHighLow Trend Indicator which is calculated by using prev lowest and highest of p1 -period and p2 -period for two MAs.
First MA is made of prev highest of p1-period / prev lowest of p1-period.
Second MA is faster, made up of p2(<p1)- period(same formula).
Can be used in the next way: slower MA(straight line) shows main trend, faster shows temporary trend.
BUY, when first MA and second MA are green; Exit: second MA changes from green to red.
SELL, when first MA and second MA are red; Exit: second MA changes from red to green.
RSI Assistant basically filtres signals in the way, when signals from RSI and Faster MA are similar? it signals about it with labels: BUY for long, SELL for short. You can either enable or disable it. Also customizable so you can find your setup. RSI Assistant, depending on you customize it, can help you either follow trend or show reversals. Just find your own setup and watch things happen!
Feel free to leave valuable feedback and your setups which you consider to be good.
Hope you PHLTI usefull. Good luck!
Ultimate RSI - Divergence + S/R + Reverse RSIThis is a modification of the TradingView RSI with some of my favourite RSI features added.
This includes Divergence indicators. EMA with colour change on cross, Support and resistance lines and reverse RSI.
A reverse calc has also been added. This will allow you to input 3 different RSI values for a price prediction. This is good to use with the support and resistance lines and can give you key areas on the chart where the price may bounce/reject.
All colours and modifications can be turned on/off.
Enjoy! :)

Multi Type RSI [Misu]█ This Indicator is based on RSI ( Relative Strength Index ) & multiple type of MA (Moving Average) to show different variations of RSI.
The relative strength index (RSI) is a momentum indicator used in technical analysis to evaluate overvalued or undervalued conditions in the price of that security.
█ Usages:
The purpose of this indicator is to obtain the RSI calculated with different MAs modes instead of the classic RMA.
The red and green zones indicate the oversold and overbought zones.
Buy or sell signals are marked by the green and red circles
We have 2 different signal modes : when the different size RSIs cross and when the fast RSI crosses the extreme bands.
Alerts are setup.
█ Parameters:
Lenght RSI: The lenght of the RSI. (14 by default)
RSI MA Type: The type of MA with which the rsi will be calculated. ("SMA", "EMA", "SMMA (RMA)", "WMA", "VWMA")
Fast Lenght MA: The fast lenght smoothing MA.
Slow Lenght MA: The Slow lenght smoothing MA.
Lower Band: The lenght of the lower band. (25 by default)
Upper Band: The lenght of the upper band. (75 by default)
Signal Type: The mode with which buy and sell signals are triggered. ("Cross 2 Mas", "Cross Ma/Bands")

Commodity Channel Relative StrengthNew concept(I think atleast) I've joined the Standard RSI and CCI at the hip with another plotcandle, which gives a picture of a larger candle With more interesting movement imo. Includes Fib Retracement Levels, High/Low and a couple of coppock curves for more confirmation. Broadening candles seem to indicate a weakening of trend strength (from what i've seen atleast) although exceptions do occur. Vice versa for tapering to a lesser degree I imagine. RSI has been shifted down to 0 to align the center point with the CCI , so the usual 30/70 RSI Levels are now -20/20 (although I have 30/-30 instead for the hlines).

CRSI - EddyBased on Cyclic Smoothed Relative Strength Indicator v2 by WhenToTrade
The cyclic smoothed RSI indicator is an enhancement of the classic RSI , adding
- additional smoothing according to the market vibration,
- adaptive upper and lower bands according to the cyclic memory and
- using the current dominant cycle length as input for the indicator.
The cRSI is used like a standard indicator but I've added bar colors and reduced the period minimum to 1.
The default settings uses period of 4.
Bar colors explanation:
Yellow = Bullish cross up of crsi and ub
Lime = bullish continuation
Fuchsia = Cross down of crsi and ub
Red = Cross down of crsi and db
Black = Bearish continuation
ub = aqua line high
db = aqua line low
crsi = fuchsia line representing smoothed RSI
Enjoy!

Variety RSI of Fast Discrete Cosine Transform [Loxx]Variety RSI of Fast Discrete Cosine Transform is an RSI indicator with 7 types of RSI that is calculated on the Fast Discrete Cosine Transform of source. The source inputs are 33 different source types from Loxx's Expanded Source Types.
What is Discrete Cosine Transform?
A discrete cosine transform (DCT) expresses a finite sequence of data points in terms of a sum of cosine functions oscillating at different frequencies. The DCT, first proposed by Nasir Ahmed in 1972, is a widely used transformation technique in signal processing and data compression. It is used in most digital media, including digital images (such as JPEG and HEIF, where small high-frequency components can be discarded), digital video (such as MPEG and H.26x), digital audio (such as Dolby Digital, MP3 and AAC), digital television (such as SDTV, HDTV and VOD), digital radio (such as AAC+ and DAB+), and speech coding (such as AAC-LD, Siren and Opus). DCTs are also important to numerous other applications in science and engineering, such as digital signal processing, telecommunication devices, reducing network bandwidth usage, and spectral methods for the numerical solution of partial differential equations.
Fast Discrete Cosine Transform
The algorithm performs a fast cosine transform of the real function defined by nn samples on the real axis.
Depending on the passed parameters, it can be executed both direct and inverse conversion.
Input parameters:
tnn - Number of function values minus one. Should be 1024 degree of two. The algorithm does not check correct value passed.
a - array of Real 1025 Function values.
InverseFCT - the direction of the transformation. True if reverse, False if direct.
Output parameters: a - the result of the transformation. For more details, see description on the site. www.alglib.net
Included:
7 types of RSI
33 source inputs from Loxx's Expanded Source Types
2 types of signals
Alerts
2 Ema Pullback StrategyHi everyone!
CAUTION... This is only an indicator. Do not rely 100% on it.
I made this indicator hoping to help everyone with this specific Pull Back Scalping Strategy.
RULES:
Time Chart of 5minuts
LONG Condition - "EMA Red Line" below the "EMA Blue Line" and wait for a green long signal.
SHORT Condition - "EMA Red Line" below the "EMA Blue Line" and wait for a red short signal
Feel free to add any adjustments or give feedback so we can improve.
The strategy idea and guidelines came from "The Master" Juan Luis.
Autor: © Germangroa

STD-Filtered Variety RSI of Double Averages w/ DSL [Loxx]STD-Filtered Variety RSI of Double Averages w/ DSL is a standard deviation step filtered RSI indicator that is calculated using double smoothing. The user can choose from 8 different RSI types and 38 different double smoothing types. This indicator uses Discontinued Signal Lines instead of regular signals and levels. This allows the signals to be more precise in catching early trend breakouts and breakdowns.
Things to note
Double smoothing of the source does not function like DEMA, for example. This double smoothing is just smoothing of smoothing of source
There are two types of smoothing for Discontinued Signals Lines: Regular EMA and Fast EMA
T3 RSI has been added on top of Loxx's Variety RSI library
Contained inside this indicator
Loxx's Moving Averages
Loxx's Variety RSI
Related indicators
Corrected RSI w/ Floating Levels
Adaptive, Jurik-Filtered, Floating RSI
Variety RSI w/ Dynamic Zones
Included
Bar coloring
Alerts
2 types of signals with precision adjustment
Loxx's Variety RSI
Loxx's Moving Averages

Crypto Breakout IndicatorHey Guys,
The idea of the script is that accumalation and small pumps do happen before the big ones, therefore, i tried to create a breakout indicator that can tell that:
the script components are:
1- Price to consolidate within 15% range between the highest of 6 candles and lowest of 6 candles
2- Price needs to breakout with minimum of 1% and maximum of 20%
3- Price needs to have sufficient volume, hence volume of current bar needs to be higher than previous one with 10% at least
4- RSI needs to be between 50 and 75
5- Bollinger Bands Percentage needs to be equal or lower than 1
6- Price is closing above EMA200
I tried to make all these numbers to be available for you guys through settings so you can tell me about any better settings!

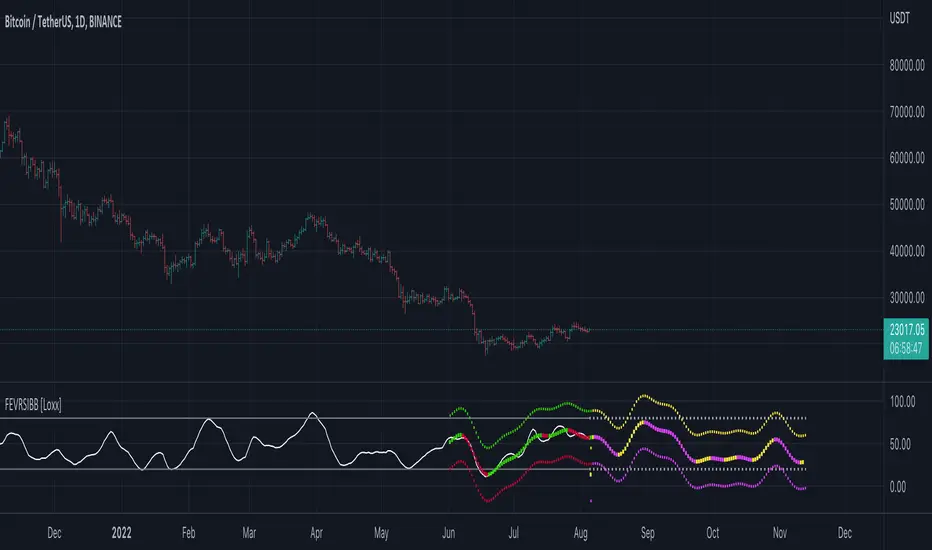
Fourier Extrapolator of Variety RSI w/ Bollinger Bands [Loxx]Fourier Extrapolator of Variety RSI w/ Bollinger Bands is an RSI indicator that shows the original RSI, the Fourier Extrapolation of RSI in the past, and then the projection of the Fourier Extrapolated RSI for the future. This indicator has 8 different types of RSI including a new type of RSI called T3 RSI. The purpose of this indicator is to demonstrate the Fourier Extrapolation method used to model past data and to predict future price movements. This indicator will repaint. If you wish to use this for trading, then make sure to take a screenshot of the indicator when you enter the trade to save your analysis. This is the first of a series of forecasting indicators that can be used in trading. Due to how this indicator draws on the screen, you must choose values of npast and nfut that are equal to or less than 200. this is due to restrictions by TradingView and Pine Script in only allowing 500 lines on the screen at a time. Enjoy!
What is Fourier Extrapolation?
This indicator uses a multi-harmonic (or multi-tone) trigonometric model of a price series xi, i=1..n, is given by:
xi = m + Sum( a*Cos(w*i) + b*Sin(w*i), h=1..H )
Where:
xi - past price at i-th bar, total n past prices;
m - bias;
a and b - scaling coefficients of harmonics;
w - frequency of a harmonic ;
h - harmonic number;
H - total number of fitted harmonics.
Fitting this model means finding m, a, b, and w that make the modeled values to be close to real values. Finding the harmonic frequencies w is the most difficult part of fitting a trigonometric model. In the case of a Fourier series, these frequencies are set at 2*pi*h/n. But, the Fourier series extrapolation means simply repeating the n past prices into the future.
This indicator uses the Quinn-Fernandes algorithm to find the harmonic frequencies. It fits harmonics of the trigonometric series one by one until the specified total number of harmonics H is reached. After fitting a new harmonic , the coded algorithm computes the residue between the updated model and the real values and fits a new harmonic to the residue.
see here: A Fast Efficient Technique for the Estimation of Frequency , B. G. Quinn and J. M. Fernandes, Biometrika, Vol. 78, No. 3 (Sep., 1991), pp . 489-497 (9 pages) Published By: Oxford University Press
The indicator has the following input parameters:
src - input source
npast - number of past bars, to which trigonometric series is fitted;
Nfut - number of predicted future bars;
nharm - total number of harmonics in model;
frqtol - tolerance of frequency calculations.
Included:
Loxx's Expanded Source Types
Loxx's Variety RSI
Other indicators using this same method
Fourier Extrapolator of Price w/ Projection Forecast
Fourier Extrapolator of Price
Polynomial-Regression-Fitted RSI [Loxx]Polynomial-Regression-Fitted RSI is an RSI indicator that is calculated using Polynomial Regression Analysis. For this one, we're just smoothing the signal this time. And we're using an odd moving average to do so: the Sine Weighted Moving Average. The Sine Weighted Moving Average assigns the most weight at the middle of the data set. It does this by weighting from the first half of a Sine Wave Cycle and the most weighting is given to the data in the middle of that data set. The Sine WMA closely resembles the TMA (Triangular Moving Average). So we're trying to tease out some cycle information here as well, however, you can change this MA to whatever soothing method you wish. I may come back to this one and remove the point modifier and then add preliminary smoothing, but for now, just the signal gets the smoothing treatment.
What is Polynomial Regression?
In statistics, polynomial regression is a form of regression analysis in which the relationship between the independent variable x and the dependent variable y is modeled as an nth degree polynomial in x. Polynomial regression fits a nonlinear relationship between the value of x and the corresponding conditional mean of y, denoted E(y |x). Although polynomial regression fits a nonlinear model to the data, as a statistical estimation problem it is linear, in the sense that the regression function E(y | x) is linear in the unknown parameters that are estimated from the data. For this reason, polynomial regression is considered to be a special case of multiple linear regression .
Included
Alerts
Signals
Bar coloring
Loxx's Expanded Source Types
Loxx's Moving Averages
Other indicators in this series using Polynomial Regression Analysis.
Poly Cycle
PA-Adaptive Polynomial Regression Fitted Moving Average
Polynomial-Regression-Fitted Oscillator
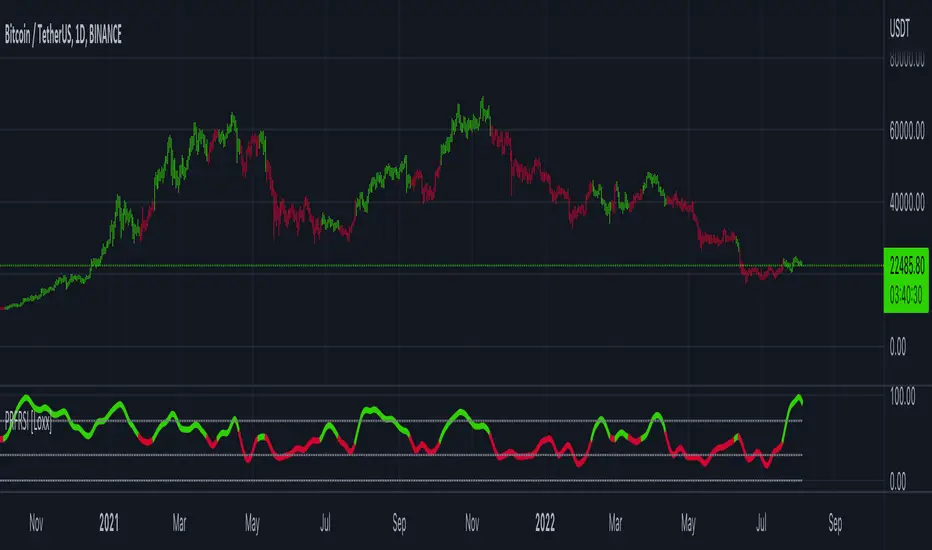
PharshK RSI and Zigzag with H/LIt is with RSI level
and Zigzag Pattern that Market goes on Maximum level and Lower Level
And it is also Showing High and Law Level of last Moving Candle so it is easy to entry and Hold

PharshK RSI and Zigzag with H/LIt is with RSI level
and Zigzag Pattern that Market goes on Maximum level and Lower Level
And it is also Showing High and Law Level of last Moving Candle so it is easy to entry and Hold

Non-Lag Inverse Fisher Transform of RSX [Loxx]Non-Lag Inverse Fisher Transform of RSX is an Inverse Fisher Transform on the Non-Lagged Smoothing Filter of Jurik RSX.
What is the Inverse Fisher Transform?
The Inverse Fisher Transform was authored by John Ehlers. The IFT applies some math functions and constants to a moving average of the relative strength index (rsi) of the closing price to calculate its oscillator position. T
read more here: www.mesasoftware.com
What is RSX?
RSI is a very popular technical indicator, because it takes into consideration market speed, direction and trend uniformity. However, the its widely criticized drawback is its noisy (jittery) appearance. The Jurk RSX retains all the useful features of RSI , but with one important exception: the noise is gone with no added lag.
What is the Non-lag moving average?
The Non Lag Moving average follows price closely and gives very quick signals as well as early signals of price change. As a standalone Moving Average, it should not be used on its own, but as an additional confluence tool for early signals.
Included:
Alerts
Signals
Bar coloring