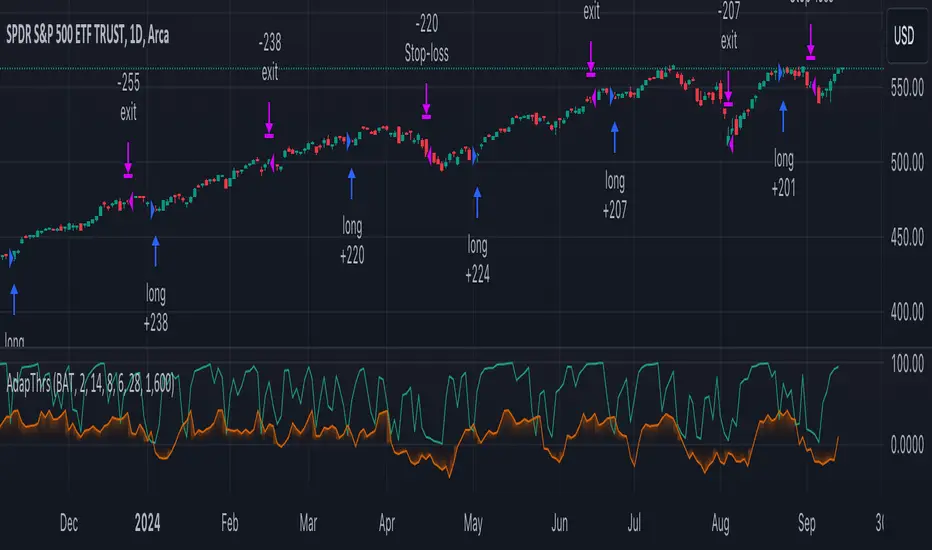
TASC 2024.10 Adaptive Oscillator Threshold█ OVERVIEW
This script introduces a more dynamic approach to generating trading signals using the RSI indicator and a threshold that adapts to price trends and dispersion. This methodology comes from Francesco Bufi's article "Overbought/Oversold Oscillators: Useless Or Just Misused" from the October 2024 edition of TASC's Traders' Tips .
█ CONCEPTS
According to Francesco Bufi's observations, an oscillator-based buy signal should have a threshold that varies with the trend direction: higher during uptrends and lower during downtrends. Additionally, the level should decrease as the distance from the price to its mean increases to reduce signals in volatile conditions. Accordingly, Bufi proposes a formula for an adaptive buy level whose value is proportional to the trend (linear regression slope) and inversely proportional to the typical distance between price and its mean (standard deviation). Traders can apply this method to any oscillator to add adaptivity without modifying the oscillator's calculations, as it's simply an adaptive technique for interpreting the calculated values.
This script demonstrates the application of Bufi's Adaptive Threshold (BAT) in a simple RSI-based strategy and allows users to compare its performance to the traditional fixed-threshold approach. Bufi's observations suggest that using the BAT instead of a static threshold can help improve the backtest performance of oscillator-based systems.
█ DISCLAIMER
This strategy script educates users on the trading systems outlined by the TASC article. By default, it uses 10% of equity as the order size and a slippage amount of 5 ticks. Traders should adjust these settings and the commission amount when using this script.
Индекс относительной силы (RSI)
RSI Trend Following StrategyOverview
The RSI Trend Following Strategy utilizes Relative Strength Index (RSI) to enter the trade for the potential trend continuation. It uses Stochastic indicator to check is the price is not in overbought territory and the MACD to measure the current price momentum. Moreover, it uses the 200-period EMA to filter the counter trend trades with the higher probability. The strategy opens only long trades.
Unique Features
Dynamic stop-loss system: Instead of fixed stop-loss level strategy utilizes average true range (ATR) multiplied by user given number subtracted from the position entry price as a dynamic stop loss level.
Configurable Trading Periods: Users can tailor the strategy to specific market windows, adapting to different market conditions.
Two layers trade filtering system: Strategy utilizes MACD and Stochastic indicators measure the current momentum and overbought condition and use 200-period EMA to filter trades against major trend.
Trailing take profit level: After reaching the trailing profit activation level script activates the trailing of long trade using EMA. More information in methodology.
Wide opportunities for strategy optimization: Flexible strategy settings allows users to optimize the strategy entries and exits for chosen trading pair and time frame.
Methodology
The strategy opens long trade when the following price met the conditions:
RSI is above 50 level.
MACD line shall be above the signal line
Both lines of Stochastic shall be not higher than 80 (overbought territory)
Candle’s low shall be above the 200 period EMA
When long trade is executed, strategy set the stop-loss level at the price ATR multiplied by user-given value below the entry price. This level is recalculated on every next candle close, adjusting to the current market volatility.
At the same time strategy set up the trailing stop validation level. When the price crosses the level equals entry price plus ATR multiplied by user-given value script starts to trail the price with trailing EMA(by default = 20 period). If price closes below EMA long trade is closed. When the trailing starts, script prints the label “Trailing Activated”.
Strategy settings
In the inputs window user can setup the following strategy settings:
ATR Stop Loss (by default = 1.75)
ATR Trailing Profit Activation Level (by default = 2.25)
MACD Fast Length (by default = 12, period of averaging fast MACD line)
MACD Fast Length (by default = 26, period of averaging slow MACD line)
MACD Signal Smoothing (by default = 9, period of smoothing MACD signal line)
Oscillator MA Type (by default = EMA, available options: SMA, EMA)
Signal Line MA Type (by default = EMA, available options: SMA, EMA)
RSI Length (by default = 14, period for RSI calculation)
Trailing EMA Length (by default = 20, period for EMA, which shall be broken close the trade after trailing profit activation)
Justification of Methodology
This trading strategy is designed to leverage a combination of technical indicators—Relative Strength Index (RSI), Moving Average Convergence Divergence (MACD), Stochastic Oscillator, and the 200-period Exponential Moving Average (EMA)—to determine optimal entry points for long trades. Additionally, the strategy uses the Average True Range (ATR) for dynamic risk management to adapt to varying market conditions. Let's look in details for which purpose each indicator is used for and why it is used in this combination.
Relative Strength Index (RSI) is a momentum indicator used in technical analysis to measure the speed and change of price movements in a financial market. It helps traders identify whether an asset is potentially overbought (overvalued) or oversold (undervalued), which can indicate a potential reversal or continuation of the current trend.
How RSI Works? RSI tracks the strength of recent price changes. It compares the average gains and losses over a specific period (usually 14 periods) to assess the momentum of an asset. Average gain is the average of all positive price changes over the chosen period. It reflects how much the price has typically increased during upward movements. Average loss is the average of all negative price changes over the same period. It reflects how much the price has typically decreased during downward movements.
RSI calculates these average gains and losses and compares them to create a value between 0 and 100. If the RSI value is above 70, the asset is generally considered overbought, meaning it might be due for a price correction or reversal downward. Conversely, if the RSI value is below 30, the asset is considered oversold, suggesting it could be poised for an upward reversal or recovery. RSI is a useful tool for traders to determine market conditions and make informed decisions about entering or exiting trades based on the perceived strength or weakness of an asset's price movements.
This strategy uses RSI as a short-term trend approximation. If RSI crosses over 50 it means that there is a high probability of short-term trend change from downtrend to uptrend. Therefore RSI above 50 is our first trend filter to look for a long position.
The MACD (Moving Average Convergence Divergence) is a popular momentum and trend-following indicator used in technical analysis. It helps traders identify changes in the strength, direction, momentum, and duration of a trend in an asset's price.
The MACD consists of three components:
MACD Line: This is the difference between a short-term Exponential Moving Average (EMA) and a long-term EMA, typically calculated as: MACD Line = 12 period EMA − 26 period EMA
Signal Line: This is a 9-period EMA of the MACD Line, which helps to identify buy or sell signals. When the MACD Line crosses above the Signal Line, it can be a bullish signal (suggesting a buy); when it crosses below, it can be a bearish signal (suggesting a sell).
Histogram: The histogram shows the difference between the MACD Line and the Signal Line, visually representing the momentum of the trend. Positive histogram values indicate increasing bullish momentum, while negative values indicate increasing bearish momentum.
This strategy uses MACD as a second short-term trend filter. When MACD line crossed over the signal line there is a high probability that uptrend has been started. Therefore MACD line above signal line is our additional short-term trend filter. In conjunction with RSI it decreases probability of following false trend change signals.
The Stochastic Indicator is a momentum oscillator that compares a security's closing price to its price range over a specific period. It's used to identify overbought and oversold conditions. The indicator ranges from 0 to 100, with readings above 80 indicating overbought conditions and readings below 20 indicating oversold conditions.
It consists of two lines:
%K: The main line, calculated using the formula (CurrentClose−LowestLow)/(HighestHigh−LowestLow)×100 . Highest and lowest price taken for 14 periods.
%D: A smoothed moving average of %K, often used as a signal line.
This strategy uses stochastic to define the overbought conditions. The logic here is the following: we want to avoid long trades in the overbought territory, because when indicator reaches it there is a high probability that the potential move is gonna be restricted.
The 200-period EMA is a widely recognized indicator for identifying the long-term trend direction. The strategy only trades in the direction of this primary trend to increase the probability of successful trades. For instance, when the price is above the 200 EMA, only long trades are considered, aligning with the overarching trend direction.
Therefore, strategy uses combination of RSI and MACD to increase the probability that price now is in short-term uptrend, Stochastic helps to avoid the trades in the overbought (>80) territory. To increase the probability of opening long trades in the direction of a main trend and avoid local bounces we use 200 period EMA.
ATR is used to adjust the strategy risk management to the current market volatility. If volatility is low, we don’t need the large stop loss to understand the there is a high probability that we made a mistake opening the trade. User can setup the settings ATR Stop Loss and ATR Trailing Profit Activation Level to realize his own risk to reward preferences, but the unique feature of a strategy is that after reaching trailing profit activation level strategy is trying to follow the trend until it is likely to be finished instead of using fixed risk management settings. It allows sometimes to be involved in the large movements.
Backtest Results
Operating window: Date range of backtests is 2023.01.01 - 2024.08.01. It is chosen to let the strategy to close all opened positions.
Commission and Slippage: Includes a standard Binance commission of 0.1% and accounts for possible slippage over 5 ticks.
Initial capital: 10000 USDT
Percent of capital used in every trade: 30%
Maximum Single Position Loss: -3.94%
Maximum Single Profit: +15.78%
Net Profit: +1359.21 USDT (+13.59%)
Total Trades: 111 (36.04% win rate)
Profit Factor: 1.413
Maximum Accumulated Loss: 625.02 USDT (-5.85%)
Average Profit per Trade: 12.25 USDT (+0.40%)
Average Trade Duration: 40 hours
These results are obtained with realistic parameters representing trading conditions observed at major exchanges such as Binance and with realistic trading portfolio usage parameters.
How to Use
Add the script to favorites for easy access.
Apply to the desired timeframe and chart (optimal performance observed on 2h BTC/USDT).
Configure settings using the dropdown choice list in the built-in menu.
Set up alerts to automate strategy positions through web hook with the text: {{strategy.order.alert_message}}
Disclaimer:
Educational and informational tool reflecting Skyrex commitment to informed trading. Past performance does not guarantee future results. Test strategies in a simulated environment before live implementation

Intramarket Difference Index StrategyHi Traders !!
The IDI Strategy:
In layman’s terms this strategy compares two indicators across markets and exploits their differences.
note: it is best the two markets are correlated as then we know we are trading a short to long term deviation from both markets' general trend with the assumption both markets will trend again sometime in the future thereby exhausting our trading opportunity.
📍 Import Notes:
This Strategy calculates trade position size independently (i.e. risk per trade is controlled in the user inputs tab), this means that the ‘Order size’ input in the ‘Properties’ tab will have no effect on the strategy. Why ? because this allows us to define custom position size algorithms which we can use to improve our risk management and equity growth over time. Here we have the option to have fixed quantity or fixed percentage of equity ATR (Average True Range) based stops in addition to the turtle trading position size algorithm.
‘Pyramiding’ does not work for this strategy’, similar to the order size input togeling this input will have no effect on the strategy as the strategy explicitly defines the maximum order size to be 1.
This strategy is not perfect, and as of writing of this post I have not traded this algo.
Always take your time to backtests and debug the strategy.
🔷 The IDI Strategy:
By default this strategy pulls data from your current TV chart and then compares it to the base market, be default BINANCE:BTCUSD . The strategy pulls SMA and RSI data from either market (we call this the difference data), standardizes the data (solving the different unit problem across markets) such that it is comparable and then differentiates the data, calling the result of this transformation and difference the Intramarket Difference (ID). The formula for the the ID is
ID = market1_diff_data - market2_diff_data (1)
Where
market(i)_diff_data = diff_data / ATR(j)_market(i)^0.5,
where i = {1, 2} and j = the natural numbers excluding 0
Formula (1) interpretation is the following
When ID > 0: this means the current market outperforms the base market
When ID = 0: Markets are at long run equilibrium
When ID < 0: this means the current market underperforms the base market
To form the strategy we define one of two strategy type’s which are Trend and Mean Revesion respectively.
🔸 Trend Case:
Given the ‘‘Strategy Type’’ is equal to TREND we define a threshold for which if the ID crosses over we go long and if the ID crosses under the negative of the threshold we go short.
The motivating idea is that the ID is an indicator of the two symbols being out of sync, and given we know volatility clustering, momentum and mean reversion of anomalies to be a stylised fact of financial data we can construct a trading premise. Let's first talk more about this premise.
For some markets (cryptocurrency markets - synthetic symbols in TV) the stylised fact of momentum is true, this means that higher momentum is followed by higher momentum, and given we know momentum to be a vector quantity (with magnitude and direction) this momentum can be both positive and negative i.e. when the ID crosses above some threshold we make an assumption it will continue in that direction for some time before executing back to its long run equilibrium of 0 which is a reasonable assumption to make if the market are correlated. For example for the BTCUSD - ETHUSD pair, if the ID > +threshold (inputs for MA and RSI based ID thresholds are found under the ‘‘INTRAMARKET DIFFERENCE INDEX’’ group’), ETHUSD outperforms BTCUSD, we assume the momentum to continue so we go long ETHUSD.
In the standard case we would exit the market when the IDI returns to its long run equilibrium of 0 (for the positive case the ID may return to 0 because ETH’s difference data may have decreased or BTC’s difference data may have increased). However in this strategy we will not define this as our exit condition, why ?
This is because we want to ‘‘let our winners run’’, to achieve this we define a trailing Donchian Channel stop loss (along with a fixed ATR based stop as our volatility proxy). If we were too use the 0 exit the strategy may print a buy signal (ID > +threshold in the simple case, market regimes may be used), return to 0 and then print another buy signal, and this process can loop may times, this high trade frequency means we fail capture the entire market move lowering our profit, furthermore on lower time frames this high trade frequencies mean we pay more transaction costs (due to price slippage, commission and big-ask spread) which means less profit.
By capturing the sum of many momentum moves we are essentially following the trend hence the trend following strategy type.
Here we also print the IDI (with default strategy settings with the MA difference type), we can see that by letting our winners run we may catch many valid momentum moves, that results in a larger final pnl that if we would otherwise exit based on the equilibrium condition(Valid trades are denoted by solid green and red arrows respectively and all other valid trades which occur within the original signal are light green and red small arrows).
another example...
Note: if you would like to plot the IDI separately copy and paste the following code in a new Pine Script indicator template.
indicator("IDI")
// INTRAMARKET INDEX
var string g_idi = "intramarket diffirence index"
ui_index_1 = input.symbol("BINANCE:BTCUSD", title = "Base market", group = g_idi)
// ui_index_2 = input.symbol("BINANCE:ETHUSD", title = "Quote Market", group = g_idi)
type = input.string("MA", title = "Differrencing Series", options = , group = g_idi)
ui_ma_lkb = input.int(24, title = "lookback of ma and volatility scaling constant", group = g_idi)
ui_rsi_lkb = input.int(14, title = "Lookback of RSI", group = g_idi)
ui_atr_lkb = input.int(300, title = "ATR lookback - Normalising value", group = g_idi)
ui_ma_threshold = input.float(5, title = "Threshold of Upward/Downward Trend (MA)", group = g_idi)
ui_rsi_threshold = input.float(20, title = "Threshold of Upward/Downward Trend (RSI)", group = g_idi)
//>>+----------------------------------------------------------------+}
// CUSTOM FUNCTIONS |
//<<+----------------------------------------------------------------+{
// construct UDT (User defined type) containing the IDI (Intramarket Difference Index) source values
// UDT will hold many variables / functions grouped under the UDT
type functions
float Close // close price
float ma // ma of symbol
float rsi // rsi of the asset
float atr // atr of the asset
// the security data
getUDTdata(symbol, malookback, rsilookback, atrlookback) =>
indexHighTF = barstate.isrealtime ? 1 : 0
= request.security(symbol, timeframe = timeframe.period,
expression = [close , // Instentiate UDT variables
ta.sma(close, malookback) ,
ta.rsi(close, rsilookback) ,
ta.atr(atrlookback) ])
data = functions.new(close_, ma_, rsi_, atr_)
data
// Intramerket Difference Index
idi(type, symbol1, malookback, rsilookback, atrlookback, mathreshold, rsithreshold) =>
threshold = float(na)
index1 = getUDTdata(symbol1, malookback, rsilookback, atrlookback)
index2 = getUDTdata(syminfo.tickerid, malookback, rsilookback, atrlookback)
// declare difference variables for both base and quote symbols, conditional on which difference type is selected
var diffindex1 = 0.0, var diffindex2 = 0.0,
// declare Intramarket Difference Index based on series type, note
// if > 0, index 2 outpreforms index 1, buy index 2 (momentum based) until equalibrium
// if < 0, index 2 underpreforms index 1, sell index 1 (momentum based) until equalibrium
// for idi to be valid both series must be stationary and normalised so both series hae he same scale
intramarket_difference = 0.0
if type == "MA"
threshold := mathreshold
diffindex1 := (index1.Close - index1.ma) / math.pow(index1.atr*malookback, 0.5)
diffindex2 := (index2.Close - index2.ma) / math.pow(index2.atr*malookback, 0.5)
intramarket_difference := diffindex2 - diffindex1
else if type == "RSI"
threshold := rsilookback
diffindex1 := index1.rsi
diffindex2 := index2.rsi
intramarket_difference := diffindex2 - diffindex1
//>>+----------------------------------------------------------------+}
// STRATEGY FUNCTIONS CALLS |
//<<+----------------------------------------------------------------+{
// plot the intramarket difference
= idi(type,
ui_index_1,
ui_ma_lkb,
ui_rsi_lkb,
ui_atr_lkb,
ui_ma_threshold,
ui_rsi_threshold)
//>>+----------------------------------------------------------------+}
plot(intramarket_difference, color = color.orange)
hline(type == "MA" ? ui_ma_threshold : ui_rsi_threshold, color = color.green)
hline(type == "MA" ? -ui_ma_threshold : -ui_rsi_threshold, color = color.red)
hline(0)
Note it is possible that after printing a buy the strategy then prints many sell signals before returning to a buy, which again has the same implication (less profit. Potentially because we exit early only for price to continue upwards hence missing the larger "trend"). The image below showcases this cenario and again, by allowing our winner to run we may capture more profit (theoretically).
This should be clear...
🔸 Mean Reversion Case:
We stated prior that mean reversion of anomalies is an standerdies fact of financial data, how can we exploit this ?
We exploit this by normalizing the ID by applying the Ehlers fisher transformation. The transformed data is then assumed to be approximately normally distributed. To form the strategy we employ the same logic as for the z score, if the FT normalized ID > 2.5 (< -2.5) we buy (short). Our exit conditions remain unchanged (fixed ATR stop and trailing Donchian Trailing stop)
🔷 Position Sizing:
If ‘‘Fixed Risk From Initial Balance’’ is toggled true this means we risk a fixed percentage of our initial balance, if false we risk a fixed percentage of our equity (current balance).
Note we also employ a volatility adjusted position sizing formula, the turtle training method which is defined as follows.
Turtle position size = (1/ r * ATR * DV) * C
Where,
r = risk factor coefficient (default is 20)
ATR(j) = risk proxy, over j times steps
DV = Dollar Volatility, where DV = (1/Asset Price) * Capital at Risk
🔷 Risk Management:
Correct money management means we can limit risk and increase reward (theoretically). Here we employ
Max loss and gain per day
Max loss per trade
Max number of consecutive losing trades until trade skip
To read more see the tooltips (info circle).
🔷 Take Profit:
By defualt the script uses a Donchain Channel as a trailing stop and take profit, In addition to this the script defines a fixed ATR stop losses (by defualt, this covers cases where the DC range may be to wide making a fixed ATR stop usefull), ATR take profits however are defined but optional.
ATR SL and TP defined for all trades
🔷 Hurst Regime (Regime Filter):
The Hurst Exponent (H) aims to segment the market into three different states, Trending (H > 0.5), Random Geometric Brownian Motion (H = 0.5) and Mean Reverting / Contrarian (H < 0.5). In my interpretation this can be used as a trend filter that eliminates market noise.
We utilize the trending and mean reverting based states, as extra conditions required for valid trades for both strategy types respectively, in the process increasing our trade entry quality.
🔷 Example model Architecture:
Here is an example of one configuration of this strategy, combining all aspects discussed in this post.
Future Updates
- Automation integration (next update)

Rsi Long-Term Strategy [15min]Hello, I would like to present to you The "RSI Long-Term Strategy" for 15min tf
The "RSI Long-Term Strategy " is designed for traders who prefer a combination of momentum and trend-following techniques. The strategy focuses on entering long positions during significant market corrections within an overall uptrend, confirmed by both RSI and volume. The use of long-term SMAs ensures that trades are made in line with the broader market trend. The stop-loss feature provides risk management by limiting losses on trades that do not perform as expected. This strategy is particularly well-suited for longer-term traders who monitor 15-minute charts but look for substantial trend reversals or continuations.
Indicators and Parameters:
Relative Strength Index (RSI):
- The RSI is calculated using a 10-period length. It measures the magnitude of recent price changes to evaluate overbought or oversold conditions. The script defines oversold conditions when the RSI is at or below 30 and overbought conditions when the RSI is at or above 70.
Volume Condition:
-The strategy incorporates a volume condition where the current volume must be greater than 2.5 times the 20-period moving average of volume. This is used to confirm the strength of the price movement.
Simple Moving Averages (SMA):
- The strategy uses two SMAs: SMA1 with a length of 250 periods and SMA2 with a length of 500 periods. These SMAs help identify long-term trends and generate signals based on their crossover.
Strategy Logic:
Entry Logic:
A long position is initiated when all the following conditions are met:
The RSI indicates an oversold condition (RSI ≤ 30).
SMA1 is above SMA2, indicating an uptrend.
The volume condition is satisfied, confirming the strength of the signal.
Exit Logic:
The strategy closes the long position when SMA1 crosses under SMA2, signaling a potential end of the uptrend (a "Death Cross").
Stop-Loss:
A stop-loss is set at 5% below the entry price to manage risk and limit potential losses.
Buy and sell signals are highlighted with circles below or above bars:
Green Circle : Buy signal when RSI is oversold, SMA1 > SMA2, and the volume condition is met.
Red Circle : Sell signal when RSI is overbought, SMA1 < SMA2, and the volume condition is met.
Black Cross: "Death Cross" when SMA1 crosses under SMA2, indicating a potential bearish signal.
to determine the level of stop loss and target point I used a piece of code by RafaelZioni, here is the script from which a piece of code was taken
I hope the strategy will be helpful, as always, best regards and safe trades
;)

Multi-Factor StrategyThis trading strategy combines multiple technical indicators to create a systematic approach for entering and exiting trades. The goal is to capture trends by aligning several key indicators to confirm the direction and strength of a potential trade. Below is a detailed description of how the strategy works:
Indicators Used
MACD (Moving Average Convergence Divergence):
MACD Line: The difference between the 12-period and 26-period Exponential Moving Averages (EMAs).
Signal Line: A 9-period EMA of the MACD line.
Usage: The strategy looks for crossovers between the MACD line and the Signal line as entry signals. A bullish crossover (MACD line crossing above the Signal line) indicates a potential upward movement, while a bearish crossover (MACD line crossing below the Signal line) signals a potential downward movement.
RSI (Relative Strength Index):
Usage: RSI is used to gauge the momentum of the price movement. The strategy uses specific thresholds: below 70 for long positions to avoid overbought conditions and above 30 for short positions to avoid oversold conditions.
ATR (Average True Range):
Usage: ATR measures market volatility and is used to set dynamic stop-loss and take-profit levels. A stop loss is set at 2 times the ATR, and a take profit at 3 times the ATR, ensuring that risk is managed relative to market conditions.
Simple Moving Averages (SMA):
50-day SMA: A short-term trend indicator.
200-day SMA: A long-term trend indicator.
Usage: The strategy uses the relationship between the 50-day and 200-day SMAs to determine the overall market trend. Long positions are taken when the price is above the 50-day SMA and the 50-day SMA is above the 200-day SMA, indicating an uptrend. Conversely, short positions are taken when the price is below the 50-day SMA and the 50-day SMA is below the 200-day SMA, indicating a downtrend.
Entry Conditions
Long Position:
-MACD Crossover: The MACD line crosses above the Signal line.
-RSI Confirmation: RSI is below 70, ensuring the asset is not overbought.
-SMA Confirmation: The price is above the 50-day SMA, and the 50-day SMA is above the 200-day SMA, indicating a strong uptrend.
Short Position:
MACD Crossunder: The MACD line crosses below the Signal line.
RSI Confirmation: RSI is above 30, ensuring the asset is not oversold.
SMA Confirmation: The price is below the 50-day SMA, and the 50-day SMA is below the 200-day SMA, indicating a strong downtrend.
Opposite conditions for shorts
Exit Strategy
Stop Loss: Set at 2 times the ATR from the entry price. This dynamically adjusts to market volatility, allowing for wider stops in volatile markets and tighter stops in calmer markets.
Take Profit: Set at 3 times the ATR from the entry price. This ensures a favorable risk-reward ratio of 1:1.5, aiming for higher rewards on successful trades.
Visualization
SMAs: The 50-day and 200-day SMAs are plotted on the chart to visualize the trend direction.
MACD Crossovers: Bullish and bearish MACD crossovers are highlighted on the chart to identify potential entry points.
Summary
This strategy is designed to align multiple indicators to increase the probability of successful trades by confirming trends and momentum before entering a position. It systematically manages risk with ATR-based stop loss and take profit levels, ensuring that trades are exited based on market conditions rather than arbitrary points. The combination of trend indicators (SMAs) with momentum and volatility indicators (MACD, RSI, ATR) creates a robust approach to trading in various market environments.

HMA Crossover 1H with RSI, Stochastic RSI, and Trailing StopThe strategy script provided is a trading algorithm designed to help traders make informed buy and sell decisions based on certain technical indicators. Here’s a breakdown of what each part of the script does and how the strategy works:
Key Components:
Hull Moving Averages (HMA):
HMA 5: This is a Hull Moving Average calculated over 5 periods. HMAs are used to smooth out price data and identify trends more quickly than traditional moving averages.
HMA 20: This is another HMA but calculated over 20 periods, providing a broader view of the trend.
Relative Strength Index (RSI):
RSI 14: This is a momentum oscillator that measures the speed and change of price movements over a 14-period timeframe. It helps identify overbought or oversold conditions in the market.
Stochastic RSI:
%K: This is the main line of the Stochastic RSI, which combines the RSI and the Stochastic Oscillator to provide a more sensitive measure of overbought and oversold conditions. It is smoothed with a 3-period simple moving average.
Trading Signals:
Buy Signal:
Generated when the 5-period HMA crosses above the 20-period HMA, indicating a potential upward trend.
Additionally, the RSI must be below 45, suggesting that the market is not overbought.
The Stochastic RSI %K must also be below 39, confirming the oversold condition.
Sell Signal:
Generated when the 5-period HMA crosses below the 20-period HMA, indicating a potential downward trend.
The RSI must be above 60, suggesting that the market is not oversold.
The Stochastic RSI %K must also be above 63, confirming the overbought condition.
Trailing Stop Loss:
This feature helps protect profits by automatically selling the position if the price moves against the trade by 5%.
For sell positions, an additional trailing stop of 100 points is included.

Advanced Gold Scalping Strategy with RSI Divergence# Advanced Gold Scalping Strategy with RSI Divergence
## Overview
This Pine Script implements an advanced scalping strategy for gold (XAUUSD) trading, primarily designed for the 1-minute timeframe. The strategy utilizes the Relative Strength Index (RSI) indicator along with its moving average to identify potential trade setups based on divergences between price action and RSI movements.
## Key Components
### 1. RSI Calculation
- Uses a customizable RSI length (default: 60)
- Allows selection of the source for RSI calculation (default: close price)
### 2. Moving Average of RSI
- Supports multiple MA types: SMA, EMA, SMMA (RMA), WMA, VWMA, and Bollinger Bands
- Customizable MA length (default: 3)
- Option to display Bollinger Bands with adjustable standard deviation multiplier
### 3. Divergence Detection
- Implements both bullish and bearish divergence identification
- Uses pivot high and pivot low points to detect divergences
- Allows for customization of lookback periods and range for divergence detection
### 4. Entry Conditions
- Long Entry: Bullish divergence when RSI is below 40
- Short Entry: Bearish divergence when RSI is above 60
### 5. Trade Management
- Stop Loss: Customizable, default set to 11 pips
- Take Profit: Customizable, default set to 33 pips
### 6. Visualization
- Plots RSI line and its moving average
- Displays horizontal lines at 30, 50, and 70 RSI levels
- Shows Bollinger Bands when selected
- Highlights divergences with "Bull" and "Bear" labels on the chart
## Input Parameters
- RSI Length: Adjusts the period for RSI calculation
- RSI Source: Selects the price source for RSI (close, open, high, low, hl2, hlc3, ohlc4)
- MA Type: Chooses the type of moving average applied to RSI
- MA Length: Sets the period for the moving average
- BB StdDev: Adjusts the standard deviation multiplier for Bollinger Bands
- Show Divergence: Toggles the display of divergence labels
- Stop Loss: Sets the stop loss distance in pips
- Take Profit: Sets the take profit distance in pips
## Strategy Logic
1. **RSI Calculation**:
- Computes RSI using the specified length and source
- Calculates the chosen type of moving average on the RSI
2. **Divergence Detection**:
- Identifies pivot points in both price and RSI
- Checks for higher lows in RSI with lower lows in price (bullish divergence)
- Checks for lower highs in RSI with higher highs in price (bearish divergence)
3. **Trade Entry**:
- Enters a long position when a bullish divergence is detected and RSI is below 40
- Enters a short position when a bearish divergence is detected and RSI is above 60
4. **Position Management**:
- Places a stop loss order at the entry price ± stop loss pips (depending on the direction)
- Sets a take profit order at the entry price ± take profit pips (depending on the direction)
5. **Visualization**:
- Plots the RSI and its moving average
- Draws horizontal lines for overbought/oversold levels
- Displays Bollinger Bands if selected
- Shows divergence labels on the chart for identified setups
## Usage Instructions
1. Apply the script to a 1-minute XAUUSD (Gold) chart in TradingView
2. Adjust the input parameters as needed:
- Increase RSI Length for less frequent but potentially more reliable signals
- Modify MA Type and Length to change the sensitivity of the RSI moving average
- Adjust Stop Loss and Take Profit levels based on current market volatility
3. Monitor the chart for Bull (long) and Bear (short) labels indicating potential trade setups
4. Use in conjunction with other analysis and risk management techniques
## Considerations
- This strategy is designed for short-term scalping and may not be suitable for all market conditions
- Always backtest and forward test the strategy before using it with real capital
- The effectiveness of divergence-based strategies can vary depending on market trends and volatility
- Consider using additional confirmation signals or filters to improve the strategy's performance
Remember to adapt the strategy parameters to your risk tolerance and trading style, and always practice proper risk management.

Korneev Reverse RSIRethinking the Legendary Relative Strength Index by John Welles Wilder
The essence of the new approach lies in the reverse use of the so-called "overbought" and "oversold" zones. In his 1978 book, "New Concepts in Technical Trading Systems," where the RSI mechanism was thoroughly described, Wilder writes that one way to use the oscillator is to open a long position when the RSI drops into oversold territory (below 30) and to open a short position when the RSI rises to overbought levels (above 70). However, backtesting this strategy with such inputs yields rather mediocre results.
Based on the calculation formula, the RSI calculates the rate of price change over a certain period. Therefore, overbought and oversold zones will have relative significance (relative to the set calculation period). It is no coincidence that the word "relative" was added to the name of the oscillator. It is worth accepting as an axiom the assertion that the price of an asset is fair at every moment in time.
Essentially, the RSI calculates the strength of a trend. If the oscillator value is above 70, it is highly likely that an upward movement is occurring in the market. Therefore, in the current strategy, a long position is opened precisely at the moment of greatest buyer strength (when RSI > 80), i.e., in the direction of the trend, since counter-trend trading with the RSI has proven to be ineffective. The position is closed after the buyers lose their advantage and the RSI drops to 40.
The strategy is recommended to be used only with long positions, as short positions show negative results. The strategy uses a moving average for the RSI with a period of 14 to smooth the oscillator data.
--------------------------------------------------------------------------------------------
Переосмысление легендарного осциллятора Relative strength index Джона Уэллса Уайлдера
Суть нового подхода заключается в реверсивном использовании так называемых зон "перекупленности" и "перепроданности". В своей книге от 1978 года "New concepts in tecnical trading systems", в которой был подробно описан механизм работы RSI, Уайлдер пишет, что один из способов использования осциллятора - открытие длинной позиции при снижении RSI в перепроданность (ниже 30) и открытие короткой позиции при повышении RSI до перекупленности (выше 70). Однако бэктест стратегии с такими вводными дает весьма посредственные результаты.
Исходя из формулы расчета, RSI рассчитывает скорость изменения цены за определенный период. Поэтому зоны перекупленности и перепроданности будут иметь относительное значение (относительно установленного периода расчета). Не зря ведь в названии осциллятора было добавлено слово "относительной". Стоит принять за аксиому утверждение, что цена актива справедлива в каждый момент времени.
По сути, RSI рассчитывает силу тренда. Если значение осциллятора выше 70, то на рынке с высокой долей вероятности происходит восходящее движение. Поэтому в текущей стратегии открытие лонга происходит именно в момент наибольшей силы покупателей (когда RSI > 80), то есть в сторону тренда, поскольку контртрендовая торговля по RSI показала свою несостоятельность. Закрытие позиции происходит после того, как покупатели теряют преимущество и RSI снижается до 40.
Стратегию рекомендуется использовать только с длинными позициями, поскольку короткие позиции показывают отрицательный результат. В стратегии используется скользящая средняя для RSI с периодом 14 для сглаживания данных осциллятора.

Triple EMA + QQE Trend Following Strategy [TradeDots]The "Triple EMA + QQE Trend Following Strategy" harnesses the power of two sophisticated technical indicators, the Triple Exponential Moving Average (TEMA) and the Qualitative Quantitative Estimation (QQE), to generate precise buy and sell signals. This strategy excels in capturing shifts in trends by identifying short-term price momentum and dynamic overbought or oversold conditions.
HOW IT WORKS
This strategy integrates two pivotal indicators:
Triple Exponential Moving Average (TEMA): TEMA enhances traditional moving averages by reducing lag and smoothing the data more effectively. It achieves this by applying the EMA formula three times onto the price, as follows:
tema(src, length) =>
ema1 = ta.ema(src, length)
ema2 = ta.ema(ema1, length)
ema3 = ta.ema(ema2, length)
tema = 3*ema1 - 3*ema2 + ema3
This computation helps to sharpen the sensitivity to price movements.
Qualitative Quantitative Estimation (QQE): The QQE indicator improves upon the standard RSI by incorporating a smoothing mechanism. It starts with the standard RSI, overlays a 5-period EMA on this RSI, and then enhances the result using a double application of a 27-period EMA. A slow trailing line is then derived by multiplying the result with a factor number. This approach establishes a more refined and less jittery trend-following signal, complementing the TEMA to enhance overall market timing during fluctuating conditions.
APPLICATION
Referenced from insights on "Trading Tact," the strategy implementation follows:
First of all, we utilize two TEMA lines: one set at a 20-period and the other at a 40-period. Then following the rules below:
40-period TEMA is rising
20-period TEMA is above 40-period TEMA
Price closes above 20-period TEMA
Today is not Monday
RSI MA crosses the Slow trailing line
This strategy does not employ an active take profit mechanism; instead, it utilizes a trailing stop loss to allow the price to reach the stop loss naturally, thereby maximizing potential profit margins.
DEFAULT SETUP
Commission: 0.01%
Initial Capital: $10,000
Equity per Trade: 80%
Users are advised to adjust and personalize this trading strategy to better match their individual trading preferences and style.
RISK DISCLAIMER
Trading entails substantial risk, and most day traders incur losses. All content, tools, scripts, articles, and education provided by TradeDots serve purely informational and educational purposes. Past performances are not definitive predictors of future results.
Reference:
Trading Tact. What Is the QQE Indicator? Retrieved from: tradingtact.com

Dual RSI Differential - Strategy [presentTrading]█ Introduction and How it is Different
The Dual RSI Differential Strategy introduces a nuanced approach to market analysis and trading decisions by utilizing two Relative Strength Index (RSI) indicators calculated over different time periods. Unlike traditional strategies that employ a single RSI and may signal premature or delayed entries, this method leverages the differential between a shorter and a longer RSI. This approach pinpoints more precise entry and exit points, providing a refined tool for traders to exploit market conditions effectively, particularly in overbought and oversold scenarios.
Most important: it is a good eductional code for swing trading.
For beginners, this Pine Script provides a complete function that includes crucial elements such as holding days and the option to configure take profit/stop loss settings:
- Hold Days: This feature ensures that trades are not exited too hastily, helping traders to ride out short-term market volatility. It's particularly valuable for swing trading where maintaining positions slightly longer can lead to capturing significant trends.
- TPSL Condition (None by default): This setting allows traders to focus solely on the strategy's robust entry and exit signals without being constrained by preset profit or loss limits. This flexibility is crucial for learning to adjust strategy settings based on personal risk tolerance and market observations.
BTCUSD 6h LS Performance
█ Strategy, How It Works: Detailed Explanation
🔶 RSI Calculation:
The RSI is a momentum oscillator that measures the speed and change of price movements. It is calculated using the formula:
RSI = 100 - (100 / (1 + RS))
Where RS (Relative Strength) = Average Gain of up periods / Average Loss of down periods.
🔶 Dual RSI Setup:
This strategy involves two RSI indicators:
RSI_Short (RSI_21): Calculated over a short period (21 days).
RSI_Long (RSI_42): Calculated over a longer period (42 days).
Differential Calculation:
The strategy focuses on the differential between these two RSIs:
RSI Differential = RSI_Long - RSI_Short
This differential helps to identify when the shorter-term sentiment diverges from longer-term trends, signaling potential trading opportunities.
BTCUSD Local picuture
🔶 Signal Triggers:
Entry Signal: A buy (long) signal is triggered when the RSI Differential exceeds -5, suggesting strengthening short-term momentum. Conversely, a sell (short) signal occurs when the RSI Differential falls below +5, indicating weakening short-term momentum.
Exit Signal: Trades are generally exited when the RSI Differential reverses past these thresholds, indicating a potential momentum shift.
█ Trade Direction
This strategy accommodates various trading preferences by allowing selections among long, short, or both directions, thus enabling traders to capitalize on diverse market movements and volatility.
█ Usage
The Dual RSI Differential Strategy is particularly suited for:
Traders who prefer a systematic approach to capture market trends.
Those who seek to minimize risks associated with rapid and unexpected market movements.
Traders who value strategies that can be finely tuned to different market conditions.
█ Default Settings
- Trading Direction: Both — allows capturing of upward and downward market movements.
- Short RSI Period: 21 days — balances sensitivity to market movements.
- Long RSI Period: 42 days — smoothens out longer-term fluctuations to provide a clearer market trend.
- RSI Difference Level: 5 — minimizes false signals by setting a moderate threshold for action.
Use Hold Days: True — introduces a temporal element to trading strategy, holding positions to potentially enhance outcomes.
- Hold Days: 5 — ensures that trades are not exited too hastily, helping to ride out short-term volatility.
- TPSL Condition: None — enables traders to focus solely on the strategy's entry and exit signals without preset profit or loss limits.
- Take Profit Percentage: 15% — aims for significant market moves to lock in profits.
- Stop Loss Percentage: 10% — safeguards against large losses, essential for long-term capital preservation.

Multi Timeframe RSI Buy Sell Strategy [TradeDots]The "Multi Timeframe RSI Buy/Sell Strategy" is a trading strategy that utilizes Relative Strength Index (RSI) indicators from multiple timeframes to provide buy and sell signals.
This strategy allows for extensive customization, supporting up to three distinct RSIs, each configurable with its own timeframe, length, and data source.
HOW DOES IT WORK
This strategy integrates up to three RSIs, each selectable from different timeframes and customizable in terms of length and source. Users have the flexibility to define the number of active RSIs. These selections visualize as plotted lines on the chart, enhancing interpretability.
Users can also manage the moving average of the selected RSI lines. When multiple RSIs are active, the moving average is calculated based on these active lines' average value.
The color intensity of the moving average line changes as it approaches predefined buying or selling thresholds, alerting users to potential signal generation.
A buy or sell signal is generated when all active RSI lines simultaneously cross their respective threshold lines. Concurrently, a label will appear on the chart to signify the order placement.
For those preferring not to display order information or activate the strategy, an "Enable backtest" option is provided in the settings for toggling activation.
APPLICATION
The strategy leverages multiple RSIs to detect extreme market conditions across various timeframes without the need for manual timeframe switching.
This feature is invaluable for identifying divergences across timeframes, such as detecting potential short-term reversals within broader trends, thereby aiding traders in making better trading decisions and potentially avoiding losses.
DEFAULT SETUP
Commission: 0.01%
Initial Capital: $10,000
Equity per Trade: 60%
RISK DISCLAIMER
Trading entails substantial risk, and most day traders incur losses. All content, tools, scripts, articles, and education provided by TradeDots serve purely informational and educational purposes. Past performances are not definitive predictors of future results.
TradeDots Stochastic Z-Score

RSI Strategy with Manual TP and SL 19/03/2024This TradingView script implements a simple RSI (Relative Strength Index) strategy with manual take profit (TP) and stop-loss (SL) levels. Let's break down the script and analyze its components:
RSI Calculation: The script calculates the RSI using the specified length parameter. RSI is a momentum oscillator that measures the speed and change of price movements. It ranges from 0 to 100 and typically values above 70 indicate overbought conditions while values below 30 indicate oversold conditions.
Strategy Parameters:
length: Length of the RSI period.
overSold: Threshold for oversold condition.
overBought: Threshold for overbought condition.
trail_profit_pct: Percentage for trailing profit.
Entry Conditions:
For a long position: RSI crosses above 30 and the daily close is above 70% of the highest close in the last 50 bars.
For a short position: RSI crosses below 70 and the daily close is below 130% of the lowest close in the last 50 bars.
Entry Signals:
Long entry is signaled when both conditions for a long position are met.
Short entry is signaled when both conditions for a short position are met.
Manual TP and SL:
Take profit and stop-loss levels are calculated based on the entry price and the specified percentage.
For long positions, the take profit level is set above the entry price and the stop-loss level is set below the entry price.
For short positions, the take profit level is set below the entry price and the stop-loss level is set above the entry price.
Strategy Exits:
Exit conditions are defined for both long and short positions using the calculated take profit and stop-loss levels.
Chart Analysis:
This strategy aims to capitalize on short-term momentum shifts indicated by RSI crossings combined with daily price movements.
It utilizes manual TP and SL levels, providing traders with flexibility in managing their positions.
The strategy may perform well in ranging or oscillating markets where RSI signals are more reliable.
However, it may encounter challenges in trending markets where RSI can remain overbought or oversold for extended periods.
Traders should backtest this strategy thoroughly on historical data and consider optimizing parameters to suit different market conditions.
Risk management is crucial, so traders should carefully adjust TP and SL percentages based on their risk tolerance and market volatility.
Overall, this strategy provides a structured approach to trading based on RSI signals while allowing traders to customize their risk management. However, like any trading strategy, it should be used judiciously and in conjunction with other forms of analysis and risk management techniques.

TTP Intelligent AccumulatorThe intelligent accumulator is a proof of concept strategy. A hybrid between a recurring buy and TA-based entries and exits.
Distribute the amount of equity and add to your position as long as the TA condition is valid.
Use the exit TA condition to define your exit strategy.
Decide between adding only into losing positions to average down or take a riskier approach by allowing to add into a winning position as well.
Take full profit or distribute your exit into multiple take profit exists of the same size.
You can also decide if you allow your exit conditions to close your position in a loss or require a minimum take profit %.
The strategy includes a default built-in TA conditions just for showcasing the idea but the final intent of this script is to delegate the TA entries and exists to external sources.
The internal conditions use RSI length 7 crossing below the BB with std 1 for entries and above for exits.
To control the number of orders use the properties from settings:
- adjust the pyramiding
- adjust the percentage of equity
- make sure that pyramiding * % equity equals 100 to prevent over use of equity (unless using leverage)
The script is designed as an alternative to daily or weekly recurring buys but depending on the accuracy of your TA conditions it might prove profitable also in lower timeframes.
The reason the script is named Intelligent is because recurring buy is most commonly used without any decision making: buy no matter what with certain frequency. This strategy seeks to still perform recurring buys but filtering out some of the potential bad entries that can delay unnecessarily seeing the position in profits. The second reason is also securing an exit strategy from the beginning which no recurring buy option offers out-of-the-box.

PresentTrend RMI Synergy - Strategy [presentTrading] █ Introduction and How it is Different
The "PresentTrend RMI Synergy Strategy" is the combined power of the Relative Momentum Index (RMI) and a custom presentTrend indicator. This strategy introduces a multifaceted approach, integrating momentum analysis with trend direction to offer traders a more nuanced and responsive trading mechanism.
BTCUSD 6h L/S Performance
Local
█ Strategy, How It Works: Detailed Explanation
The "PresentTrend RMI Synergy Strategy" intricately combines the Relative Momentum Index (RMI) and a custom SuperTrend indicator to create a powerful tool for traders.
🔶 Relative Momentum Index (RMI)
The RMI is a variation of the Relative Strength Index (RSI), but instead of using price closes against itself, it measures the momentum of up and down movements in price relative to previous prices over a given period. The RMI for a period length `N` is calculated as follows:
RMI = 100 - 100/ (1 + U/D)
where:
- `U` is the average upward price change over `N` periods,
- `D` is the average downward price change over `N` periods.
The RMI oscillates between 0 and 100, with higher values indicating stronger upward momentum and lower values suggesting stronger downward momentum.
RMI = 21
RMI = 42
For more information - RMI Trend Sync - Strategy :
🔶 presentTrend Indicator
The presentTrend indicator combines the Average True Range (ATR) with a moving average to determine trend direction and dynamic support or resistance levels. The presentTrend for a period length `M` and a multiplier `F` is defined as:
- Upper Band: MA + (ATR x F)
- Lower Band: MA - (ATR x F)
where:
- `MA` is the moving average of the close price over `M` periods,
- `ATR` is the Average True Range over the same period,
- `F` is the multiplier to adjust the sensitivity.
The trend direction switches when the price crosses the presentTrend bands, signaling potential entry or exit points.
presentTrend length = 3
presentTrend length = 10
For more information - PresentTrend - Strategy :
🔶 Strategy Logic
Entry Conditions:
- Long Entry: Triggered when the RMI exceeds a threshold, say 60, indicating a strong bullish momentum, and when the price is above the presentTrend, confirming an uptrend.
- Short Entry: Occurs when the RMI drops below a threshold, say 40, showing strong bearish momentum, and the price is below the present trend, indicating a downtrend.
Exit Conditions with Dynamic Trailing Stop:
- Long Exit: Initiated when the price crosses below the lower presentTrend band or when the RMI falls back towards a neutral level, suggesting a weakening of the bullish momentum.
- Short Exit: Executed when the price crosses above the upper presentTrend band or when the RMI rises towards a neutral level, indicating a reduction in bearish momentum.
Equations for Dynamic Trailing Stop:
- For Long Positions: The exit price is set at the lower SuperTrend band once the entry condition is met.
- For Short Positions: The exit price is determined by the upper SuperTrend band post-entry.
These dynamic trailing stops adjust as the market moves, providing a method to lock in profits while allowing room for the position to grow.
This strategy's strength lies in its dual analysis approach, leveraging RMI for momentum insights and presentTrend for trend direction and dynamic stops. This combination offers traders a robust framework to navigate various market conditions, aiming to capture trends early and exit positions strategically to maximize gains and minimize losses.
█ Trade Direction
The strategy provides flexibility in trade direction selection, offering "Long," "Short," or "Both" options to cater to different market conditions and trader preferences. This adaptability ensures that traders can align the strategy with their market outlook, risk tolerance, and trading goals.
█ Usage
To utilize the "PresentTrend RMI Synergy Strategy," traders should input their preferred settings in the Pine Script™ and apply the strategy to their charts. Monitoring RMI for momentum shifts and adjusting positions based on SuperTrend signals can optimize entry and exit points, enhancing potential returns while managing risk.
█ Default Settings
1. RMI Length: 21
The 21-period RMI length strikes a balance between capturing momentum and filtering out market noise, offering a medium-term outlook on market trends.
2. Super Trend Length: 7
A SuperTrend length of 7 periods is chosen for its responsiveness to price movements, providing a dynamic framework for trend identification without excessive sensitivity.
3. Super Trend Multiplier: 4.0
The multiplier of 4.0 for the SuperTrend indicator widens the trend bands, focusing on significant market moves and reducing the impact of minor fluctuations.
---
The "PresentTrend RMI Synergy Strategy" represents a significant step forward in trading strategy development, blending momentum and trend analysis in a unique way. By providing a detailed framework for understanding market dynamics, this strategy empowers traders to make more informed decisions.

RSI & Backed-Weighted MA StrategyRSI & MA Strategy :
INTRODUCTION :
This strategy is based on two well-known indicators that work best together: the Relative Strength Index (RSI) and the Moving Average (MA). We're going to use the RSI as a trend-follower indicator, rather than a reversal indicator as most are used to. To the signals sent by the RSI, we'll add a condition on the chart's MA, filtering out irrelevant signals and considerably increasing our winning rate. This is a medium/long-term strategy. There's also a money management method enabling us to reinvest part of the profits or reduce the size of orders in the event of substantial losses.
RSI :
The RSI is one of the best-known and most widely used indicators in trading. Its purpose is to warn traders when an asset is overbought or oversold. It was designed to send reversal signals, but we're going to use it as a trend indicator by increasing its length to 20. The RSI formula is as follows :
RSI (n) = 100 - (100 / (1 + (H (n)/L (n))))
With n the length of the RSI, H(n) the average of days closing above the open and L(n) the average of days closing below the open.
MA :
The Moving Average is also widely used in technical analysis, to smooth out variations in an asset. The SMA formula is as follows :
SMA (n) = (P1 + P2 + ... + Pn) / n
where n is the length of the MA.
However, an SMA does not weight any of its terms, which means that the price 10 days ago has the same importance as the price 2 days ago or today's price... That's why in this strategy we use a RWMA, i.e. a back-weighted moving average. It weights old prices more heavily than new ones. This will enable us to limit the impact of short-term variations and focus on the trend that was dominating. The RWMA used weights :
The 4 most recent terms by : 100 / (4+(n-4)*1.30)
The other oldest terms by : weight_4_first_term*1.30
So the older terms are weighted 1.30 more than the more recent ones. The moving average thus traces a trend that accentuates past values and limits the noise of short-term variations.
PARAMETERS :
RSI Length : Lenght of RSI. Default is 20.
MA Type : Choice between a SMA or a RWMA which permits to minimize the impact of short term reversal. Default is RWMA.
MA Length : Length of the selected MA. Default is 19.
RSI Long Signal : Minimum value of RSI to send a LONG signal. Default is 60.
RSI Short signal : Maximum value of RSI to send a SHORT signal. Default is 40.
ROC MA Long Signal : Maximum value of Rate of Change MA to send a LONG signal. Default is 0.
ROC MA Short signal : Minimum value of Rate of Change MA to send a SHORT signal. Default is 0.
TP activation in multiple of ATR : Threshold value to trigger trailing stop Take Profit. This threshold is calculated as multiple of the ATR (Average True Range). Default value is 5 meaning that to trigger the trailing TP the price need to move 5*ATR in the right direction.
Trailing TP in percentage : Percentage value of trailing Take Profit. This Trailing TP follows the profit if it increases, remaining selected percentage below it, but stops if the profit decreases. Default is 3%.
Fixed Ratio : This is the amount of gain or loss at which the order quantity is changed. Default is 400, which means that for each $400 gain or loss, the order size is increased or decreased by a user-selected amount.
Increasing Order Amount : This is the amount to be added to or subtracted from orders when the fixed ratio is reached. The default is $200, which means that for every $400 gain, $200 is reinvested in the strategy. On the other hand, for every $400 loss, the order size is reduced by $200.
Initial capital : $1000
Fees : Interactive Broker fees apply to this strategy. They are set at 0.18% of the trade value.
Slippage : 3 ticks or $0.03 per trade. Corresponds to the latency time between the moment the signal is received and the moment the order is executed by the broker.
Important : A bot has been used to test the different parameters and determine which ones maximize return while limiting drawdown. This strategy is the most optimal on BITSTAMP:ETHUSD with a timeframe set to 6h. Parameters are set as follows :
MA type: RWMA
MA Length: 19
RSI Long Signal: >60
RSI Short Signal : <40
ROC MA Long Signal : <0
ROC MA Short Signal : >0
TP Activation in multiple ATR : 5
Trailing TP in percentage : 3
ENTER RULES :
The principle is very simple:
If the asset is overbought after a bear market, we are LONG.
If the asset is oversold after a bull market, we are SHORT.
We have defined a bear market as follows : Rate of Change (20) RWMA < 0
We have defined a bull market as follows : Rate of Change (20) RWMA > 0
The Rate of Change is calculated using this formula : (RWMA/RWMA(20) - 1)*100
Overbought is defined as follows : RSI > 60
Oversold is defined as follows : RSI < 40
LONG CONDITION :
RSI > 60 and (RWMA/RWMA(20) - 1)*100 < -1
SHORT CONDITION :
RSI < 40 and (RWMA/RWMA(20) - 1)*100 > 1
EXIT RULES FOR WINNING TRADE :
We have a trailing TP allowing us to exit once the price has reached the "TP Activation in multiple ATR" parameter, i.e. 5*ATR by default in the profit direction. TP trailing is triggered at this point, not limiting our gains, and securing our profits at 3% below this trigger threshold.
Remember that the True Range is : maximum(H-L, H-C(1), C-L(1))
with C : Close, H : High, L : Low
The Average True Range is therefore the average of these TRs over a length defined by default in the strategy, i.e. 20.
RISK MANAGEMENT :
This strategy may incur losses. The method for limiting losses is to set a Stop Loss equal to 3*ATR. This means that if the price moves against our position and reaches three times the ATR, we exit with a loss.
Sometimes the ATR can result in a SL set below 10% of the trade value, which is not acceptable. In this case, we set the SL at 10%, limiting losses to a maximum of 10%.
MONEY MANAGEMENT :
The fixed ratio method was used to manage our gains and losses. For each gain of an amount equal to the value of the fixed ratio, we increase the order size by a value defined by the user in the "Increasing order amount" parameter. Similarly, each time we lose an amount equal to the value of the fixed ratio, we decrease the order size by the same user-defined value. This strategy increases both performance and drawdown.
Enjoy the strategy and don't forget to take the trade :)

EUR/USD 45 MIN Strategy - FinexBOTThis strategy uses three indicators:
RSI (Relative Strength Index) - It indicates if a stock is potentially overbought or oversold.
CCI (Commodity Channel Index) - It measures the current price level relative to an average price level over a certain period of time.
Williams %R - It is a momentum indicator that shows whether a stock is at the high or low end of its trading range.
Long (Buy) Trades Open:
When all three indicators suggest that the stock is oversold (RSI is below 25, CCI is below -130, and Williams %R is below -85), the strategy will open a buy position, assuming there is no current open trade.
Short (Sell) Trades Open:
When all three indicators suggest the stock is overbought (RSI is above 75, CCI is above 130, and Williams %R is above -15), the strategy will open a sell position, assuming there is no current open trade.
SL (Stop Loss) and TP (Take Profit):
SL (Stop Loss) is 0.45%.
TP (Take Profit) is 1.2%.
The strategy automatically sets these exit points as a percentage of the entry price for both long and short positions to manage risks and secure profits. You can easily adopt these inputs according to your strategy. However, default settings are recommended.

YinYang RSI Volume Trend StrategyThere are many strategies that use RSI or Volume but very few that take advantage of how useful and important the two of them combined are. This strategy uses the Highs and Lows with Volume and RSI weighted calculations on top of them. You may be wondering how much of an impact Volume and RSI can have on the prices; the answer is a lot and we will discuss those with plenty of examples below, but first…
How does this strategy work?
It’s simple really, when the purchase source crosses above the inner low band (red) it creates a Buy or Long. This long has a Trailing Stop Loss band (the outer low band that's also red) that can be adjusted in the Settings. The Stop Loss is based on a % of the inner low band’s price and by default it is 0.1% lower than the inner band’s price. This Stop Loss is not only a stop loss but it can also act as a Purchase Available location.
You can get back into a trade after a stop loss / take profit has been hit when your Reset Purchase Availability After condition has been met. This can either be at Stop Loss, Entry or None.
It is advised to allow it to reset in case the stop loss was a fake out but the call was right. Sometimes it may trigger stop loss multiple times in a row, but you don’t lose much on stop loss and you gain lots when the call is right.
The Take Profit location is the basis line (white). Take Profit occurs when the Exit Source (close, open, high, low or other) crosses the basis line and then on a different bar the Exit Source crosses back over the basis line. For example, if it was a Long and the bar’s Exit Source closed above the basis line, and then 2 bars later its Exit Source closed below the basis line, Take Profit would occur. You can disable Take Profit in Settings, but it is very useful as many times the price will cross the Basis and then correct back rather than making it all the way to the opposing zone.
Longs:
If for instance your Long doesn’t need to Take Profit and instead reaches the top zone, it will close the position when it crosses above the inner top line (green).
Please note you can change the Exit Source too which is what source (close, open, high, low) it uses to end the trades.
The Shorts work the same way as the Long but just opposite, they start when the purchase source crosses under the inner upper band (green).
Shorts:
Shorts take profit when it crosses under the basis line and then crosses back.
Shorts will Stop loss when their outer upper band (green) is crossed with the Exit Source.
Short trades are completed and closed when its Exit Source crosses under the inner low red band.
So, now that you understand how the strategy works, let’s discuss why this strategy works and how it is profitable.
First we will discuss Volume as we deem it plays a much bigger role overall and in our strategy:
As I’m sure many of you know, Volume plays a huge factor in how much something moves, but it also plays a role in the strength of the movement. For instance, let’s look at two scenarios:
Bitcoin’s price goes up $1000 in 1 Day but the Volume was only 10 million
Bitcoin’s price goes up $200 in 1 Day but the Volume was 40 million
If you were to only look at the price, you’d say #1 was more important because the price moved x5 the amount as #2, but once you factor in the volume, you know this is not true. The reason why Volume plays such a huge role in Price movement is because it shows there is a large Limit Order battle going on. It means that both Bears and Bulls believe that price is a good time to Buy and Sell. This creates a strong Support and Resistance price point in this location. If we look at scenario #2, when there is high volume, especially if it is drastically larger than the average volume Bitcoin was displaying recently, what can we decipher from this? Well, the biggest take away is that the Bull’s won the battle, and that likely when that happens we will see bullish movement continuing to happen as most of the Bears Limit Orders have been fulfilled. Whereas with #2, when large price movement happens and Bitcoin goes up $1000 with low volume what can we deduce? The main takeaway is that Bull’s pressured the price up with Market Orders where they purchased the best available price, also what this means is there were very few people who were wanting to sell. This generally dictates that Whale Limit orders for Sells/Shorts are much higher up and theres room for movement, but it also means there is likely a whale that is ready to dump and crash it back down.
You may be wondering, what did this example have to do with YinYang RSI Volume Trend Strategy? Well the reason we’ve discussed this is because we use Volume multiple times to apply multiplications in our calculations to add large weight to the price when there is lots of volume (this is applied both positively and negatively). For instance, if the price drops a little and there is high volume, our strategy will move its bounds MUCH lower than the price actually dropped, and if there was low volume but the price dropped A LOT, our strategy will only move its bounds a little. We believe this reflects higher levels of price accuracy than just price alone based on the examples described above.
Don’t believe us?
Here is with Volume NOT factored in (VWMA = SMA and we remove our Volume Filter calculation):
Which produced -$2880 Profit
Here is with our Volume factored in:
Which produced $553,000 (55.3%)
As you can see, we wen’t from $-2800 profit with volume not factored to $553,000 with volume factored. That's quite a big difference! (Please note previous success does not predict future success we are simply displaying the $ amounts as example).
Now how about RSI and why does it matter in this strategy?
As I’m sure most of you are aware, RSI is one of the leading indicators used in trading. For this reason we figured it would only make sense to incorporate it into our calculations. We fiddled with RSI for quite awhile and sometimes what logically seems to be the right way to use it isn’t. Now, because of this, our RSI calculation is a little odd, but basically what we’re doing is we calculate the RSI, then turn it into a percentage (between 0-1) that can easily be multiplied to the price point we need. The price point we use is the difference between our high purchase zone and our low purchase zone. This allows us to see how much price movement there is between zones. We multiply our zone size with our RSI multiplication and we get the amount we will add +/- to our basis line (white line). This officially creates the NEW high and low purchase zones that we are actually using and displaying in our trades.
If you found that confusing, here are some examples to why it is an important calculation for this strategy:
Before RSI factored in:
Which produced 27.8% Profit
After RSI factored in:
Which produced 553% Profit
As you can see, the RSI makes not only the purchase zones more accurate, but it also greatly increases the profit the strategy is able to make. It also helps ensure an relatively linear profit slope so you know it is reliable with its trades.
This strategy can work on pretty much anything, but you should tweak the values a bit for each pair you are trading it with for best results.
We hope you can find some use out of this simple but effective strategy, if you have any questions, comments or concerns please let us know.
HAPPY TRADING!

Bullish Divergence Short-term Long Trade FinderThis script is a Bullish divergence trade finder built to find small periods where Bitcoin will likely rise from. It looks for bullish divergence followed by a higher low as long as the hour RSI value is below the 40 mark, if then it will enter an long. It marks out Buy signals on the RSI if the value dips below 'RSI Bull Condition Minimum' (Default 40) on the current time frame in view. It also marks out Sell signals found when the RSI is above the 'RSI Bearish Condition Minimum' (Default 50). The sell signals are bearish divergence that has occurred recently on the RSI. When a long is in play it will sell if it finds bearish divergence or the time frame in view reaches RSI value higher than the 'RSI Sell Value'(Default 75). You can set your stop loss value with the 'Stop loss Percentage' (default 5).
Available inputs:
RSI Period: relative strength measurement length(Typically 14)
RSI Oversold Level: the bottom bar of the RSI (Typically 30)
RSI Overbought Level: the top bar of the RSI (Typically 70)
RSI Bearish Condition Minimum: The minimum value the script will use to look for a pivot high that starts the Bearish condition to Sell (Default 50)
RSI Bearish Condition Sell Min: the minimum value the script will accept a bearish condition (Default 60)
RSI Bull Condition Minimum: the minimum value it will consider a pivot low value in the RSI to find a divergence buy (Default 40)
Look Back this many candles: the amount of candles thee script will look back to find a low value in the RSI (Default 25)
RSI Sell Value: The RSI value of the exit condition for a long when value is reached (Default 75)
Stop loss Percentage: Percentage value for amount to lose (Default 5)
The formula to enter a long is stated below:
If price finds a lower low and there is a higher low found following a lower low and price has just made another dip and price closes lower than the last divergence and Relative strength index hour value is less than 40 enter a long.
The formula to exit a long is stated below:
If the value drops below the stop loss percentage OR (the RSI value is greater than the value of the parameter 'RSI Sell Value' or bearish divergence is found greater than the parameter 'RSI Bearish Condition Minimum' )
This script was built from much strategy testing on BTC but works with alts (occasionally) also. It is most successful to my knowledge using the 15 min and 7 min time frames with default values. Hope it helps! Follow for further possible updates to this script or other entry or exit strategies.
snapshot:
I only have a Pro trading view account so I cannot share a larger data set about this script because the buy signals happen pretty rarely. The most amount that I could find within a view for me was 40 trades within a viewable time. The suggested/default parameters that I have do not occur very often so it limits the data set. Adjustments can be made to the parameters so that trades can be entered more often. The scripts success is dependent on the values of the parameters set by the user. This script was written to be used for BTC/USD or BTC/USDT trading. I am unable to share a larger dataset without putting out results that are intended to fail or having a premium account so reaching the 100 trade minimum is not possible with my account.

Good Mode RSI v2► Description:
"Good Mode RSI v2" is a powerful trading strategy designed to provide informed trading decisions. This script utilizes the popular RSI (Relative Strength Index) indicator to identify potential buying and selling opportunities in the market. It goes beyond the traditional use of RSI by incorporating carefully selected parameters to enhance its effectiveness. The strategy stands out for its customized combination of RSI levels and stop-loss/take-profit thresholds, allowing for precise trade entries and exits while effectively managing risk.
► How to Use:
To utilize the "Good Mode RSI v2" strategy, follow these steps:
1. Apply the script to your desired trading instrument and timeframe in TradingView.
2. Monitor the chart for trade signals generated by the strategy.
3. When the RSI reaches the sell level of 96, a sell signal is generated. Consider placing a sell order to take advantage of potential downward price movements.
4. take-profit level at 60 to secure profits in a strong downtrend.
5. When the RSI drops below the buy level of 4, a buy signal is generated. Consider placing a buy order to enter the market at a favorable price.
6. take-profit level at 30 to secure profits in a strong uptrend.
7. Monitor the RSI indicator on the chart to stay updated on its current value and anticipate potential trade signals.
Please note that trading decisions should be made based on a comprehensive analysis of multiple factors, including market conditions, trend analysis, and risk management. The "Good Mode RSI v2" strategy can serve as a valuable tool in your trading journey, but it should be used in conjunction with your own research and analysis.
► About it:
The "Good Mode RSI v2" strategy is not a mere replication or slight modification of existing strategies or indicators. It has been carefully crafted to provide traders with an original and purposeful approach to trading using the RSI indicator. The strategy's unique configuration of RSI levels and stop-loss/take-profit thresholds allows for improved performance and profitability. Backtesting results have shown impressive metrics, including a gain factor of 2.445 and a compelling profitability of 78.07% during the testing period.
► Referrals:
If you have any questions or need further assistance with the "Good Mode RSI v2" strategy, feel free to ask. Good luck with your trading endeavors!
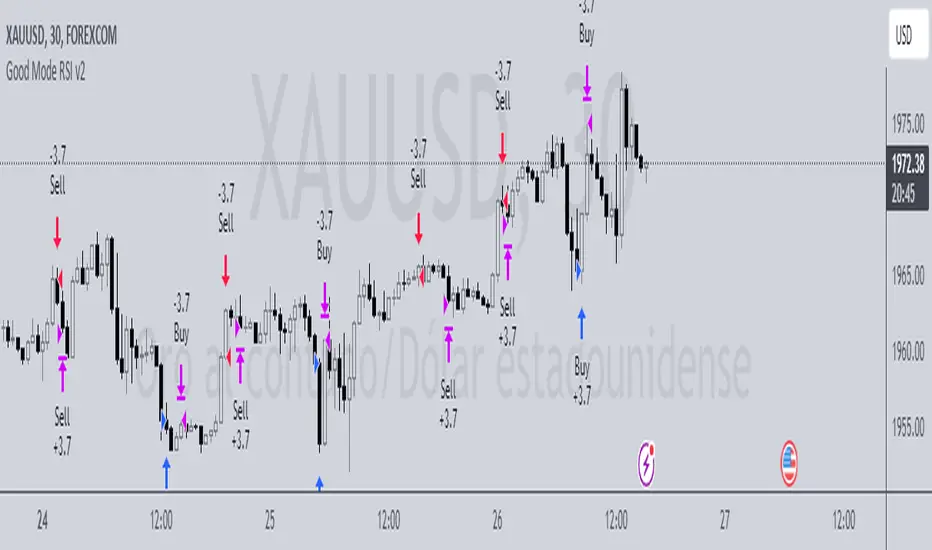
BTFD strategy [3min]Hello
I would like to introduce a very simple strategy to buy lows and sell with minimal profit
This strategy works very well in the markets when there is no clear trend and in other words, the trend going sideways
this strategy works very well for stable financial markets like spx500, nasdaq100 and dow jones 30
two indicators were used to determine the best time to enter the market:
volume + rsi values
volume is usually the number of stocks or contracts traded over a certain period of time. Thus, it is an important indicator of market activity and liquidity. Each transaction constitutes an individual exchange between the buyer and the seller and constitutes the trading volume of a given instrument or asset.
The RSI measures the strength of uptrends versus downtrends. The signal is the entry or exit of the indicator value of the oversold or overbought level of the market. It is assumed that a value below or equal 30 indicates an oversold level of the market, and an RSI value above or equal 70 indicates an overbought level.
the strategy uses a maximum of 5 market entries after each candle that meets the condition
uses 5 target point levels to close the position:
tp1= 0.4%
tp2= 0.6%
tp3= 0.8%
tp4= 1.0%
tp5= 1.2%
after reaching a given profit value, a piece of the position is cut off gradually, where tp5 closes 100% of the remaining position
each time you enter a position, a stop loss of 5.0% is set, which is quite a high value, however, when buying each, sometimes very active downward price movement, you need a lot of space for market decisions in which direction it wants to go
to determine the level of stop loss and target point I used a piece of code by RafaelZioni , here is the script from which a piece of code was taken
this strategy is used for automation, however, I would recommend brokers that have the lowest commission values when opening and closing positions, because the strategy generates very high commission costs
Enjoy and trade safe ;)

Volatility Capture RSI-Bollinger - Strategy [presentTrading]- Introduction and how it is different
The 'Volatility Capture RSI-Bollinger - Strategy ' is a trading strategy that combines the concepts of Bollinger Bands (BB), Relative Strength Index (RSI), and Simple Moving Average (SMA) to generate trading signals. The uniqueness of this strategy is it calculates which is a dynamic level between the upper and lower Bollinger Bands based on the closing price. This unique feature allows the strategy to adapt to market volatility and price movements.
The market in Crypto and Stock are highly volatile, making them suitable for a strategy that uses Bollinger Bands. The RSI can help identify overbought or oversold conditions in this often speculative market.
BTCUSD 4hr chart
(700.hk) 3hr chart
Remember, the effectiveness of a trading strategy also depends on other factors such as the timeframe used, the specific settings of the indicators, and the overall market conditions. It's always recommended to backtest and paper trade a strategy before using it in live trading.
- Strategy, How it Works
Dynamic Bollinger Band: The strategy works by first calculating the upper and lower Bollinger Bands based on the user-defined length and multiplier. It then uses the Bollinger Bands and the closing price to dynamically adjust the presentBollingBand value. In the end, it generates a long signal when the price crosses over the present Bolling Band and a short signal when the price crosses under the present Bolling Band.
RSI: If the user has chosen to use RSI for signals, the strategy also calculates the RSI and its SMA, and uses these to generate additional long and short signals. The RSI-based signals are only used if the 'Use RSI for signals' option is set to true.
The strategy then checks the chosen trading direction and enters a long or short position accordingly. If the trading direction is set to 'Both', the strategy can enter both long and short positions.
Finally, the strategy exits a position when the close price crosses under the present Bolling Band for a long position, or crosses over the present Bolling Band for a short position.
- Trade direction
The strategy also includes a trade direction parameter, allowing the user to choose whether to enter long trades, short trades, or both. This makes the strategy adaptable to different market conditions and trading styles.
- Usage
1. Set the input parameters as per your trading preferences. You can choose the price source, the length of the moving average, the multiplier for the ATR, whether to use RSI for signals, the RSI and SMA periods, the bought and sold range levels, and the trading direction.
2. The strategy will then generate buy and sell signals based on these parameters. You can use these signals to enter and exit trades.
- Default settings
1. Source: hlc3
2. Length: 50
3. Multiplier: 2.7183
4. Use RSI for signals: True
5. RSI Period: 10
6. SMA Period: 5
7. Bought Range Level: 55
8. Sold Range Level: 50
9. Trade Direction: Both
- Strategy's default Properties
1. Default Quantity Type: 'strategy.percent_of_equity'
2. commission_value= 0.1, commission_type=strategy.commission.percent, slippage= 1: These parameters set the commission and slippage for the strategy. The commission is set to 0.1% of the trade value, and the slippage (the difference between the expected price of a trade and the price at which the trade is executed) is set to 1.
3. default_qty_type = strategy.percent_of_equity, default_qty_value = 15: These parameters set the default quantity for trades. The default_qty_type is set to strategy.percent_of_equity, which means that the size of each trade will be a percentage of the account equity. The default_qty_value is set to 15, which means that each trade will be 15% of the account equity.
4. initial_capital= 10000: This parameter sets the initial capital for the strategy to $10,000.

PresentTrend - Strategy [presentTrading]- Introduction and how it is different
The PresentTrend strategy is a unique custom trend-following strategy. This combination allows the strategy to take advantage of both short-term and long-term market trends, making it suitable for various market conditions.
BTCUSDT 4hr chart
(700.hk) 3D chart
- Strategy, How it Works
RSI or MFI: The first part uses a custom indicator based on either the Relative Strength Index (RSI) or the Money Flow Index (MFI). The indicator calculates a PresentTrend value, which generates buy and sell signals based on its crossover and crossunder, indicating potential trend reversals.
ATR: The second part is a popular trend-following indicator that uses the Average True Range (ATR).
The strategy enters a long position when all buy signals from both strategies are true, and a short position when all sell signals are true. This ensures trades are entered when both short-term and long-term trends align, potentially increasing the strategy's reliability.
- Trade direction
The strategy also includes a trade direction parameter, allowing the user to choose whether to enter long trades, short trades, or both. This makes the strategy adaptable to different market conditions and trading styles.
- Usage
1. Set the input parameters for the custom trend-following strategy.
2. Choose whether to use the RSI or MFI for the custom strategy.
3. Choose the trade direction: long, short, or both.
4. The strategy will generate buy and sell signals based on the conditions of both strategies.
5. Enter a trade when a buy or sell signal is generated, depending on the chosen trade direction.
Please note that this strategy is meant to be a tool to aid in your trading decisions and not a standalone trading system. Always use proper risk management and make sure to test the strategy thoroughly before using it in live trading.
- Default settings
1. Source: 'hlc3', a balanced price level for calculations.
2. Length: 14, a common setting for many technical indicators.
3. Multiplier: 1.618 (the golden ratio), used in calculating the upper and lower thresholds.
4. RSI or MFI: Set to use MFI by default, both are momentum indicators.
5. Trade Direction: 'Both', allowing for both long and short trades.
The default settings are designed to provide a balanced approach to trend detection. However, these can be adjusted based on the user's preferences and the specific characteristics of the market being traded.
- Strategy's default Properties
1. Default Quantity Type: 'strategy.percent_of_equity'
2. commission_value= 0.1, commission_type=strategy.commission.percent, slippage= 1: These parameters set the commission and slippage for the strategy. The commission is set to 0.1% of the trade value, and the slippage (the difference between the expected price of a trade and the price at which the trade is executed) is set to 1.
3. default_qty_type = strategy.percent_of_equity, default_qty_value = 10: These parameters set the default quantity for trades. The default_qty_type is set to strategy.percent_of_equity, which means that the size of each trade will be a percentage of the account equity. The default_qty_value is set to 10, which means that each trade will be 10% of the account equity.
4. initial_capital= 10000: This parameter sets the initial capital for the strategy to $10,000.

Ta StrategyHello guys
This script follows traditional technical indicators
MACD, ADX, RSI and pivot points
If the price is above the resistance and the MACD has crossover ,and the RSI 14 is above 50
ADX is higher than 20, and DI+ is higher than DI-. This is a buy signal and vice versa for a sell signal
The script moves the stop loss to the entry price after the first target is reached
You can specify the quantity you want to sell when the price reaches the first target
There are also options like if you want the script to entry long or short, or both
you can reverse the strategy if it does not work well
If you want to inquire about any details, please let me know in the comments
