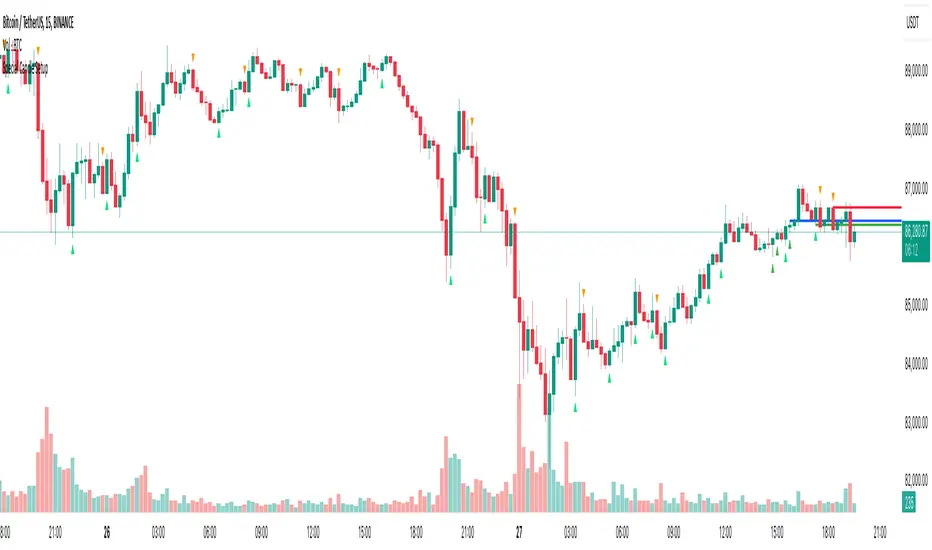
Special Candle SetupThe Special Candle Setup Indicator is designed to detect significant bearish and bullish candlestick patterns , helping traders identify potential trend shifts and key price action setups . This indicator recognizes 8 bearish patterns and 6 bullish patterns , derived from multi-candlestick formations observed across different markets, including crypto, indices, forex, and stocks.
How It Works
This indicator scans the market for specific candlestick structures that indicate potential reversals or trend continuations . It includes:
• Bearish Patterns (8 types) : Identifies candlestick structures that suggest potential downside movement.
• Bullish Patterns (6 types) : Detects formations indicating upward momentum.
• Reversal Signals : Additional patterns that highlight key turning points in price action.
• Key Level Marking : Automatically draws support and resistance levels based on detected setups.
• Expiry Signals (Optional) : Highlights patterns commonly seen on expiry days in the Indian market, but these patterns are universally applicable to other asset classes as well.
Key Features
✔ Comprehensive Candlestick Pattern Recognition – Detects 14 key bullish and bearish formations.
✔ Reversal & Trend Continuation Setups – Helps identify both potential reversals and momentum-based entries.
✔ Automated Key Level Marking – Plots dynamic blue lines for key support and resistance zones.
✔ Customizable Pattern Selection – Allows users to enable/disable specific pattern types.
✔ Non-Repainting Signals – Ensures stability by maintaining signal integrity over time.
Customization Options
• Enable/Disable Specific Patterns – Users can disable main patterns or reversal patterns based on their preference, allowing them to focus on a single type of setup if needed.
• Key Level Customization – The blue lines represent critical price levels, drawn automatically based on identified patterns. These act as reference points for potential breakouts or reversals.
• Optional Expiry Signals – Includes patterns commonly observed on expiry days, primarily for the Indian market, but they also appear in global markets like crypto, forex, and indices.
How to Use
• Trend Trading – Use bullish and bearish patterns to identify entry points within an existing trend.
• Reversal Trading – Focus on reversal signals near key levels for potential market turnarounds.
• Key Level Validation – Utilize the blue lines to confirm important price zones.
• Customization – Tailor the indicator to your strategy by selecting only the patterns that align with your trading style.
Why This Combination?
This indicator blends multiple candlestick formations, ensuring a well-rounded approach to market analysis. The integration of expiry signals, reversal structures, and key level plotting makes it adaptable for various asset classes, not just expiry-based trading.
Why It’s Worth Using?
Manually spotting multiple candlestick setups can be time-consuming and subjective. This indicator automates the process, providing structured insights into market movements with clearly defined signals and key level plotting, making it valuable for traders across different markets.
Reversalpattern
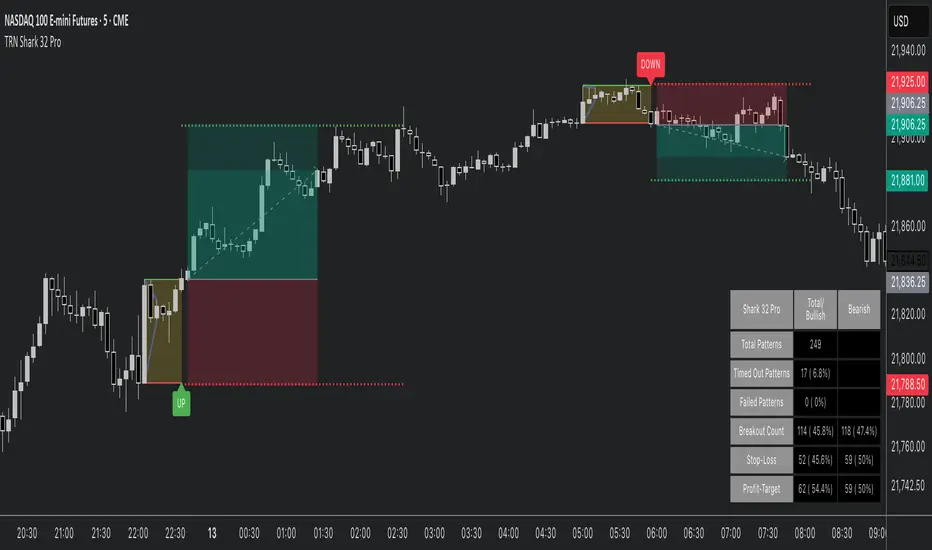
Shark 32 Pattern ProHello Traders!
The Shark32 pattern comprises multiple inside bars —each candle’s high/low is contained within the previous candle’s range—creating a tight consolidation zone. Once price breaks out, volatility frequently expands, producing sharper moves. The pattern is known for its relatively high continuation rate and the ability to offer tight risk/reward setups. It also calculates statistics, highlights stop/target levels, and offers fully customizable visuals so you can adapt the tool to your trading style.
Key Features :
Detects Shark 32 With Unlimited Inside Bars:
Automatically spots consecutive inside candles (not limited to just two), enabling you to catch more nuanced patterns.
Highlights Breakout:
Clear visual lines and labels mark where price breaks above/below the pattern boundary.
Stop-Loss & Profit Targets:
Draws a suggested stop-loss line and a projected target line, helping you manage risk and set profit objectives quickly.
Statistics & Analysis:
A built-in statistics table tracks pattern frequency, breakouts, stop-hits, target-hits, and more—helping you refine your strategy over time.
Fully Customizable Visuals:
Control line styles, colors, breakout labels, box fill, and more to fit your preference or chart theme.
Quick Resolutions:
This pattern forms fast and typically resolves within just a few bars, appealing to short-term traders.
Statistics at a Glance (based on Bulkowski's studies):
Continuation Bias : ~60% continuation bias.
Measured Move : 70%+ of bullish breakouts (in bull markets) reach the measured move.
Throwback : ~64% chance price retraces to the breakout level after an upside break.
Trend Alignment : Historically, success rates improve when trading in line with the larger trend.
How to Trade with This Indicator :
Identifying the Pattern : Wait till a Shark 32 pattern is formed.
Entry Rule : Enter on a confirmed close above the pattern high (for bullish) or below the pattern low (for bearish).
Stop Placement : Place stops a few ticks beyond the opposite side of the pattern. Tight ranges = small risk. Or use the mid-range of the pattern as a stop level.
Target Options : Aim for Risk/Reward Ratio of 2R or 3R to capture a strong follow-through. Alternatively, use the measured move of the first bar's height as a target.
Tips for Better Reliability:
Trend Alignment : Shark 32 breakouts usually work best in the direction of the broader market or trend.
Confirmation : Look for a significant volume increase at the breakout—helps filter out “fake” moves.
Throwback Awareness : ~64% of upside breakouts retest the pattern boundary; stay patient if you see a pullback.
Risk Management : Maintain tight stops and consider using alerts for activation/breakout signals.
Why This Indicator?
Clear Visuals : Highlights the pattern boundary, breakout lines, and potential stop/target levels.
Customizable : Lets you adjust line styles, risk parameters, alerts, and statistics display.
Statistical Edge : Built-in table aggregates pattern counts, success/failure rates, and average durations.
Final Thoughts:
This Shark 32 Pro indicator gives you a systematic way to spot—and trade—a compact yet powerful three-candle formation. Combine it with solid risk management and trend analysis for best results. Monitor volume and confirm breakouts with a candle close beyond the pattern’s range. While the pattern can fail, tight stops and clear targets help keep your trading efficient and disciplined.
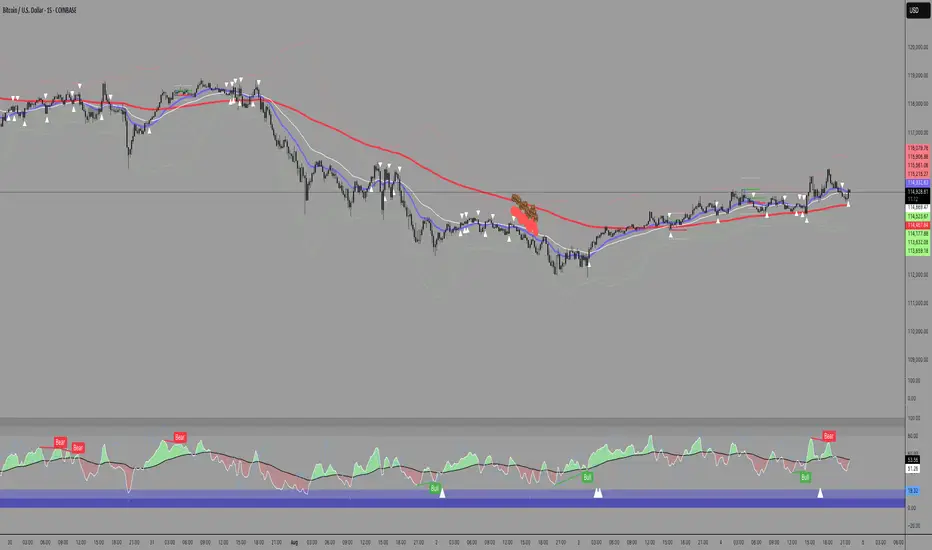
Half-Trend Channel [BigBeluga]Half Trend Channel is a powerful trend-following indicator designed to identify trend direction, fakeouts, and potential reversal points. The combination of upper/lower bands, midline coloring, and specific signals makes it ideal for spotting trend continuation and market reversals.
The base of the channel is calculated using smoothed half-trend logic.
// Initialize half trend on the first bar
if barstate.isfirst
hl_t := close
// Update half trend value based on conditions
switch
closeMA < hl_t and highestHigh < hl_t => hl_t := highestHigh
closeMA > hl_t and lowestLow > hl_t => hl_t := lowestLow
=> hl_t := hl_t
// Smooth
float s_hlt = ta.hma(hl_t, len)
🔵 Key Features:
Upper and Lower Bands:
The bands adapt dynamically to market volatility.
Price movements toward the bands help identify areas of overextension and potential reversal points.
Midline Trend Signal:
The midline changes color to reflect the current trend:
Green Midline: Indicates an uptrend.
Purple Midline: Signals a downtrend.
Fakeout Signals ("X"):
"X" markers appear when price briefly breaches the outer bands but fails to sustain the move.
Fakeouts help traders identify areas where price momentum weakens.
Reversal Signals (Triangles):
Triangles (▲ and ▼) mark potential tops and bottoms:
▲ Up Triangles: Suggest a potential bottom and a reversal to the upside.
▼ Down Triangles: Indicate a potential top and a reversal to the downside.
Dynamic Trend Labels:
At the last bar, the indicator displays labels like "Trend Up" or "Trend Dn" , reflecting the current trend direction.
🔵 Usage:
Use the colored midline to determine the overall trend direction.
Monitor "X" fakeout signals to spot failed breakouts or momentum exhaustion near the bands.
Watch for reversal triangles (▲ and ▼) to identify potential trend reversals at tops or bottoms.
Combine the bands and midline signals to confirm trade entries and exits:
Enter long trades when price bounces off the lower band with a green midline.
Consider short trades when price reverses from the upper band with a purple midline.
Use the trend label (e.g., "Trend Up" or "Trend Dn") for quick confirmation of the current market state.
The Half Trend Channel is an essential tool for traders who want to follow trends, avoid fakeouts, and identify reliable tops and bottoms to optimize their trading decisions.

Dragon Harmonic Pattern [TradingFinder] Dragon Detector🔵 Introduction
The Dragon Harmonic Pattern is one of the technical analysis tools that assists traders in identifying Potential Reversal Zones (PRZ). Resembling an "M" or "W" shape, this pattern is recognized in financial markets as a method for predicting bullish and bearish trends. By leveraging precise Fibonacci ratios and measuring price movements, traders can use this pattern to forecast market trends with high accuracy.
The Dragon Harmonic Pattern is built on the XABCD structure, where each point plays a significant role in shaping and forecasting price movements. Point X marks the beginning of the trend, representing the initial price movement. Point A indicates the first retracement, usually falling within the 0.380 to 0.620 range of the XA wave.
Next, point B signals the second retracement, which lies within 0.200 to 0.400 of the AB wave. Point C, acting as the hump of the pattern, is generally located within 0.800 to 1.100 of the XA wave. Finally, point D represents the endpoint of the pattern and the Potential Reversal Zone (PRZ), where the primary price reversal occurs.
In bullish scenarios, the Dragon Pattern indicates a reversal from a downtrend to an uptrend, where prices move upward from point D. Conversely, in bearish scenarios, prices decline after reaching point D. Accurate identification of this pattern through Fibonacci ratio analysis and PRZ examination can significantly increase the success rate of trades, enabling traders to adjust their strategies based on key market levels such as 0.618 or 1.100.
Due to its high accuracy in identifying Potential Reversal Zones (PRZ) and its alignment with Fibonacci ratios, the Dragon Harmonic Pattern is considered one of the most popular tools in technical analysis. Traders can use this pattern to pinpoint entry and exit points with greater confidence while minimizing trading risks.
Bullish :
Bearish :
🔵 How to Use
The Dragon Harmonic Pattern indicator helps traders identify bullish and bearish patterns in the market, allowing them to capitalize on available trading opportunities. By analyzing Fibonacci ratios and the XABCD structure, the indicator highlights Potential Reversal Zones (PRZ).
🟣 Bullish Dragon Pattern
In the Bullish Dragon Pattern, the price transitions from a downtrend to an uptrend after reaching point D. At this stage, points X, A, B, C, and D must be carefully identified.
Fibonacci ratios for these points are as follows: Point A should fall within 0.380 to 0.620 of the XA wave, point B within 0.200 to 0.400 of the AB wave, and point C within 0.800 to 1.100 of the XA wave.
When the price reaches point D, traders should look for bullish signals such as reversal candlesticks or increased trading volume to enter a buy position. The take-profit level can be set near the previous price high or based on the 1.272 Fibonacci ratio of the XA wave, while the stop-loss should be placed slightly below point D.
🟣 Bearish Dragon Pattern
In the Bearish Dragon Pattern, the price shifts from an uptrend to a downtrend after reaching point D. In this pattern, points X, A, B, C, and D must also be identified. Fibonacci ratios for these points are as follows: Point A should fall within 0.380 to 0.620 of the XA wave, point B within 0.200 to 0.400 of the AB wave, and point C within 0.800 to 1.100 of the XA wave.
Upon reaching point D, bearish signals such as reversal candlesticks or decreasing trading volume indicate the opportunity to enter a sell position. The take-profit level can be set near the previous price low or based on the 1.272 Fibonacci ratio of the XA wave, while the stop-loss should be placed slightly above point D.
By combining the Dragon Harmonic Pattern indicator with precise Fibonacci ratio analysis, traders can identify key opportunities while minimizing risks and improving their decision-making in both bullish and bearish market conditions.
🔵 Setting
🟣 Logical Setting
ZigZag Pivot Period : You can adjust the period so that the harmonic patterns are adjusted according to the pivot period you want. This factor is the most important parameter in pattern recognition.
Show Valid Forma t: If this parameter is on "On" mode, only patterns will be displayed that they have exact format and no noise can be seen in them. If "Off" is, the patterns displayed that maybe are noisy and do not exactly correspond to the original pattern.
Show Formation Last Pivot Confirm : if Turned on, you can see this ability of patterns when their last pivot is formed. If this feature is off, it will see the patterns as soon as they are formed. The advantage of this option being clear is less formation of fielded patterns, and it is accompanied by the latest pattern seeing and a sharp reduction in reward to risk.
Period of Formation Last Pivot : Using this parameter you can determine that the last pivot is based on Pivot period.
🟣 Genaral Setting
Show : Enter "On" to display the template and "Off" to not display the template.
Color : Enter the desired color to draw the pattern in this parameter.
LineWidth : You can enter the number 1 or numbers higher than one to adjust the thickness of the drawing lines. This number must be an integer and increases with increasing thickness.
LabelSize : You can adjust the size of the labels by using the "size.auto", "size.tiny", "size.smal", "size.normal", "size.large" or "size.huge" entries.
🟣 Alert Setting
Alert : On / Off
Message Frequency : This string parameter defines the announcement frequency. Choices include: "All" (activates the alert every time the function is called), "Once Per Bar" (activates the alert only on the first call within the bar), and "Once Per Bar Close" (the alert is activated only by a call at the last script execution of the real-time bar upon closing). The default setting is "Once per Bar".
Show Alert Time by Time Zone : The date, hour, and minute you receive in alert messages can be based on any time zone you choose. For example, if you want New York time, you should enter "UTC-4". This input is set to the time zone "UTC" by default.
🔵 Conclusion
The Dragon Harmonic Pattern is an advanced and practical technical analysis tool that aids traders in accurately predicting bullish and bearish trends by identifying Potential Reversal Zones (PRZ) and utilizing Fibonacci ratios. Built on the XABCD structure, this pattern stands out for its flexibility and precision in identifying price movements, making it a valuable resource among technical analysts. One of its key advantages is its compatibility with other technical tools such as trendlines, support and resistance levels, and Fibonacci retracements.
By using the Dragon Harmonic Pattern indicator, traders can accurately determine entry and exit points for their trades. The indicator analyzes key Fibonacci ratios—0.380 to 0.620, 0.200 to 0.400, and 0.800 to 1.100—to identify critical levels such as price highs and lows, offering precise trading strategies. In bullish scenarios, traders can profit from rising prices, while in bearish scenarios, they can capitalize on price declines.
In conclusion, the Dragon Harmonic Pattern is a highly reliable tool for identifying trading opportunities with exceptional accuracy. However, for optimal results, it is recommended to combine this pattern with other analytical tools and thoroughly assess market conditions. By utilizing this indicator, traders can reduce their trading risks while achieving higher profitability and confidence in their trading strategies.

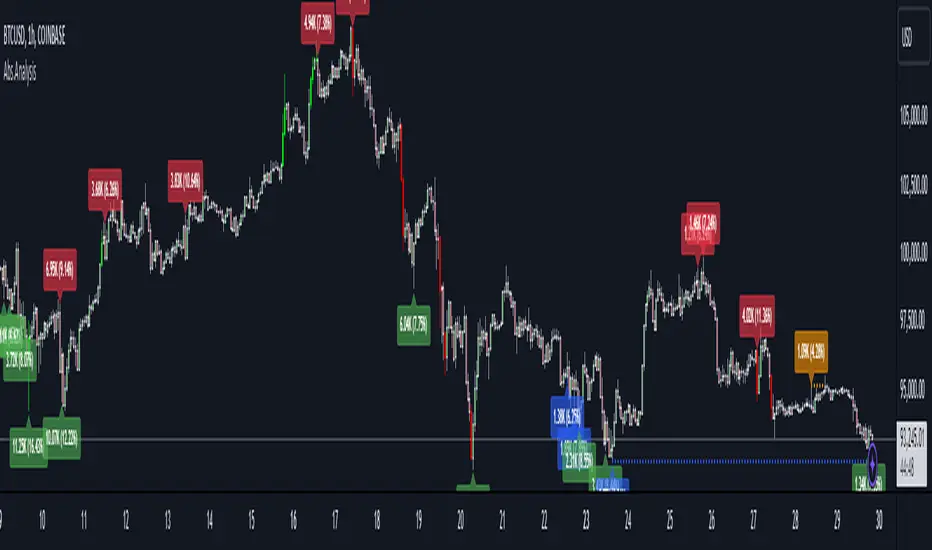
Absorption AnalysisThe Absorption Analysis indicator identifies potential market turning points by analyzing volume, price patterns, and market structure across multiple dimensions. It combines traditional technical signals with volume analysis and success rate tracking to provide high-probability reversal opportunities.
Signal Types & Classification
1. Pattern-Based Signals (W-Bottom & M-Top)
**W-Bottom Pattern**
- Pattern Structure:
* Price makes a low below the lower Bollinger Band
* First bounce occurs with price moving higher
* Secondary test forms a higher low
* Final confirmation with bullish close above lower band
- Volume Requirements:
* Must exceed 1.5x the 20-period volume moving average
- Visual Indicators:
* Blue dotted line appears at pattern low
* Line remains until broken by price
* Label shows volume and percentage from baseline
- Success Tracking:
* Pattern stored in historical database
* Success measured by upward price movement
* Historical success rate displayed with signal
**M-Top Pattern**
- Pattern Structure:
* Price makes a high above the upper Bollinger Band
* First pullback occurs with price moving lower
* Secondary push forms a lower high
* Final confirmation with bearish close below upper band
- Volume Requirements:
* Must exceed 1.5x the 20-period volume moving average
- Visual Indicators:
* Orange dotted line appears at pattern high
* Line remains until broken by price
* Label shows volume and percentage from baseline
- Success Tracking:
* Pattern stored in historical database
* Success measured by downward price movement
* Historical success rate displayed with signal
2. Technical Reversals
**Bullish Reversal**
- Entry Conditions:
* Previous candle closes below lower Bollinger Band
* Previous candle must be bearish
* Current candle closes above lower band
* Current candle must be bullish
- Volume Validation:
* Volume must exceed 1.5x 20-period MA
- Visual Markers:
* Green label at reversal point
* Includes volume context
- Trading Implementation:
* Suggests strong buying pressure overcoming selling
* Often marks end of downward price exhaustion
**Bearish Reversal**
- Entry Conditions:
* Previous candle closes above upper Bollinger Band
* Previous candle must be bullish
* Current candle closes below upper band
* Current candle must be bearish
- Volume Validation:
* Volume must exceed 1.5x 20-period MA
- Visual Markers:
* Red label at reversal point
* Includes volume context
- Trading Implementation:
* Suggests strong selling pressure overcoming buying
* Often marks end of upward price exhaustion
3. Volume-Based Reversals
**High Volume Bear to Bull**
- Signal Formation:
* High volume bearish candle (2.5σ above mean)
* Immediately followed by high volume bullish candle
- Market Psychology:
* Shows strong selling being absorbed by buying
* Often indicates institutional accumulation
- Visual Identification:
* Purple "HV Bull" label
* Includes volume statistics
- Trading Context:
* Strong signal for trend reversal
* Most effective at support levels
**High Volume Bull to Bear**
- Signal Formation:
* High volume bullish candle (2.5σ above mean)
* Immediately followed by high volume bearish candle
- Market Psychology:
* Shows strong buying being absorbed by selling
* Often indicates institutional distribution
- Visual Identification:
* Purple "HV Bear" label
* Includes volume statistics
- Trading Context:
* Strong signal for trend reversal
* Most effective at resistance levels
4. Absorption Signals
**Buy Absorption**
- Technical Requirements:
* High volume conditions (2.5σ above mean)
* Spread momentum must be negative
* Fast spread MA below slow spread MA
* Bullish closing candle
- Market Interpretation:
* Indicates buying pressure absorbing selling
* Often precedes upward movement
- Visual Markers:
* Red label with volume context
* Placed at significant price levels
**Sell Absorption**
- Technical Requirements:
* High volume conditions (2.5σ above mean)
* Spread momentum must be negative
* Fast spread MA below slow spread MA
* Bearish closing candle
- Market Interpretation:
* Indicates selling pressure absorbing buying
* Often precedes downward movement
- Visual Markers:
* Green label with volume context
* Placed at significant price levels
Volume Analysis Components
Volume Calculation
- Rolling baseline volume calculated based on timeframe:
* Monthly: 6-period sum
* Weekly: 12-period sum
* Daily: 20-period sum
* Intraday: Proportional to timeframe
- Net volume = Bullish volume - Bearish volume
- Volume percentage calculated against baseline
- High volume threshold = 2.5 standard deviations
- Pattern volume threshold = 1.5x 20MA
Exchange Aggregation
- Primary symbol (chart) always included
- Optional secondary symbol data
- Combines volume data for stronger signals
- Useful for crypto markets with split liquidity
Success Rate Implementation
Rate Calculation
- Based on user-defined lookback period
- Separately tracked for each pattern type
- Bullish patterns: Percentage of times price moved higher
- Bearish patterns: Percentage of times price moved lower
- Used to filter alerts with minimum threshold
Pattern Storage
- Arrays maintain historical pattern data
- Limited to lookback period size
- Oldest patterns removed as new ones form
- Constantly updated success rates
## Trading Implementation
### Signal Priority
1. Pattern Signals (W/M)
- Highest reliability due to complex criteria
- Must meet all volume and price conditions
- Line break provides clear invalidation
2. High Volume Reversals
- Strong indication of institutional activity
- Clear volume confirmation
- Immediate reversal potential
3. Technical Reversals
- Traditional technical analysis backbone
- Enhanced with volume confirmation
- Good for trend trading
4. Absorption Signals
- Early warning system
- Best used with other confirmations
- Good for position building
Best Practices
- Look for multiple signal types aligning
- Consider higher timeframe context
- Use success rates to filter setups
- Monitor volume context closely
- Wait for candle closes
- Use line breaks for clear invalidation
- Consider market structure
- Pay attention to success rates
- Use appropriate position sizing
Risk Management
- Use pattern breaks for stop losses
- Consider historical success rates
- Larger positions for multiple signal confluence
- Respect timeframe hierarchy
- Monitor volume for confirmation
- Use proper position sizing
- Consider market volatility
This indicator provides a comprehensive framework for identifying potential market turning points while maintaining rigorous risk management through multiple confirmation factors and clear invalidation levels.
Turtle Soup ICT Strategy [TradingFinder] FVG + CHoCH/CSD🔵 Introduction
The ICT Turtle Soup trading setup, designed in the ICT style, operates by hunting or sweeping liquidity zones to exploit false breakouts and failed breakouts in key liquidity Zones, such as recent highs, lows, or major support and resistance levels.
This setup identifies moments when the price breaches these liquidity zones, triggering stop orders placed (Stop Hunt) by other traders, and then quickly reverses direction. These movements are often associated with liquidity sweeps that create temporary market imbalances.
The reversal is typically confirmed by one of three structural shifts : a Market Structure Shift (MSS), a Change of Character (CHoCH), or a break of the Change in State of Delivery (CISD). Each of these structural shifts provides a reliable signal to interpret market intent and align trading decisions with the expected price movement. After the structural shift, the price frequently pullback to a Fair Value Gap (FVG), offering a precise entry point for trades.
By integrating key concepts such as liquidity, liquidity sweeps, stop order activation, structural shifts (MSS, CHoCH, CISD), and price imbalances, the ICT Turtle Soup setup enables traders to identify reversal points and key entry zones with high accuracy.
This strategy is highly versatile, making it applicable across markets such as forex, stocks, cryptocurrencies, and futures. It offers traders a robust and systematic approach to understanding price movements and optimizing their trading strategies
🟣 Bullish and Bearish Setups
Bullish Setup : The price first sweeps below a Sell-Side Liquidity (SSL) zone, then reverses upward after forming an MSS or CHoCH, and finally pulls back to an FVG, creating a buying opportunity.
Bearish Setup : The price first sweeps above a Buy-Side Liquidity (BSL) zone, then reverses downward after forming an MSS or CHoCH, and finally pulls back to an FVG, creating a selling opportunity.
🔵 How to Use
To effectively utilize the ICT Turtle Soup trading setup, begin by identifying key liquidity zones, such as recent highs, lows, or support and resistance levels, in higher timeframes.
Then, monitor lower timeframes for a Liquidity Sweep and confirmation of a Market Structure Shift (MSS) or Change of Character (CHoCH).
After the structural shift, the price typically pulls back to an FVG, offering an optimal trade entry point. Below, the bullish and bearish setups are explained in detail.
🟣 Bullish Turtle Soup Setup
Identify Sell-Side Liquidity (SSL) : In a higher timeframe (e.g., 1-hour or 4-hour), identify recent price lows or support levels that serve as SSL zones, typically the location of stop-loss orders for traders.
Observe a Liquidity Sweep : On a lower timeframe (e.g., 15-minute or 30-minute), the price must move below one of these liquidity zones and then reverse. This movement indicates a liquidity sweep.
Confirm Market Structure Shift : After the price reversal, look for a structural shift (MSS or CHoCH) indicated by the formation of a Higher Low (HL) and Higher High (HH).
Enter the Trade : Once the structural shift is confirmed, the price typically pulls back to an FVG. Enter a buy trade in this zone, set a stop-loss slightly below the recent low, and target Buy-Side Liquidity (BSL) in the higher timeframe for profit.
🟣 Bearish Turtle Soup Setup
Identify Buy-Side Liquidity (BSL) : In a higher timeframe, identify recent price highs or resistance levels that serve as BSL zones, typically the location of stop-loss orders for traders.
Observe a Liquidity Sweep : On a lower timeframe, the price must move above one of these liquidity zones and then reverse. This movement indicates a liquidity sweep.
Confirm Market Structure Shift : After the price reversal, look for a structural shift (MSS or CHoCH) indicated by the formation of a Lower High (LH) and Lower Low (LL).
Enter the Trade : Once the structural shift is confirmed, the price typically pulls back to an FVG. Enter a sell trade in this zone, set a stop-loss slightly above the recent high, and target Sell-Side Liquidity (SSL) in the higher timeframe for profit.
🔵 Settings
Higher TimeFrame Levels : This setting allows you to specify the higher timeframe (e.g., 1-hour, 4-hour, or daily) for identifying key liquidity zones.
Swing period : You can set the swing detection period.
Max Swing Back Method : It is in two modes "All" and "Custom". If it is in "All" mode, it will check all swings, and if it is in "Custom" mode, it will check the swings to the extent you determine.
Max Swing Back : You can set the number of swings that will go back for checking.
FVG Length : Default is 120 Bar.
MSS Length : Default is 80 Bar.
FVG Filter : This refines the number of identified FVG areas based on a specified algorithm to focus on higher quality signals and reduce noise.
Types of FVG filter s:
Very Aggressive Filter: Adds a condition where, for an upward FVG, the last candle's highest price must exceed the middle candle's highest price, and for a downward FVG, the last candle's lowest price must be lower than the middle candle's lowest price. This minimally filters out FVGs.
Aggressive Filter: Builds on the Very Aggressive mode by ensuring the middle candle is not too small, filtering out more FVGs.
Defensive Filter: Adds criteria regarding the size and structure of the middle candle, requiring it to have a substantial body and specific polarity conditions, filtering out a significant number of FVGs.
Very Defensive Filter: Further refines filtering by ensuring the first and third candles are not small-bodied doji candles, retaining only the highest quality signals.
In the indicator settings, you can customize the visibility of various elements, including MSS, FVG, and HTF Levels. Additionally, the color of each element can be adjusted to match your preferences. This feature allows traders to tailor the chart display to their specific needs, enhancing focus on the key data relevant to their strategy.
🔵 Conclusion
The ICT Turtle Soup trading setup is a powerful tool in the ICT style, enabling traders to exploit false breakouts in key liquidity zones. By combining concepts of liquidity, liquidity sweeps, market structure shifts (MSS and CHoCH), and pullbacks to FVG, this setup helps traders identify precise reversal points and execute trades with reduced risk and increased accuracy.
With applications across various markets, including forex, stocks, crypto, and futures, and its customizable indicator settings, the ICT Turtle Soup setup is ideal for both beginner and advanced traders. By accurately identifying liquidity zones in higher timeframes and confirming structure shifts in lower timeframes, this setup provides a reliable strategy for navigating volatile market conditions.
Ultimately, success with this setup requires consistent practice, precise market analysis, and proper risk management, empowering traders to make smarter decisions and achieve their trading goals.

Double Top/Bottom [AlgoAlpha]Introducing the Double Top/Bottom Indicator by AlgoAlpha, a powerful tool designed to identify key reversal patterns in the market with precision. This indicator meticulously detects double tops and double bottoms, helping traders recognize potential trend reversals and make informed trading decisions.
Key Features:
🔍 Pattern Detection : Accurately identifies double top and double bottom formations based on customizable time horizons.
🎨 Customizable Appearance : Choose your preferred colors for bullish and bearish trends to match your trading style.
📊 Signal Labels : Option to display only the second pivot of the double top/bottom for a cleaner chart view.
🔧 Flexible Settings : Adjust the time horizon to control the look-back period, allowing for detection of both short-term and long-term patterns.
📈 Visual Enhancements : Draws trend lines and fills between pivotal points to visually highlight potential reversal zones.
🔔 Alerts : Set up alerts for potential double top and double bottom formations to stay informed of key market movements.
How to Use the Double Top/Bottom Indicator :
🛠 Add the Indicator : Simply add the Double Top/Bottom Indicator to your TradingView chart from your favorites. Customize the time horizon and appearance settings to fit your trading preferences.
📊 Analyze Patterns : Watch for the identified double top and double bottom patterns along with the corresponding trend lines and filled areas to anticipate potential market reversals.
🔔 Set Alerts : Enable alerts to receive notifications when double top or double bottom patterns are detected, ensuring you never miss a critical trading opportunity.
How It Works : The indicator scans the price action for pivot highs and lows within a specified time horizon, identifying potential double top and double bottom patterns. It maintains a sequence of these pivots and verifies the formation of these patterns based on the relationship between consecutive pivots and the proximity to a defined limit. When a double top or double bottom is confirmed, the indicator marks the second pivot point with a label and draws trend lines to visualize the reversal pattern. Additionally, it provides alert conditions to notify traders of potential confirmations, enhancing decision-making without cluttering the chart.
⚠️ Important Reminder : The labels indicating double tops and bottoms appear with a delay and are intended to mark the formations after they have already formed. They are not meant to be used as real-time trading signals. While they align perfectly with pivot points in hindsight, please use them as markers for analysis rather than immediate trading triggers.

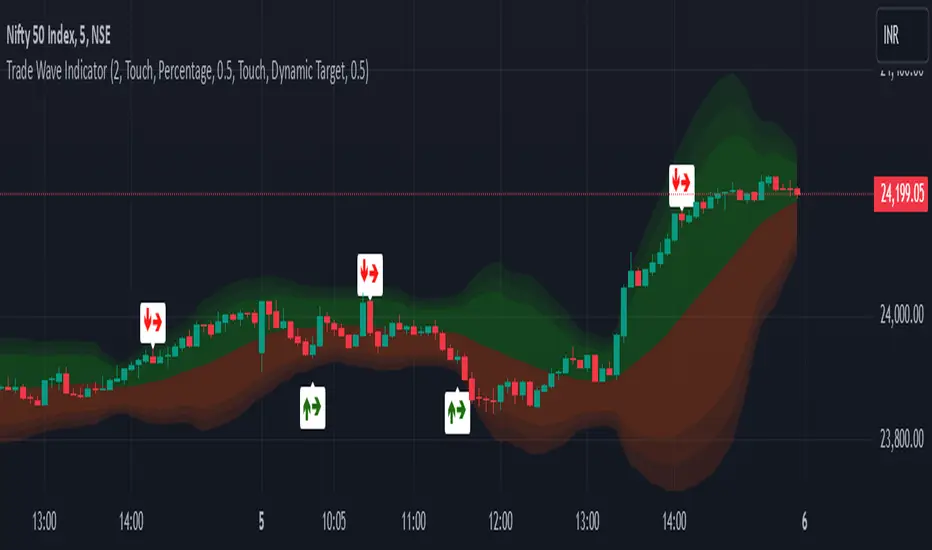
Trade Wave [Bluechip Algos]Trade Wave is a momentum-based indicator designed to show reversal signals. Most of the time, markets are in range bound and this indicator tries to show you the overbought and oversold zone of the time frame you select. It works well during range bound market giving you reversal signals at highs and lows of the range. One can make use of "Momentum tuning" in inputs section to pick the level of momentum aggressiveness. If value is higher, signals will be lesser and if value is low signals will be more. One can also choose different types of stop-losses and targets.
Stop Loss Types:
Fixed SL: Set a fixed stop loss value for consistent risk management.
Dynamic SL: Adjusts with the market, providing a flexible stop loss that moves with price changes.
Previous Candle SL: Stop losses based on the recent low (for sell signals) or high (for buy signals) of the last few candles.
Target Types:
Fixed Target: Set a fixed target value for consistent profit goals.
Dynamic Target: Adjusts with market movements to maximize potential gains.
Risk:Reward Target: Define targets based on SL risk:reward ratios (e.g., 1:2), allowing for personalized risk management strategies.
Suggestion: It's better to take reversal confirmation from multiple time frames instead of relying on just one.
70% rule strength/trend/reversalThis indicator tells you which candle closed strong for the day by identifying if the price closed above 70% of the candle's total height. this can help you identify reversals/new trends/ renewed strength in the current trend.
The indicator colors such candle green and if the candle closes with increase in price by 5% or higher then marks an asterisk under the candle.
HOPE THIS HELPS

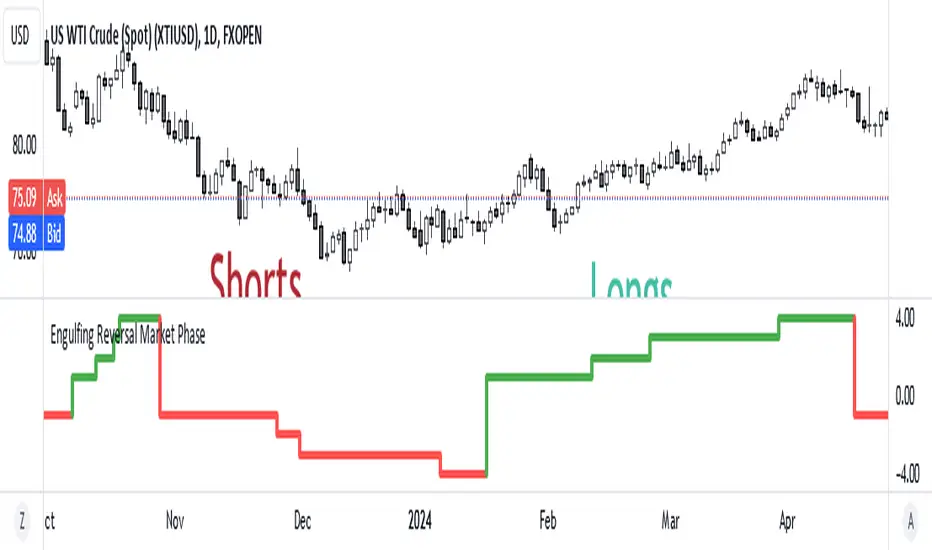
Engulfing Reversal Market PhaseStay at the right side of the market.
This indicator detects bullish and bearish phase in the market based on recent reversal.
It is designed to help filter your trades.
Open only long trades if indicator shows green and open only short trades when indicator shows red.
This indicator will detect bullish and bearish engulfing reversal pattern on the chart.
Bullish engulfing occurs when current candle closes below the bars that created the high.
Bearish engulfing occurs when current candle closes below the bars that created the high.
The reversal pattern occurs not only on a trend change, but can be also be present as a trend continuation pattern or a breakout pattern.
The indicator is able to detect 3 candle patterns and multi candle patterns if detects inside bars in the pattern.
Three Bar Reversal Pattern [LuxAlgo]The Three Bar Reversal Pattern indicator identifies and highlights three bar reversal patterns on the user price chart.
The script also provides an option for incorporating various trend indicators used to filter out detected signals, allowing them to enhance their accuracy and help obtain a more comprehensive analysis.
🔶 USAGE
The script automates the detection of three-bar reversal patterns and provides a clear, visually identifiable signal for potential trend reversals.
When a reversal chart pattern is confirmed and price action aligns with the pattern, the pattern's boundaries are extended, forming levels, with the upper boundary often acting as a resistance and the lower boundary as a support.
The script allows users to filter patterns based on a specific trend direction detected by multiple trend indicators. Users can choose to view patterns that are either aligned with the detected trend or opposite to it.
Included trend indicators are: Moving Average Cloud, Supertrend, and Donchian Channels.
🔶 DETAILS
The three-bar reversal pattern is a technical analysis pattern that signals a potential reversal in the prevailing trend. The pattern consists of three consecutive bar formations:
First Bar and Second Bar: 2 consecutive of the same sentiment, representing the prevailing trend in the market.
Third Bar: Confirms the reversal by closing beyond the high or low of the first bar, signaling a potential change in market sentiment.
Various types of three-bar reversal patterns are documented. The script supports two main types:
Normal Pattern: Detects three-bar reversal patterns without requiring the third bar closing price to surpass the high (bullish pattern) or low (bearish pattern) of the first bar. It identifies basic formations signaling potential trend reversals.
Enhanced Pattern: Specifically identifies three-bar reversal patterns where the third bar closing price surpasses the high (bullish pattern) or low (bearish pattern) of the first bar. This type provides a more selective signal for stronger trend reversals.
🔶 SETTINGS
Pattern Type: Users can choose the type of 3-bar reversal patterns to detect: Normal, Enhanced, or All. "Normal" detects patterns that do not necessarily surpass the high/low of the first bar. "Enhanced" detects patterns where the third bar surpasses the high/low of the first bar. "All" detects both Normal and Enhanced patterns.
Derived Support and Resistance: Toggles the visibility of the support and resistance levels/zones.
🔹 Trend Filtering
Filtering: Allows users to filter patterns based on the trend indicators: Moving Average Cloud, Supertrend, and Donchian Channels. The "Aligned" option only detects patterns that align with the trend and conversely, the "Opposite" option detects patterns that go against the trend.
🔹 Trend Indicator Settings
Moving Average Cloud: Allows traders to choose the type of moving averages (SMA, EMA, HMA, etc.) and set the lengths for fast and slow-moving averages.
Supertrend: Options to set the ATR length and factor for Supertrend.
Donchian Channels: Option to set the length for the channel calculation.
🔶 RELATED SCRIPTS
Reversal-Candlestick-Structure .
Reversal-Signals .

The Bar Counter Trend Reversal Strategy [TradeDots]Overview
The Bar Counter Trend Reversal Strategy is designed to identify potential counter-trend reversal points in the market after a series of consecutive rising or falling bars.
By analyzing price movements in conjunction with optional volume confirmation and channel bands (Bollinger Bands or Keltner Channels), this strategy aims to detect overbought or oversold conditions where a trend reversal may occur.
🔹How it Works
Consecutive Price Movements
Rising Bars: The strategy detects when there are a specified number of consecutive rising bars (No. of Rises).
Falling Bars: Similarly, it identifies a specified number of consecutive falling bars (No. of Falls).
Volume Confirmation (Optional)
When enabled, the strategy checks for increasing volume during the consecutive price movements, adding an extra layer of confirmation to the potential reversal signal.
Channel Confirmation (Optional)
Channel Type: Choose between Bollinger Bands ("BB") or Keltner Channels ("KC").
Channel Interaction: The strategy checks if the price interacts with the upper or lower channel lines: For short signals, it looks for price moving above the upper channel line. For long signals, it looks for price moving below the lower channel line.
Customization:
No. of Rises/Falls: Set the number of consecutive bars required to trigger a signal.
Volume Confirmation: Enable or disable volume as a confirmation factor.
Channel Confirmation: Enable or disable channel bands as a confirmation factor.
Channel Settings: Adjust the length and multiplier for the Bollinger Bands or Keltner Channels.
Visual Indicators:
Entry Signals: Triangles plotted on the chart indicate potential entry points:
Green upward triangle for long entries.
Red downward triangle for short entries.
Channel Bands: The upper and lower bands are plotted for visual reference.
Strategy Parameters:
Initial Capital: $10,000.
Position Sizing: 80% of equity per trade.
Commission: 0.01% per trade to simulate realistic trading costs.
🔹Usage
Set up the number of Rises/Falls and choose whether if you want to use channel indicators and volume as the confirmation.
Monitor the chart for triangles indicating potential entry points.
Consider the context of the overall market trend and other technical factors.
Backtesting and Optimization:
Use TradingView's Strategy Tester to evaluate performance.
Adjust parameters to optimize results for different market conditions.
🔹 Considerations and Recommendations
Risk Management:
The strategy does not include built-in stop-loss or take-profit levels. It's recommended to implement your own risk management techniques.
Market Conditions:
Performance may vary in different market environments. Testing and adjustments are advised when applying the strategy to new instruments or timeframes.
No Guarantee of Future Results:
Past performance is not indicative of future results. Always perform due diligence and consider the risks involved in trading.

E9 Shark-32 PatternUnderstanding the Shark-32 Pattern and its Trading Applications
The Shark-32 Pattern is a bearish technical trading formation used to predict market reversals or trend continuations. It highlights a downward move followed by a corrective rally, signaling a potential resumption of the downtrend. Here’s a breakdown of how it works:
What is the Shark-32 Pattern?
The Shark-32 pattern is a five-wave structure typically observed in bearish markets:
Wave 0 to X: A significant price decline starts the pattern.
Wave X to A: A correction pushes the price slightly upward.
Wave A to B: The price drops again but doesn’t reach the initial low.
Wave B to C: A final sharp decline concludes the pattern.
Once Wave C is formed, it suggests that the market will continue to move downward, presenting a potential selling or shorting opportunity.
Using the Pattern in Trading
This pattern is valuable for traders seeking high-probability bearish setups. The goal is to capitalize on the continuation of a downtrend following the corrective rally (X to A). Identifying the Shark-32 pattern helps anticipate the next wave of selling pressure.
Trading Setup
Identify a Shark-32 pattern.
If the price closes above the pattern's high, buy at the open the next day.
If the price closes below the pattern's low, short at the open the next day.
Sell/cover when the price moves 7% in the direction of the breakout.
Close the trade for a loss if the price moves 7% in the opposite direction.
For example, in a bull market after an upward breakout from a Shark-32, the net gain was $69.55. The method won 56% of the time with 5,218 winning trades and an average gain of $714.07. Conversely, 44% of trades were losers, with an average loss of $747.33. The average holding period was 26 calendar days.
The gains and losses were closely aligned with the 7% threshold set for this test.
Key Target Levels
To enhance the strategy, use dotted projection lines as target levels:
Upper Target: Drawn above the high of the corrective rally (Wave A). If the price breaks above this line, it may signal further upward movement, indicating a potentially weaker downtrend.
Lower Target: Positioned below the low of Wave C, providing a target for bearish trades.
These lines help determine future price targets and assist in setting take-profit or stop-loss levels.
Trading the Breakout
Look for breakouts once the Shark-32 pattern is identified:
Upward Breakout: If the price closes above the green line (high from two bars ago), it indicates a potential reversal to the upside.
Downward Breakout: If the price breaks below the red line (low from two bars ago), it confirms the bearish continuation.
Breakouts allow traders to adjust their positions based on market shifts.
Trading Tips
Continuation: The Shark-32 pattern acts as a continuation 60% of the time, confirming the ongoing trend.
Breakout Confirmation: Wait for the price to close above or below the pattern’s key levels before entering a trade.
Trade with the Trend: Since the Shark-32 is a continuation pattern, expect the breakout to align with the inbound price trend.
Symmetry: Patterns with symmetry often perform better. For more insights, refer to detailed trading literature.
Half-Staff: The Shark-32 can form midway in a trend, similar to flags and pennants.
Shark-32: Trading Performance
Based on an analysis of 23,369 trades, the following performance metrics were observed:
Bull Market with Upward Breakout: The average net profit was $69.55. This method won 56% of the time, with winning trades averaging $714.07. Losing trades, which constituted 44% of the total, had an average loss of $747.33. The average holding period was 26 calendar days.
Bull Market with Downward Breakout: The average net loss was $(76.36). This method won 43% of the time, with winning trades averaging $753.56. Losing trades, which constituted 57% of the total, had an average loss of $706.32. The average holding period was 23 calendar days.
Bear Market with Upward Breakout: The average net loss was $(89.13). This method won 46% of the time, with winning trades averaging $710.77. Losing trades, which constituted 54% of the total, had an average loss of $756.97. The average holding period was 16 calendar days.
Bear Market with Downward Breakout: The average net profit was $65.17. This method won 52% of the time, with winning trades averaging $781.62. Losing trades, which constituted 48% of the total, had an average loss of $722.41. The average holding period was 13 calendar days.
Swing Failure Pattern SFP [TradingFinder] SFP ICT Strategy🔵 Introduction
The Swing Failure Pattern (SFP), also referred to as a "Fake Breakout" or "False Breakout," is a vital concept in technical analysis. This pattern is derived from classic technical analysis, price action strategies, ICT concepts, and Smart Money Concepts.
It’s frequently utilized by traders to identify potential trend reversals in financial markets, especially in volatile markets like cryptocurrencies and forex. SFP helps traders recognize failed attempts to breach key support or resistance levels, providing strategic opportunities for trades.
The Swing Failure Pattern (SFP) is a popular strategy among traders used to identify false breakouts and potential trend reversals in the market. This strategy involves spotting moments where the price attempts to break above or below a previous high or low (breakout) but fails to sustain the move, leading to a sharp reversal.
Traders use this strategy to identify liquidity zones where stop orders (stop hunt) are typically placed and targeted by larger market participants or whales.
When the price penetrates these areas but fails to hold the levels, a liquidity sweep occurs, signaling exhaustion in the trend and a potential reversal. This strategy allows traders to enter the market at the right time and capitalize on opportunities created by false breakouts.
🟣 Types of SFP
When analyzing SFPs, two main variations are essential :
Real SFP : This occurs when the price breaks a critical level but fails to close above it, then quickly reverses. Due to its clarity and strong signal, this SFP type is highly reliable for traders.
Considerable SFP : In this scenario, the price closes slightly above a key level but quickly declines. Although significant, it is not as definitive or trustworthy as a Real SFP.
🟣 Understanding SFP
The Swing Failure Pattern, or False Breakout, is identified when the price momentarily breaks a crucial support or resistance level but cannot maintain the movement, leading to a rapid reversal.
The pattern can be categorized as follows :
Bullish SFP : This type occurs when the price dips below a support level but rebounds above it, signaling that sellers failed to push the price lower, indicating a potential upward trend.
Bearish SFP : This pattern forms when the price surpasses a resistance level but fails to hold, suggesting that buyers couldn’t maintain the higher price, leading to a potential decline.
🔵 How to Use
To effectively identify an SFP or Fake Breakout on a price chart, traders should follow these steps :
Identify Key Levels: Locate significant support or resistance levels on the chart.
Observe the Fake Breakout: The price should break the identified level but fail to close beyond it.
Monitor Price Reversal: After the breakout, the price should quickly reverse direction.
Execute the Trade: Traders typically enter the market after confirming the SFP.
🟣 Examples
Bullish Example : Bitcoin breaks below a $30,000 support level, drops to $29,000, but closes above $30,000 by the end of the day, signaling a Real Bullish SFP.
Bearish Example : Ethereum surpasses a $2,000 resistance level, rises to $2,100, but then falls back below $2,000, forming a Bearish SFP.
🟣 Pros and Cons of SFP
Pros :
Effective in identifying strong reversal points.
Offers a favorable risk-to-reward ratio.
Applicable across different timeframes.
Cons :
Requires experience and deep market understanding.
Risk of encountering false breakouts.
Should be combined with other technical tools for optimal effectiveness.
🔵 Settings
🟣 Logical settings
Swing period : You can set the swing detection period.
SFP Type : Choose between "All", "Real" and "Considerable" modes to identify the swing failure pattern.
Max Swing Back Method : It is in two modes "All" and "Custom". If it is in "All" mode, it will check all swings, and if it is in "Custom" mode, it will check the swings to the extent you determine.
Max Swing Back : You can set the number of swings that will go back for checking.
🟣 Display settings
Displaying or not displaying swings and setting the color of labels and lines.
🟣 Alert Settings
Alert SFP : Enables alerts for Swing Failure Pattern.
Message Frequency : Determines the frequency of alerts. Options include 'All' (every function call), 'Once Per Bar' (first call within the bar), and 'Once Per Bar Close' (final script execution of the real-time bar). Default is 'Once per Bar'.
Show Alert Time by Time Zone : Configures the time zone for alert messages. Default is 'UTC'.
🔵 Conclusion
The Swing Failure Pattern (SFP), or False Breakout, is an essential analytical tool that assists traders in identifying key market reversal points for successful trading.
By understanding the nuances between Real SFP and Considerable SFP, and integrating this pattern with other technical analysis tools, traders can make more informed decisions and better manage their trading risks.

Morning & Evening Star Pro (Candle Pattern)Hello Traders!
The Morning & Evening Star Pro indicator often catches the absolute top or bottom of a move and is a reliable reversal indicator. It also provides excellent entries in a strong trending market. For example, in an uptrend you can use a morning star as a pullback entry signal.
The indicator is an advanced tool for identifying powerful reversal patterns in the market. It combines traditional candlestick analysis with modern technical indicators to provide traders with high-probability entry and exit signals.
Key features:
Accurate pattern detection:
Utilizes sophisticated algorithms to identify genuine Morning Star and Evening Star patterns, filtering out false signals.
Trend filter:
Incorporates a customizable Simple Moving Average (SMA) to align signals with the overall market trend, enhancing trade quality.
Volatility awareness:
Integrates Average True Range (ATR) calculations to ensure detected patterns are significant relative to recent price action.
Visual clarity:
Highlights Morning Star and Evening Star patterns with customizable colors and shapes, making them easy to spot on the chart.
Flexible customization:
Offers a wide range of user inputs to tailor the indicator to various trading styles and preferences.
Filtered signal display:
Option to show filtered-out signals, providing insight into the indicator's decision-making process.
Morning Star
Is a bearish reversal (or continuation) pattern consisting of three candles:
A large bearish candle
A small-bodied candle like a Doji or Pin bar
A bullish candle
Evening Star
Is a bullish reversal (or continuation) pattern consisting of three candles:
A large bullish candle
A small-bodied candle like a Doji or Pin bar
A bearish candle
Key differences in this implementation
The middle candle can be either a Doji or a Pin bar, expanding the traditional definition.
The second candle can be a Pin bar, and the third candle can be an outside bar reversal, allowing for more flexibility in pattern recognition.
What makes this indicator unique
Comprehensive pattern analysis:
Goes beyond simple price action by considering multiple factors such as candle body ratios, wick lengths, and relative positions to previous candles.
Adaptive to market conditions:
Uses dynamic thresholds based on recent volatility (ATR) to adjust pattern detection criteria.
Educational value:
The option to display filtered signals helps traders understand why some patterns are rejected, aiding in skill development.
How to Trade with this Indicator:
This indicator often catches the absolute top or bottom of a move and is a reliable reversal indicator. It also provides excellent entries in a trending market. For example, in a strong uptrend you can use morning star signals to enter in a pullback.
Bullish Opportunities:
Look for Morning Star patterns (aqua-colored candles and labels) as potential buy signals.
Bearish Opportunities:
Watch for Evening Star patterns (orange-colored candles and labels) as potential sell signals.
Entry: At next bar open (after the aqua-colored candle for bullish or orange-colored candle for bearish completes)
Stop loss: 2 ticks below/above the pattern's low/high.
Stop loss alternative: If the colored candle is a very strong candle (e.g. for morning star a candle with almost no down wick and a close near the top) the stop goes 2 ticks below/above the colored candle.
Take profit: 3R or use a trailing stop.
Trend Alignment:
For conservative trading, only take trades in the direction of the overall trend as indicated by the SMA.
Note: if you want to see candle coloring of the morning and evening star, you must put the indicator to the top of the object tree.

Butterfly Harmonic Pattern [TradingFinder] Harmonic Detector🔵 Introduction
The Butterfly Harmonic Pattern is a sophisticated and highly regarded tool in technical analysis, utilized by traders to identify potential reversal points in the financial markets. This pattern is distinguished by its reliance on Fibonacci ratios and geometric configurations, which aid in predicting price movements with remarkable precision.
The origin of the Butterfly Harmonic Pattern can be traced back to the pioneering work of Bryce Gilmore, who is credited with discovering this pattern. Gilmore's extensive research and expertise in Fibonacci ratios laid the groundwork for the identification and application of this pattern in technical analysis.
The Butterfly pattern, like other harmonic patterns, is based on the principle that market movements are not random but follow specific structures and ratios.
The pattern is characterized by a distinct "M" shape in bullish scenarios and a "W" shape in bearish scenarios, each indicating a potential reversal point. These formations are identified by specific Fibonacci retracement and extension levels, making the Butterfly pattern a powerful tool for traders seeking to capitalize on market turning points.
The precise nature of the Butterfly pattern allows for the accurate prediction of target prices and the establishment of strategic entry and exit points, making it an indispensable component of a trader's analytical arsenal.
Bullish :
Bearish :
🔵 How to Use
Like other harmonic patterns, the Butterfly pattern is categorized based on how it forms at the end of an uptrend or downtrend. Unlike the Gartley and Bat patterns, the Butterfly pattern, similar to the Crab pattern, forms outside the wave 3 range at the end of a rally.
🟣 Types of Butterfly Harmonic Patterns
🟣 Bullish Butterfly Pattern
This pattern forms at the end of a downtrend and leads to a trend reversal from a downtrend to an uptrend.
🟣 Bearish Butterfly Pattern
In contrast to the Bullish Butterfly pattern, this pattern forms at the end of an uptrend and warns analysts of a trend reversal to a downtrend. In this case, traders are encouraged to shift their trading stance from buy trades to sell trades.
Advantages and Limitations of the Butterfly Pattern in Technical Analysis :
The Butterfly pattern is considered one of the precise and stable tools in financial market analysis. However, it is always important to pay special attention to the advantages and limitations of each pattern.
Here, we review the advantages and disadvantages of using the Butterfly harmonic pattern :
The main advantage of the Butterfly pattern is providing very accurate signals.
Using Fibonacci golden ratios and geometric rules, the Butterfly pattern identifies patterns accurately and systematically. (This high accuracy significantly helps investors in making trading decisions.)
Identifying this pattern requires expertise and experience in technical analysis.
Recognizing the Butterfly pattern might be complex for beginner traders. (Correct identification of the pattern necessitates mastery over geometric principles and Fibonacci ratios.)
The Butterfly harmonic pattern might issue false trading signals. (Traders usually combine the Butterfly pattern with other technical tools to confirm buy and sell signals.)
🔵 Setting
🟣 Logical Setting
ZigZag Pivot Period : You can adjust the period so that the harmonic patterns are adjusted according to the pivot period you want. This factor is the most important parameter in pattern recognition.
Show Valid Forma t: If this parameter is on "On" mode, only patterns will be displayed that they have exact format and no noise can be seen in them. If "Off" is, the patterns displayed that maybe are noisy and do not exactly correspond to the original pattern.
Show Formation Last Pivot Confirm : if Turned on, you can see this ability of patterns when their last pivot is formed. If this feature is off, it will see the patterns as soon as they are formed. The advantage of this option being clear is less formation of fielded patterns, and it is accompanied by the latest pattern seeing and a sharp reduction in reward to risk.
Period of Formation Last Pivot : Using this parameter you can determine that the last pivot is based on Pivot period.
🟣 Genaral Setting
Show : Enter "On" to display the template and "Off" to not display the template.
Color : Enter the desired color to draw the pattern in this parameter.
LineWidth : You can enter the number 1 or numbers higher than one to adjust the thickness of the drawing lines. This number must be an integer and increases with increasing thickness.
LabelSize : You can adjust the size of the labels by using the "size.auto", "size.tiny", "size.smal", "size.normal", "size.large" or "size.huge" entries.
🟣 Alert Setting
Alert : On / Off
Message Frequency : This string parameter defines the announcement frequency. Choices include: "All" (activates the alert every time the function is called), "Once Per Bar" (activates the alert only on the first call within the bar), and "Once Per Bar Close" (the alert is activated only by a call at the last script execution of the real-time bar upon closing). The default setting is "Once per Bar".
Show Alert Time by Time Zone : The date, hour, and minute you receive in alert messages can be based on any time zone you choose. For example, if you want New York time, you should enter "UTC-4". This input is set to the time zone "UTC" by default.

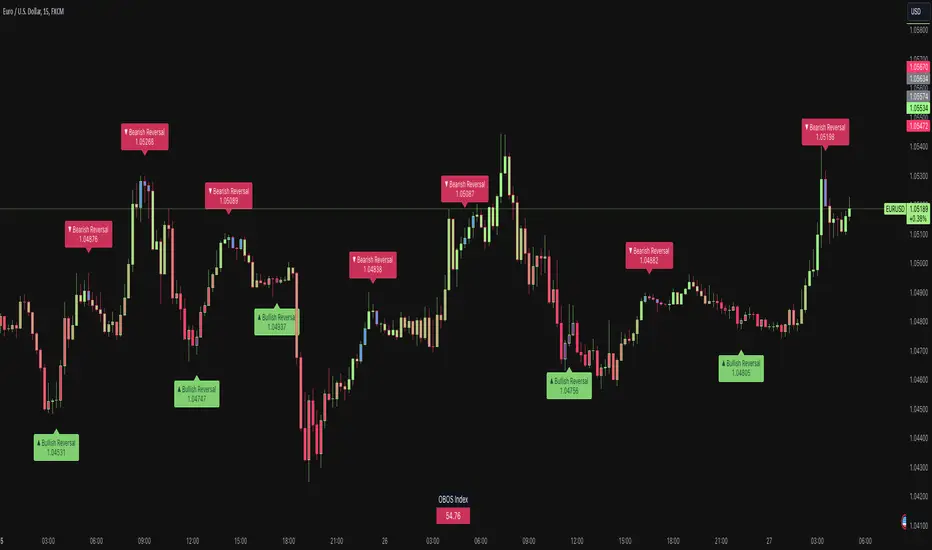
Price & Momentum Reversal Indicator [TradeDots]Price & Momentum Divergence Indicator is a variant of the Chande Momentum Oscillator (CMO), designed to identify reversal patterns in overvalued and undervalued markets. This indicator aims to mitigate the common problem of all oscillating indicators: false buy/sell signals during prolonged market trends, by incorporating a volume-weighted approach and momentum analysis.
📝 HOW IT WORKS
Price Extremeness Calculation
The indicator evaluates the extremeness of the current price by analyzing price changes over a fixed window of candlesticks.
It separates the price changes into positive and negative changes, then multiplies them by the bar volume to obtain volume-weighted values, giving higher significance to bars with larger volumes.
Extremeness Ratio
The ratio is calculated by taking the difference between the total positive changes and total negative changes, and then dividing this result by the sum of the total positive and negative changes.
The result is then smoothed to reduce market noise and rescaled to a range between -100 to 100, where 100 indicates all price changes within the window are positive.
Momentum Analysis
Momentum is calculated by measuring the rate of change of the smoothed extremeness ratio, indicating whether market extremeness is slowing and showing signs of reversion.
Reversal Signal Confirmation
For an asset to be considered a reversal, it has to be in the overvalued or undervalued zone (exceeding the overvalued & undervalued threshold). It must then show a slowed momentum change and a price reversion.
Lastly, candlestick analysis is used to confirm the reversal signal, ensuring there is no room for further breakout price movement.
🛠️ HOW TO USE
Candlestick Visualization
Candlestick bodies are painted with gradient colors representing the smoothed price extremeness (OBOS Index), ranging from -100 (solid red) to 100 (solid green). The exact value is displayed in a table at the bottom right corner.
Slowing price momentum is indicated with blue (bearish) and purple (bullish) colors, showing market pressure from the opposite side.
Reversal Confirmation
A decrease in price momentum combined with a price reversal triggers a signal label on the candlestick, indicating a potential pullback or reversal. This can serve as a reference for better entry and exit points.
⭐️ Premium Features
Higher Timeframe (HTF) Analysis
The indicator includes a feature to apply the same algorithm to a selected higher timeframe, ensuring trend alignment across multiple timeframes.
Alert Functions
Real-time notifications for overvalued and undervalued conditions, allowing traders to monitor trades and reversal signals anywhere and anytime.
❗️LIMITATIONS
Accuracy decreases in volatile and noisy markets.
Extended bullish or bearish market conditions may affect performance.
See Author's instructions below to get instant access to this indicator.
RISK DISCLAIMER
Trading entails substantial risk, and most day traders incur losses. All content, tools, scripts, articles, and education provided by TradeDots serve purely informational and educational purposes. Past performances are not definitive predictors of future results.
Advanced Fully Reversed Candles with Reversed IchimokuThe "Advanced Fully Reversed Candles with Reversed Ichimoku" indicator is a sophisticated tool designed for traders who seek a unique perspective on market dynamics. This innovative indicator not only reverses the traditional candlestick chart but also inverts the Ichimoku Cloud components, providing a comprehensive view of the market's inverted behavior.
Key Features:
Reversed Candlestick Chart:
The indicator recalculates the OHLC (Open, High, Low, Close) prices by reversing them along the price axis. This means that what typically would be an upward movement is displayed as a downward movement, and vice versa. This reversal provides an alternative view that can help traders identify hidden patterns and potential reversal points that might not be obvious on a standard chart.
Reversed Ichimoku Cloud:
All components of the Ichimoku Cloud indicator are recalculated based on the reversed price data. This includes:
Tenkan-sen (Conversion Line): Reversed based on the highest and lowest prices over the specified period.
Kijun-sen (Base Line): Reversed in a similar manner to the Tenkan-sen, providing a medium-term perspective on price trends.
Senkou Span A (Leading Span A): Reversed to form one boundary of the Kumo (cloud), offering insight into future support and resistance levels.
Senkou Span B (Leading Span B): Reversed to form the other boundary of the Kumo, complementing Senkou Span A.
Chikou Span (Lagging Span): Reversed and plotted backward for additional confirmation of trend direction and strength.
Dynamic Price Range Calculation:
The indicator dynamically calculates the maximum and minimum prices over the last 500 bars (or the available range if fewer bars are present). This ensures that the reversal is always based on the most relevant data, providing accurate and up-to-date visualizations.
Visual Enhancements:
The reversed candlesticks are color-coded for easy interpretation: green for upward movements and red for downward movements, based on the reversed data.
The Ichimoku Cloud is filled with semi-transparent colors to clearly distinguish between bullish and bearish conditions even in its reversed state.
Debugging Aids:
For transparency and accuracy, the indicator plots the maximum and minimum price lines used for the reversal calculations. This allows users to verify the internal workings of the indicator and ensure the reversal logic is correctly applied.
Usage:
This indicator is ideal for advanced traders and analysts who want to explore market behavior from an unconventional angle. By reversing both the candlestick chart and the Ichimoku Cloud, it provides a unique perspective that can uncover new trading opportunities and enhance market analysis.
Customization:
Users can customize the periods for the Tenkan-sen, Kijun-sen, and Senkou Span B, as well as the displacement for the Ichimoku Cloud. This flexibility allows traders to adapt the indicator to their specific trading strategies and timeframes.
Conclusion:
The "Advanced Fully Reversed Candles with Reversed Ichimoku" indicator is a powerful tool that transforms traditional market analysis. By inverting both price movements and key technical indicators, it opens up a new dimension of trading insights, helping traders to see the market in a completely different light.
Parameters:
Tenkan-sen period (default: 9)
Kijun-sen period (default: 26)
Senkou Span B period (default: 52)
Displacement (default: 26)
How to Apply:
Add the script to your TradingView account via the Pine Editor.
Customize the parameters according to your trading strategy.
Analyze the reversed candlestick chart and Ichimoku Cloud to gain unique insights into market trends and potential reversal points.

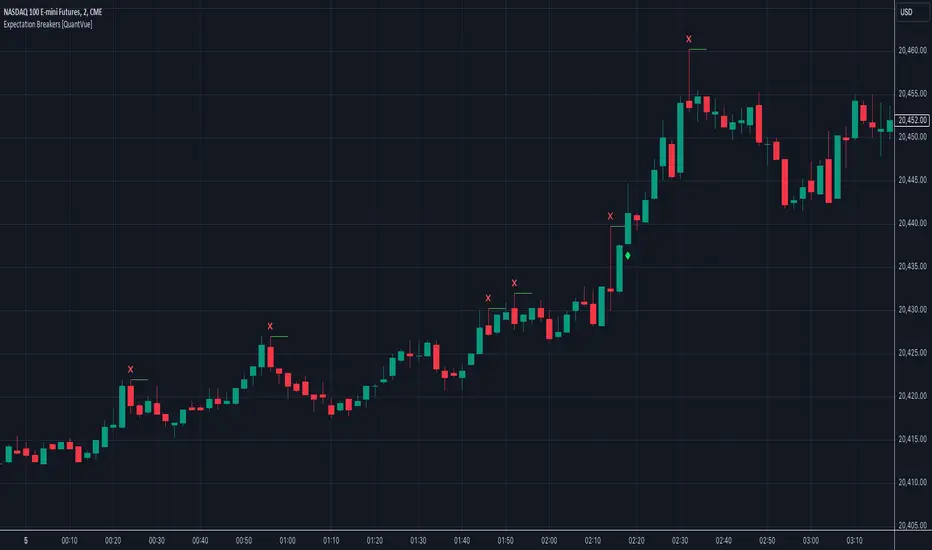
Expectation Breakers [QuantVue]In technical analysis, an "Expectation Breaker" refers to a market event where price action defies typical patterns and anticipated movements, signaling potential shifts in market sentiment and direction.
This indicator looks to take advantage of these opportunities by identifying 2 types of Expectation Breakers: Downside Reversal Buybacks and Upside Reversal Sellbacks.
Downside Reversal
A downside reversals occur when a stock reaches a new high for the user defined lookback period (65 bars by default), and then experiences a larger-than-average drop and closes near its lows. This usually indicates that the market has overextended itself. The expectation is that there will be 2-3 bars of significant selling, following the downside reversal.
However, a notable sign of strength is if the stock rebounds and closes above the downside reversal bar's high within 1-3 bars. This is known as a Downside Reversal Buyback. A rapid recovery following a downside reversal is a powerful bullish indicator, breaking the expectation of lower prices. The quicker price recovers from a downside reversal, the more meaningful it is. Such a swift rebound suggests that the market's strength was underestimated, as downside reversals typically signal a short-term decline.
Upside Reversal
An upside reversal occurs when a stock reaches a new low for the user-defined lookback period (65 bars by default), and then experiences a larger-than-average rise and closes near its highs. This usually indicates that the market has overextended itself to the downside. The expectation is that there will be 2-3 bars of significant buying, following the upside reversal.
However, a notable sign of weakness is if the stock falls back and closes below the upside reversal bar's low within 1-3 bars. This is known as a Upside Reversal Sellback. A rapid fallback following an upside reversal is a powerful bearish indicator, breaking the expectation of higher prices. The quicker price falls back from an upside reversal, the more meaningful it is. Such a swift fallback suggests that the market's weakness was underestimated, as upside reversals typically signal a short-term rally.
The Expectation Breakers indicator identifies these opportunities by first identifying new highs and lows within a defined lookback period. It then compares the true range (TR), average true range (ATR), and closing range to confirm the significance of these reversals. The use of TR and ATR ensures that the reversals are substantial enough to indicate a genuine shift in market sentiment, helping to identify when price action breaks expectations.
Give this indicator a BOOST and COMMENT your thoughts below!
We hope you enjoy.
Cheers!
Price Reversal Probability + Price Forecast [TradeDots]The TradeDots Price Reversal Probability + Price Forecast Indicator helps traders discern market direction and identify potential trading opportunities.
📝 HOW IT WORKS
The indicator provides two types of reversal signals:
Bullish Reversal: Marked with a green label, indicating an expected upward market reversal.
Bearish Reversal: Marked with a red label, indicating an expected downward market reversal.
⭐️ Computation
This tool identifies significant reversal patterns using a mathematical model on a designated window of candlesticks to calculate price action changes. It incorporates candlestick data and price indicators, such as the Open, Close, High, Low of candlesticks and Average True Range (ATR), to detect similar occurrences in real-time.
Potential market turning points are marked with reversal labels and percentage changes , calculated using pivot high or low price data from the last reversal patterns of the opposite side.
For example, a green label on the chart indicates a bullish reversal pattern, showing the market is expected to reverse upward. However, signals are based on historical price actions and are not 100% accurate. If the price breaks down from the bullish reversal pivot low, the original signal will turn half transparent until the next reversal pattern is detected.
The algorithm groups consecutive bullish reversal patterns until a bearish reversal pattern appears. The last bullish label occurrence indicates the maximum number of bullish patterns required to confirm a reversal in the group. This information is stored to apply Bayesian statistical models and probability models to generate market insights.
⭐️ Statistical Analysis
Reversal signals are categorized into bullish and bearish groups, with each group storing consecutive reversal signals.
In the indicator table, each new reversal is labeled sequentially (e.g., "🟢 #1" for the first bullish reversal after a bearish signal). The number increases for each new signal on the same side and resets when a reversal signal on the opposite side appears.
The indicator provides two forecasts: the probability of reversal and the expected price change if the pattern is successful or unsuccessful.
⭐️ Probability of Reversal
By counting the number of consecutive reversal patterns on one side before a reversal pattern on the opposite side appears, we can calculate the probability of reversal of each signal throughout the entire price action history.
Using Bayes’ Theorem, the probability increases with each consecutive pattern. The values are displayed in the first two columns of the indicator table, with the current condition highlighted in orange.
⭐️ Price Forecast
The price forecast uses the pivot point of the last reversal pattern of the opposite side as a reference for calculating the percentage change.
For example, for a group of bullish patterns, the pivot high of the most recent bearish pattern is taken. A percentage is calculated with the pivot low of all bullish patterns in the same group. Repeating this model throughout the entire historical price action patterns gives the average price percentage difference between all bearish and bullish patterns.
Whenever a new reversal pattern is detected, a price can be forecasted using the percentage difference from the statistical model. The target price is calculated and displayed in the third and fourth columns of the indicator table.
Assisting Traders To Make Data-Informed Trading Decisions
All included features in this indicator:
Labeling of bullish and bearish reversal patterns
Success probability of each reversal pattern
Price targets of each reversal pattern
Visual aid for pattern confirmation
More (check the changelog below for current features)
🛠️ HOW TO USE
⭐️ Reversal Signals
There are two types of reversal signals identified by the algorithm that detects reversal patterns using price action analysis with candlestick data and price indicators. When the price breaks out from the labeled pivot, the label will turn half transparent.
Bullish reversal signals: Labeled in green. The number represents the price of the candlestick "low," and the percentage value indicates the price difference from the previous bearish reversal pattern's candlestick "high."
Bearish reversal signals: Labeled in red. The number represents the price of the candlestick "high," and the percentage value indicates the price difference from the previous bullish reversal pattern's candlestick "low."
⭐️ Probability Table
The probability table shows the likelihood of reversal for each number of occurrences of bullish and bearish reversal signals, displayed in the first two columns.
It also shows the target prices for both bullish and bearish conditions for each number of reversal patterns.
⭐️ Price Targets
By combining the probability of reversal and the price forecast, price targets for new reversal patterns are calculated. These insights help traders align their strategies with price action analysis and statistics by simply observing the candlestick chart in real-time.
Bullish Price Target: The average percentage price and probability that the next bearish reversal signal might hit.
Bearish Price Target: The average percentage price and probability that the next bullish reversal signal might hit.
⭐️ Market Trend Panel
The market trend panel is a small table that indicates the market trend using a 200 Exponential Moving Average (EMA) alongside reversal signals. A bullish reversal pattern above the moving average indicates a "bullish" market, while a bearish reversal pattern below it indicates a "bearish" market. If the price fluctuates around the moving average, it is identified as "choppy."
The panel also shows the risk and reward for each trade by taking the closing bullish and bearish targets from the most recent reversal pattern's price reference. Lastly, it displays the probability of reversal, consistent with the number highlighted in the probability table.
⭐️ Other Visual Aid
Other visual aids visualize the market trend and potential direction for users on the candlestick chart.
Background colors reflect the current market trend (green = bullish, red = bearish, blue = choppy).
A white plotted line represents the moving average for categorizing market trends.
❗️LIMITATIONS
Price targets represent only the mean of percentage differences. Therefore, the price could reverse before hitting either side of the price target.
When the market is in extreme price action or a new market pattern, the price targets may not be forecasted accurately and might move out of the model's range.
This model works best for assets with less price variation and a near-Gaussian distribution in returns. It may be less accurate for assets with random price movements.
CONCLUSION
This indicator uses fundamental statistics and mathematical models to generate reversal probabilities and price forecasts. It does not have the ability to predict the future with certainty. Traders should combine this indicator with other confirmation strategies to make informed investment decisions.
See Author's instructions below to get instant access to this indicator.
RISK DISCLAIMER
Trading entails substantial risk, and most day traders incur losses. All content, tools, scripts, articles, and education provided by TradeDots serve purely informational and educational purposes. Past performances are not definitive predictors of future results.
NOTES*
Calculations are based on historical data and do not guarantee future results.
Reversals exceeding ten consecutive occurrences are rare (likely <1% of total occurrences).
Users SHOULD NOT blindly follow the price targets as their trading strategy.
If you encounter a timeout with this indicator, reapply it to your chart.
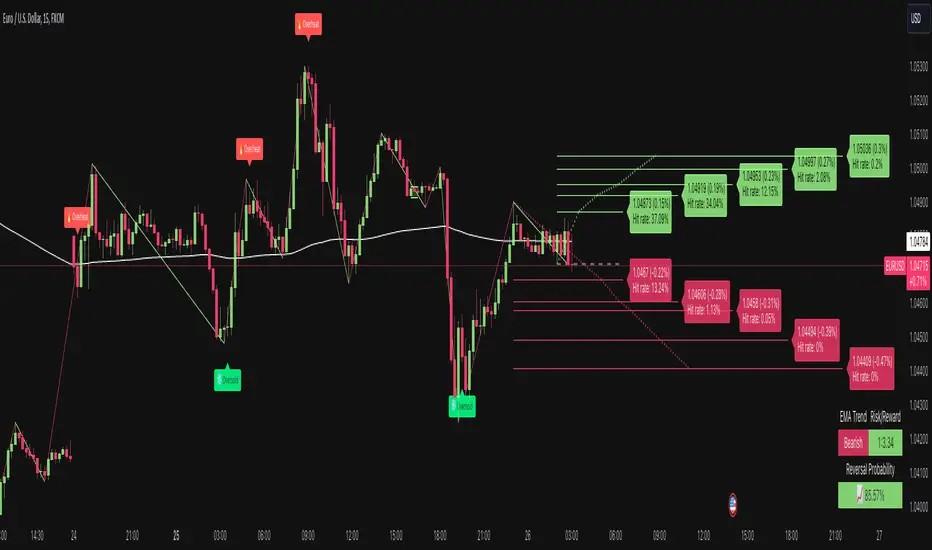
Reversal Candlestick Structure [LuxAlgo]The Reversal Candlestick Structure indicator detects multiple candlestick patterns occurring when trends are most likely to experience a reversal in real-time. The reversal detection method includes various settings allowing users to adjust the reversal detection algorithm more precisely.
A dashboard showing the percentage of patterns detected as reversals is also included.
🔶 USAGE
Candlestick patterns are ubiquitous to technical analysts, allowing them to detect trend continuations, reversals, and indecision.
The proposed tool effectively detects reversals by using the confluence between candlestick patterns and a reversal detection method based on the stochastic oscillator, acting as a filter for the patterns. If a candlestick pattern occurs while conditions suggest a potential reversal then the pattern is highlighted.
The displayed candle coloring allows users to observe the reversal detection method, with colored candles indicating potential reversals.
Users wanting to detect longer-term reversals can use a higher "Trend Length" setting, this can however lead to an increased amount of displayed candlestick patterns.
To prevent false positives users also have control over a "Threshold" setting in a range between (0, 100), with values closer to 100 preventing candlesticks from being detected at the start of trends.
The "Warmup Length" serves a similar purpose, and aims to prevent sudden moves to be classified as reversals. Higher values of this setting will require trends to be established for a longer period of time for reversal conditions to be detected.
🔹 Dashboard
To evaluate the role of individual candlestick patterns as potential reversal signals relative to the proposed reversal detection method, a dashboard displaying the percentage of candlestick patterns displayed (that occur when a potential reversal is detected) over the total amount detected.
Hovering on the dashboard cells of the "Reversal %" column allows displaying the total amount of patterns detected.
🔶 CANDLESTICKS PATTERNS
This tool detects 16 popular candlestick patterns, each listed in the sub-sections below.
🔹 Bullish Patterns
Hammer - A bullish reversal pattern that forms after a decline, characterized by a small body at the upper end of the trading range and a long lower shadow.
Inverted Hammer - A bullish reversal pattern that forms after a downtrend, featuring a small body at the lower end of the trading range and a long upper shadow.
Bullish Engulfing - A bullish reversal pattern where a small bearish candlestick is followed by a larger bullish candlestick that completely engulfs the previous candle.
Rising 3 - A bullish continuation pattern that consists of a long bullish candlestick followed by three smaller bearish candlesticks and then another long bullish candlestick.
3 White Soldiers - A bullish reversal pattern consisting of three consecutive long bullish candlesticks, each opening within the previous candle's body and closing higher.
Morning Star - A bullish reversal pattern made up of three candlesticks: a long bearish candlestick, followed by a short candlestick, and then a long bullish candlestick.
Bullish Harami - A bullish reversal pattern where a small bullish candlestick is completely within a previous larger bearish candlestick.
Tweezer Bottom - A bullish reversal pattern identified by an initial bullish candle, followed by a bearish candle, both having equal lows.
🔹 Bearish Patterns
Hanging Man - A bearish reversal pattern that forms after an uptrend, characterized by a small body at the upper end of the trading range and a long lower shadow.
Shooting Star - A bearish reversal pattern that forms after an uptrend, featuring a small body at the lower end of the trading range and a long upper shadow.
Bearish Engulfing - A bearish reversal pattern where a small bullish candlestick is followed by a larger bearish candlestick that completely engulfs the previous candle.
Falling 3 - A bearish continuation pattern that consists of a long bearish candlestick followed by three smaller bullish candlesticks and then another long bearish candlestick.
3 Black Crows - A bearish reversal pattern consisting of three consecutive long bearish candlesticks, each opening within the previous candle's body and closing lower.
Evening Star - A bearish reversal pattern made up of three candlesticks: a long bullish candlestick, followed by a short candlestick, and then a long bearish candlestick.
Bearish Harami - A bearish reversal pattern where a small bearish candlestick is completely within a previous larger bullish candlestick.
Tweezer Top - A bearish reversal pattern is identified by an initial bullish candle, followed by a bearish candle, both having equal highs."
🔶 SETTINGS
🔹 Patterns
Group including toggles for each of the supported candlestick patterns. Enabled toggles will allow detection of the associated candlestick pattern.
🔹 Reversal Detection
Trend Length: Determines the sensitivity of the reversal detection method to shorter-term variation, with higher values returning a detection method more sensitive to longer-term trends.
Threshold: Determines how easy it is for the reversal detection method to consider a trend at an extreme point.
Warmup Length: Warmup period in the reversal detection method, longer values will require a longer-term trend to detect potential reversals.
🔹 Style
Color Candles: Enable candle coloring on the user chart based on the reversal detection method.
Use Gradient: Use a gradient as candle coloring.
Label Size: Size of the labels displaying the detected candlesticks patterns.
🔹 Dashboard
Show Dashboard: Display the dashboard on the user chart when enabled.
Location: Dashboard location on the user chart.
Size: Size of the displayed dashboard.

Swing Failure Pattern (SFP) [LuxAlgo]The Swing Failure Pattern indicator highlights Swing Failure Patterns (SFP) on the user chart, a pattern occurring during liquidity generation from significant market participants.
A Confirmation level used to confirm a trend reversal is also included. Users can additionally filter out SFP based on a set Volume % Threshold .
🔶 USAGE
Swing failure patterns occur when candle wicks exceed (above/below) a recent swing level but close back below/above it, and occur from more significant market participants engineering liquidity. This pattern can be indicative of a potential trend reversal.
A label and an accentuated wick line highlight the SFP (both can be disabled).
Using a higher "Swings" period will not return different SFP but will however potentially reduce their detection rate.
🔹 Confirmation Level
The confirmation level is the highest point between the previous swing and SFP for a bullish SFP, and the lowest point for a bearish SFP. This level allows confirming a trend reversal after an SFP once the price breaks it.
A small triangle will be displayed when the price closes beyond the confirmation level.
A more reactive and contrarian approach could use the SFP as an entry point, and the confirmation level for taking (partial) profit, or stop loss. The example below shows a possible scenario:
🔹 Volume % Threshold
During the occurrence of an SFP, the Volume % Threshold option allows comparing the cumulative volume outside the Swing level to the total volume of the candle. The following options are included:
Volume outside swing < Threshold: Volume outside the Swing level needs to be lower than x % of total candle volume. Prevent excessive liquidity generation.
Volume outside swing > Threshold: Volume outside the Swing level needs to be higher than x % of total candle volume. Requires more significant liquidity to be generated.
None: No extra filter is applied
Note that in the above case, the left SFP is no longer highlighted because the volume above the swing level was higher than the 25% threshold of the total volume.
When we change the setting to "Volume outside swing > Threshold", we get the reversed situation.
The "Volume outside Swing level" is obtained using intrabar - Lower TimeFrame (LTF) data.
At the intrabar (LTF) level, there are a maximum of 100K bars available. When using the Volume % Threshold filter, a vertical line will highlight the maximum period during which intrabars are available.
🔶 DETAILS
🔹 LTF Settings
When 'Auto' is enabled (Settings, LTF), the LTF will be the nearest possible x times smaller TF than the current TF. When 'Premium' is disabled, the minimum TF will always be 1 minute to ensure TradingView plans lower than Premium don't get an error.
Examples with current Daily TF (when Premium is enabled):
500 : 3-minute LTF
1500 (default): 1-minute LTF
5000: 30 seconds LTF (1 minute if Premium is disabled)
The concerning LTF can be seen at the right-top (default) corner.
🔶 SETTINGS
Swings: Period used for the swing detection, with higher values returning longer-term Swing Levels.
Bullish SFP: enable/disable bullish Swing Failure Patterns.
Bearish SFP: enable/disable bearish Swing Failure Patterns.
🔹 Volume Validation
Validation:
Volume outside swing < Threshold: The volume outside the swing level needs to be lower than x % of the total volume.
Volume outside swing > Threshold: The volume outside the swing level needs to be higher than x % of the total volume.
None: No extra validation is applied.
Volume % Threshold: % of total volume as threshold.
Auto + multiple: Adjusts the initial set LTF
LTF: LTF setting
Premium: Enable when your TradingView plan is Premium or higher
🔹 Dashboard
Show Dashboard: Display applied Lower Timeframe (LTF)
Location: Location of the dashboard
Size: Size of the dashboard
🔹 Style
Swing Lines
Confirmation Lines
Swing Failure Wick
Swing Failure Label
Lines / Labels: Color for lines and labels
SFP Wicks: Color for SFP wick line

Double Inside bar // Consecutive Inside Bar = Ak47Double Inside Bar Indicator Or Consecutive Inside Bar Highlighting
This custom Pine Script indicator is crafted for traders who utilize the traditional Inside Bar . A Double Inside Bar is a more specific pattern, involving two consecutive bars that are both contained within the range of a preceding "mother bar". This script not only detects these patterns but also emphasizes consecutive occurrences with a distinctive visual marker, aiding traders in identifying these setups amidst market fluctuations.
Features:
Double Inside Bar Detection: Identifies Double Inside Bars, where two successive bars are completely contained within the range of the preceding bar. This pattern indicates potential continuation or reversal with a stronger conviction.
Consecutive Pattern Highlighting: Highlights consecutive Double Inside Bar patterns, offering a clear visual indication for traders. This feature can be enabled or disabled as per the user's preference.
Bullish and Bearish Color Coding: Differentiates bullish and bearish setups by coloring the bars green or red, respectively, providing immediate insights into market sentiment.
Unique Visual Markers: Utilizes shapes to indicate bullish (triangle up) and bearish (triangle down) Double Inside Bars. For consecutive patterns, irrespective of being bullish or bearish, a yellow diamond is displayed below the bar to focus on the pattern's potential for signaling substantial market moves.
Trading Strategy:
Buy Signal: When a Double Inside Bar pattern is detected, a buy signal is generated. The entry point for the trade is set just above the high of the mother bar, with a stop loss placed just below the low of the mother bar, aiming to capture upward breakouts effectively.
Sell Signal: A sell signal is indicated by the detection of a Double Inside Bar pattern. The trade entry is positioned just below the low of the mother bar, with a stop loss above the high of the mother bar, targeting potential downward breakouts.
Why Use This Indicator?
Enhanced Decision Making: By providing clear visual cues for Double Inside Bar patterns and especially emphasizing consecutive occurrences, traders can make more informed and confident decisions.
Adaptability: The ability to toggle the highlighting for consecutive patterns allows traders to customize the indicator to match their trading style and the prevailing market conditions.
Simplicity and Effectiveness: This indicator streamlines the detection of significant Double Inside Bar patterns, helping traders to focus on their strategy and manage their time more efficiently.
Conclusion
This Double Inside Bar Indicator is a vital tool for traders looking to leverage the predictive power of Double Inside Bar patterns. With its unique consecutive highlighting feature and intuitive color coding, it enhances trading strategies by pinpointing potential breakout opportunities with higher precision.
