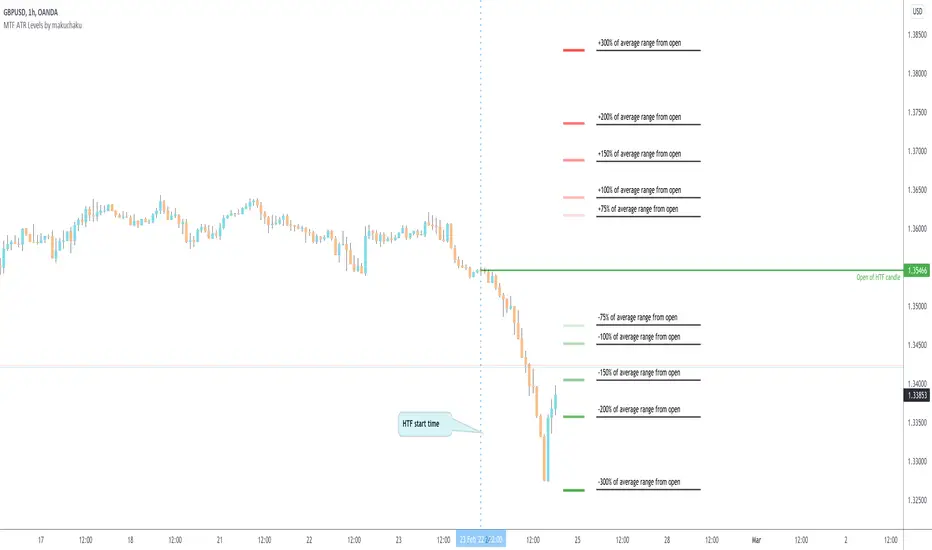
MTF ATR Levels by makuchakuKnowing how big a range one is operating in (from a higher time frame perspective) is very important to understand where the reversals could potentially come from.
This indicator uses the closing price of previous HTF candle and plots its ATR range - and several levels on top of it.
+/- 75%
+/- 100%
+/- 150%
+/- 200%
+/- 300%
Reversals
ATR Volume DivergenceThe indicator measures ATR relative to VOLUME of each candle, marks the candles where there is more volume than in the previous one, but a lower ATR - signifying a compression in price movement - resistance. It also marks the candle where there is a greater ATR than in the previous candle, but lower volume - signifying an expansion in price movement - vacuum.
P.S. Bring indicator to FRONT to see the colored candles clearly

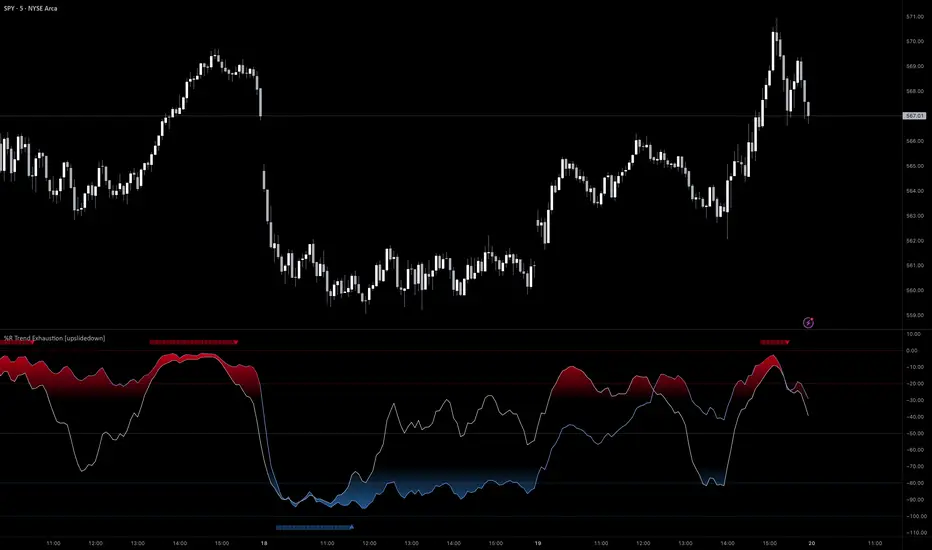
%R Trend Exhaustion [upslidedown]I love Williams %R! This indicator mixes two %R periods... a standard %R with a longer period %R. The longer period of 112 has interesting results for trend following strategies in the crypto market through backtesting.
Alone these are fairly ordinary but together they provide a very interesting trend exhaustion/reversal system while filtering out some noise. I have highlighted key areas of interest with filled boxes. An "area of interest" is when there is confluence between the short and long period %R values along with being overbought or oversold. Once there is a break in the overbought or oversold trend, an arrow will print.
This is one of my odder ideas that appears to have some merit and detects interesting tops or bottoms (or confirms a trend reversal) so I'm publicly publishing for the community to find. If you find this useful please reach out and let me know how you use it as it's fairly unique... and thus different than anything I've ever seen or used.
RSI CCI Correlating Oscillator (RCCO) by empowerTRCCO is pronounced "ree-koh" or "rico".
The RCCO is simply the plot of the values of both the RSI and CCI added together.
The RCCO makes some adjustments though, so that both the RSI and the CCI will fit correctly on the same scale - and so that these adjustments for scale allow reversals to be detected at crossings.
When the CCI crosses from underneath to up above the RSI, this is usually a bullish reversal. Alternatively, when the CCI crosses from above to back under the RSI, that usually signals a bearish trend. Look for the widest swings you can find to ensure good momentum. The larger the volume, the clearer and more decisive the trends. Low volume will lead to ranging and lazy momentum. High volume will create clear and forceful trends. The lowest negative RCCO in a timeframe, and then add some high volume... and you have yourself a good setup for a successful trade.
Because the RSI and CCI are adjusted, you may not recognize their values from having used the respective indicators on their own. The RSI and CCI values are less important. What matters with this indicator are the crossings and the RCCO value. The RCCO value should be negative, preferably, a deeply negative value. Look at the historical chart for the target per your selected timeframe and decide what values work for you.
I hope you enjoy the RCCO and that it can help you become a little más RICO!

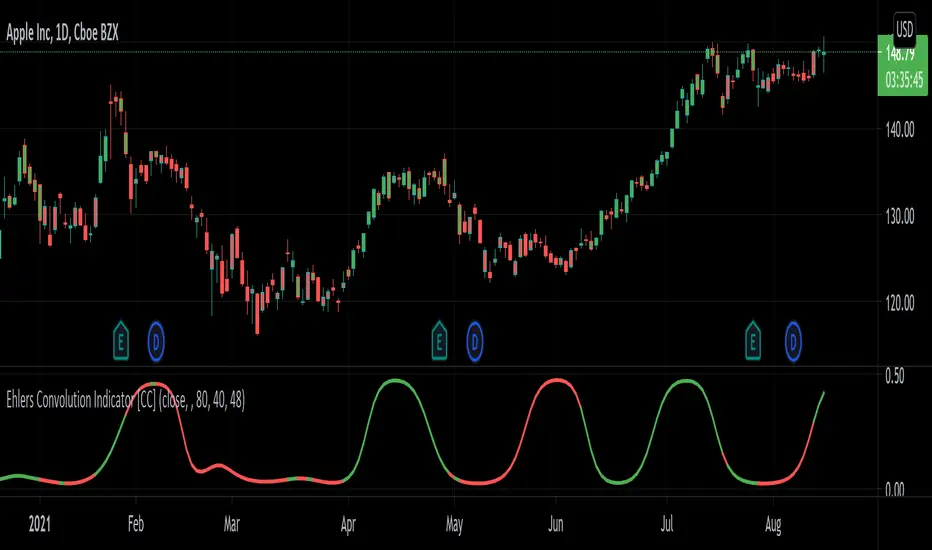
Ehlers Convolution Indicator [CC]The Convolution Indicator was created by John Ehlers (Cycle Analytics For Traders pgs 170-174) and this is version of an indicator to find potential reversal points. The idea behind this indicator is to use a variation of his AutoCorrelation Indicator that transforms the data using digital signal processing and as you can see it looks very similar to his BandPass Filter . The idea is that when this indicator peaks then it has reached a potential reversal point and so the stock may continue in the current direction but most of the time this indicator correctly points out the reversal points. I have included normal buy and sell signals but generally speaking you would want to buy when the indicator is around 0.05 to 0.10 and moving up and sell when it reaches its peak and is starting to move down.
Let me know if you have any other scripts you would like to see me publish!
ArcTan Oscillator [LuxAlgo]The following indicator is a normalized oscillator making use of the arc tangent sigmoid function (ArcTan), this allows to "squarify" the output result, thus visually filtering out certain variations originally in the oscillator. The magnitude of this effect can be controlled by the user. The indicator contains a gradient that shows the possibility of a reversal, with red colors indicating that a reversal might occur.
Settings
Length : Period of the oscillator
Pre-Gain : Changes the amplitude of the oscillator before passing through the ArcTan function, this allows to amplify/reduce the "squarification" effect introduced by this function. In order to make it easier for the user, the setting is in a (-10,10) range, with negative values reducing the amplitude and positive one increasing it.
Src : Source input of the indicator
Usage
The oscillator can be used to determine the direction of the trend by looking at its sign, if the oscillator is positive, market is up-trending, else down-trending, based on this usage the user might not be interested to look at every variations produced by the oscillator, this is where the hyperbolic tangent function and pre-gain setting can be useful, by using an high value of pre-gain the user will be able to only focus on the sign of the oscillator.
Here pre-gain is set to 5, we can see that the oscillator is now easier to visualize. However, the use of sigmoid functions remove useful information for a trader that needs to find divergences, this is where using a negative value of the pre-gain setting will result useful.
Here pre-gain is set to -5.
The indicator makes use of a gradient to show potential reversals, this gradient is determined by the correlation between the oscillator and the price (this is a way to measure potential divergences). If the color is closer to red it means that a potential reversal might occur, it is possible to say in which direction price might go by looking at the sign of the oscillator, so if the gradient is red and the oscillator is negative price might rise. The gradient is not affected by the pre-gain setting.

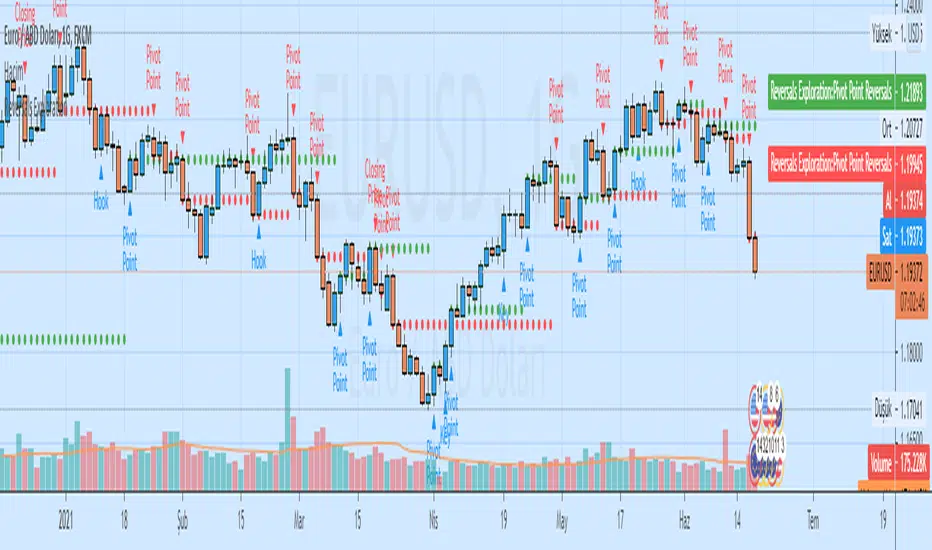
Auto Analysis Short-term Reversals ExplorationAuto Analysis Short-term Reversals Exploration
Based on a study by Larry Lovrencic
Closing Price Reversals Automatic Analysis
Hook Reversals Automatic Analysis
Island Reversals Automatic Analysis
Key Reversals Automatic Analysis
Open/Close Reversals Automatic Analysis
Pivot Point Reversals Automatic Analysis
ETS MA Deviation ExtremesWhile trading, I noticed that emphasis is often placed on how far price has moved from the moving average (whichever a trader prefers). In these cases I also found that Bollinger Bands only sometimes played a factor in determining whether price had moved "too far" from the moving average to potentially result in a sharp move back to the average.
Because I wanted something more objective than a "gut feeling" that price has moved away from the average enough to make it move back, I decided to see what I could do to determine the standard deviation of how price action moved away from the average , in order to determine when it could potentially have a "rubber band effect" to jump back to the "norm". The result of that is the ETS MA Deviation Extremes indicator, and I hope that it will help you in your trading.
The indicator also has bar coloring included, which can be turned off, which gives a good on-chart visual to warn you that the price action might reverse. This has often helped me to be a bit more cautious before just jumping into a trade that might be on the brink of reversing and taking my position out, and it actually turned out to be a good indicator for a reversal trade strategy.
The histogram bars give an indication of how far the price has moved away from the average, and I look for a potential reversal as soon as the histograms move back inside the deviation lines after having been outside it. The bar coloration actually depend on more than one set of deviation lines, but putting all of that on the chart just makes it confusing, so I removed the ones that I felt were not essential to make it clearer.
I hope it helps you in your trading and makes it easier for you to trade successfully!

VPTbollfib & Camarilla (Danarilla)I do not own the original indicators. This is just a combination of the two because of their nature to work in a similar way.
Camarilla Pivots run on the basis of intraday range trading. Usually after daily open you look the fade whatever move happened before. by shorting R3/H3 levels or longing R3/L3. Targeting the other side of the range. This is the infamous PivotBoss level calculations and you would want to activate camarilla and turn off the normal pivots. They use the previous days volatility to plot the next days levels.
But what about some confirmation?
Well RafaelIzoni (who made it open source for improvement) threw together this VPTbollfib. It is volume price trend crossing down a fib line using bollinger bands as price envelope. The beauty of this is that It will signal usually counter to current price action based on selling into uptrends or vise versa. Meaning you get signals to counter price. Which is what you might be looking for on range day trade scalps for camarilla. A wick reversal or engulfing + volume based signal is a very happy pairing together. And those signals are usually suitable for the target of the range you are day trading. Hourly time frame works quite well for both. And camarilla should also be on daily settings.
Special Thanks to Nanda (who published the pivotboss indicator AND) Helped to merge the scripts together.
This indicator alone is an entire trade system. Camarilla already is. If you know the rules. it can be used for entries, exits, risk management to trade the range on TREND, COUNTER TREND, and BREAKOUT plays. The bollinger band fibs add confirmation to the trends levels. And the VPT adds a secondary confirmation to take a camarilla trade.
Try it out. I think you will find both the levels on camarilla and the VPT signals quite suprising.

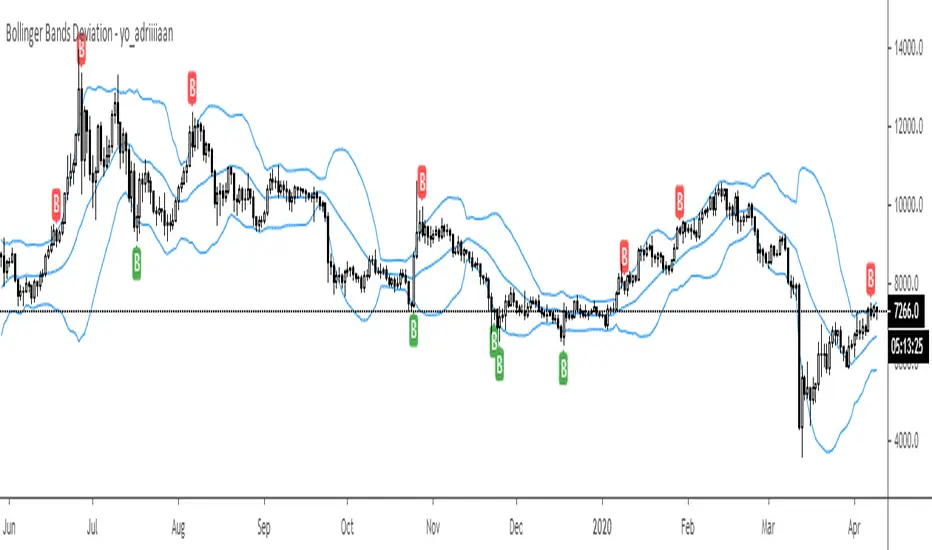
Bollinger Bands Deviation - yo_adriiiiaanBollinger Band Deviations
In theory price trades within 2 standard deviations 95% of the time. This is an attempt to capture that 5% that deviates from the bands.
Useful for taking profit or signaling a reversal.
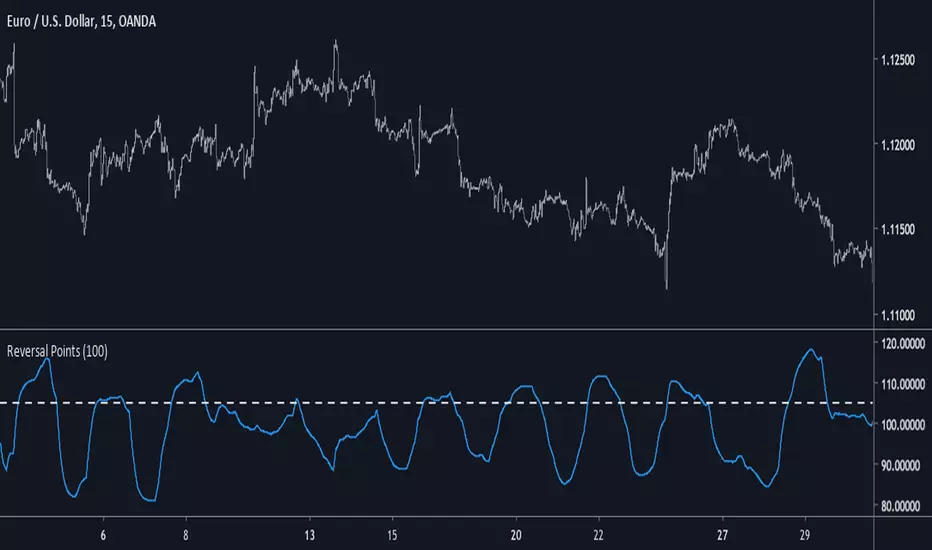
Reversal PointsIntroduction
This indicator is inspired from the mass index indicator with the goal of telling the user when a trend is about to stop thus highlighting potential reversals.
The Indicator
When the indicator cross under the trigger line the trend is about to stop and may reverse, shorter length will spot shorter terms reversals but a length of 100 is a good value.
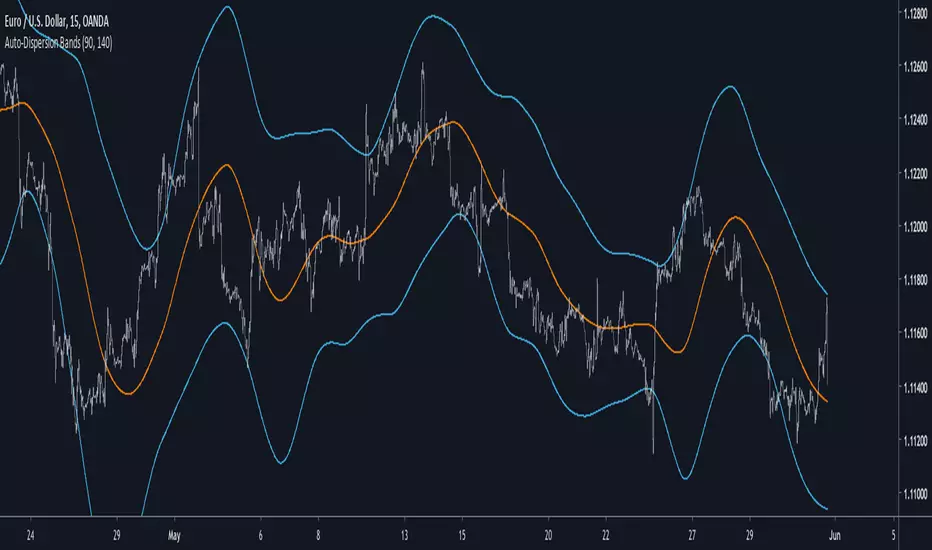
Auto-Dispersion BandsIntroduction
A really old indicator as well, thus i have no much ideas of what is going on with it, but i know that those bands returns good reversals points. The indicator don't use standard deviation, instead its a simple differencing of the price and the price length bars back who will provide a dispersion measurement, thus the name auto-dispersion.
The Indicator
The smooth parameter allow the band to cross the price, if smooth is low the chance of crosses are lower.
smooth = 3
Market direction and pullback based on S&P 500.A simple indicator based on www.swing-trade-stocks.com The link is also the guide for how to use it.
0 - nothing. If the indicator is showing 0 for a prolonged amount of time, it is likely the market is in "momentum mode" (referred to in the link above).
1 - indicates an uptrend based on SMA and EMA and also a place where a reversal to the upside is likely to occur. You should look only for long trades in the stock market when you see a spike upwards and S&P 500 is showing an obvious uptrend.
-1 - indicates a downtrend based on SMA and EMA and also a place where a reversal to the downside is likely to occur. You should look only for short trades in the stock market when you see a spike upwards and S&P 500 is showing an obvious uptrend.

Pivots High/Low 3bar No Period w/ Signals -Tom1traderwww.tradingview.com
This price action indicator calculated on the relationship of 3 adjacent bars/candles adds an extra dimension to my indicator mix and with
a different perspective can help confirm or question an opinion formed by other indications (volume related, momentum, the chart itself and etc.).
Further, I have traded with it a bit now and like it. So much for comfort - I have seen no clear evidence that the movement of the next bar is paying any
attention to indicators, lines or patterns on charts. They are all based on the same historical data whether that data is run through an indicator algorithm
or used to draw (chart style) on a chart. But they make me feel better about my trades and I prefer them to a coin flip. :-)
Pivot High Definition - (Pivot Low is reversed): A three-bar pivot high represents resistance and is formed when sellers turn price from up to down. It is seen where a price bar with a lower high closes below the previous bar's low, where the previous bar's high is higher than the bar that preceded it.
Read more: Price Pivots Circle Big Profits www.investopedia.com
Follow us: Investopedia on Facebook
I see some n period high/low indicators named pivots. This indicator has no period and is based on the relationship of 3 bars usually referred to as Pivots High Low.
Also no relationship to daily calculated "Pivot Points". As such this is a PRICE ACTION indicator. It works the same on ALL TIME FRAMES.
These pivots sometimes do not occur very often and usually are not at tops or bottoms.
This is why I used a combination of most recent PHs and PLs along with
the price to derive the signal.

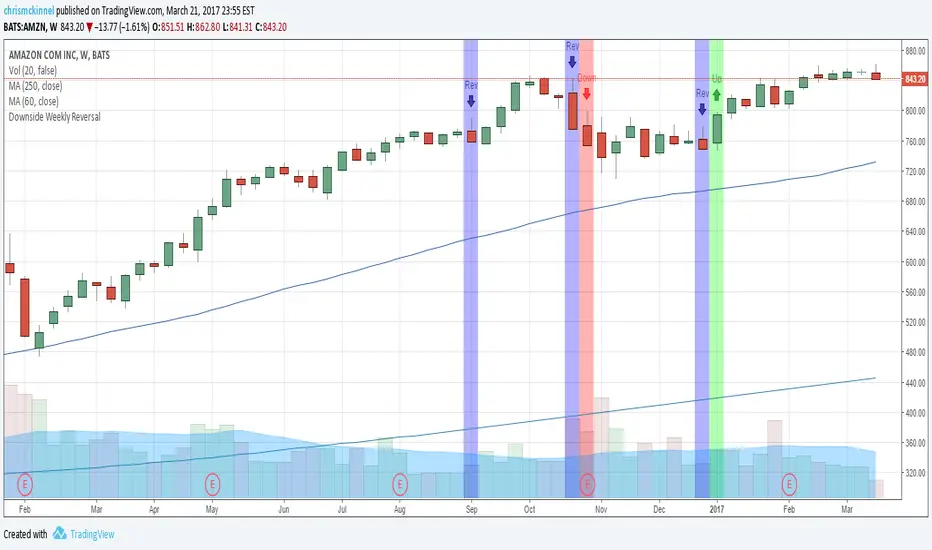
Downside Weekly ReversalBased on Thomas Bulkowski's top ranking small pattern: the Downside Weekly Reversal pattern.
Add this indicator to your weekly charts.
Blue bars represent weekly reversals and green bars following blue bars indicate an upside breakout. These are to be traded in a Bull market.
Red bars following blue bars indicate a downside breakout. These are to be traded in a Bear market.
More details: thepatternsite.com
B3 Donchian CloudsThis is the Donchian Channel expressed with a percentage cloud. Default 12.5% of the range will be filled at each edge, this helps to show reversal possibilities as price returns to the area between the clouds. This offers a usage to essentially fade the turtle trader system. That system is loosely based on the playing of the breakouts of the the channel... as you can see the that last turtle trade long in YM1! was and is off the charts awesome. I will look for the fall out of the cloud to short the market.

B3 Directional Trend IndexB3 Directional Trend Index ~ All about the trend! William Blau is the designer of this gem, and IMHO it is the best trend finder of all the lagging indicators out there I have tested. It is important to pay attention to the slope and thickness of the line, and its relationship to zero. A reversion to the zero may look momentous, but in fact it could reverse when it reaches mean, only to turn back around. You can see this in March and April of this silver futures daily chart. Makes for a great instrument on anything you consider trendy, like crude oil for example. The default user inputs are set to my liking, as I find them to be great on all charts and resolutions. You may read around to find more about this on the internet, or its mentioned in Krausz's work. Also, imprtant to remember when no trend, trend finders like this sufffer, so be wise as to what market condition you are in. Rangy and within Range = no, On the Move = yes.

B3 ECOBlau's Ergodic Candlestick Oscillator = a decent trend finder, however slightly lagged. It can help you to see a reversal entry if you are looking for one. I find the one line ECO hard to use, so I have created this histogram version with a signal line. The colors help to show you whats going on with the ECO and its bias. This indicator shows up in a couple books by people other than Blau, and namely by Krausz. You can also see divergences, for example in pic above the lower or second of the two green humps showing that the general uptrend might be weakened as this run contained less momentum. Tighten up the signal line to see a faster change in its color. These settings are the B3 input settings for default, meaning the ones I use in trading. They are not however the default values you might read about other places.
