Pine3D: A Native 3D Graphical Rendering EnginePine3D is a full 3D rendering engine for TradingView, powered by Pine Script™ v6.
Pine3D pushes forward the frontier of TradingView 3D rendering capabilities, providing a fully fledged graphical engine under an intuitive, chainable, object oriented API. Build meshes, transform them in world space, light them, cast shadows, project them through a perspective camera, and render the result directly on your chart, all without ever bothering about trigonometry synchronization or optimization.
The
Scatter
Scatter PlotThe Price Volume Scatter Plot publication aims to provide intrabar detail as a Scatter Plot .
🔶 USAGE
A dot is drawn at every intrabar close price and its corresponding volume , as can seen in the following example:
Price is placed against the white y-axis, where volume is represented on the orange x-axis.
🔹 More detail
A Scatter Plot can be beneficial because it shows more detail compared with a Volume Profile (seen at the right of the Scatter Plot).
The Scatter Plot
RSI Impact Heat Map [Trendoscope]Here is a simple tool to measure and display outcome of certain RSI event over heat map.
🎲 Process
🎯Event
Event can be either Crossover or Crossunder of RSI on certain value.
🎯Measuring Impact
Impact of the event after N number of bars is measured in terms of highest and lowest displacement from the last close price. Impact can be collected as either number of times of ATR or percentage of price. Impact for each trigger is recorded separately and stored in array of custom type.
🎯Plot
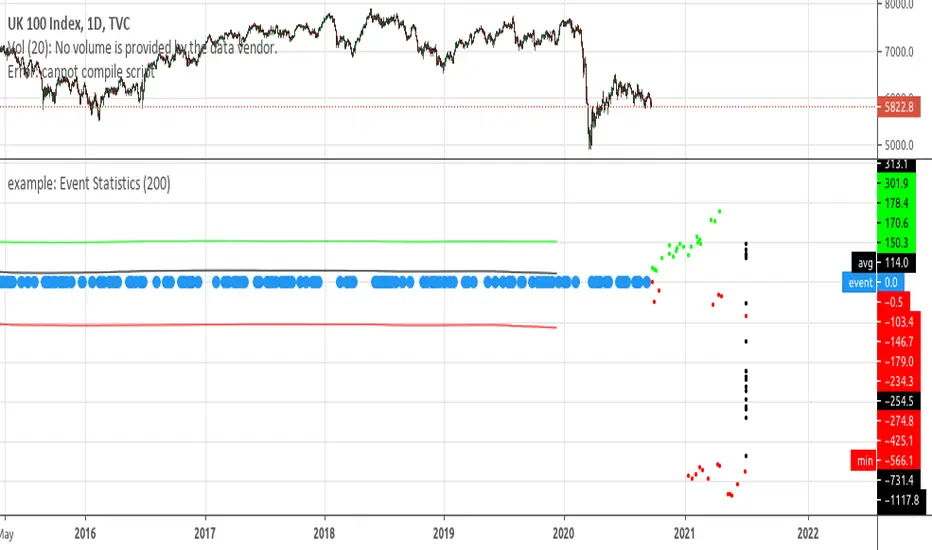
example: Event StatisticsEXPERIMENTAL:
A example on how to retrieve statistics from a recurring event.
Can be used to optimized strategy's, trade parameters, etc..
Индикатор