LT Pulse 2.1This indicator has multiple purposes and functions: (1) it can show transitions from low to high volatility, the momentum direction, and potential big moves in price; (2) it can measure early shifts in momentum and the first indications of a possible breakout, as indicated by the “early signals”, (3) it measures the risk of possible failure by displaying on the indicator the key risk level, which if breached by the price, it can indicate that the momentum can suddenly dissipate (and thus end the momentum signal), (4) when the force of the momentum likely ends, (5) it can identify potentially more volatile or explosive moves and (6) the indicator can also show the likelihood of potential extended moves in price.
In regards the first function, when the red dots are forming (i.e. a “pulse” forming), this indicates a period of likely low volatility – often correlating with consolidating, sideways or rangebound market conditions. It can also indicate that a potentially big or volatile move could be setting up. Usually when the red dots turn to blue/cyan dots (i.e. a “pulse” triggers) this indicates that we could be about to see a transition from low to high volatility. The volatility could result in the price often moving very fast in a specific direction (as shown by the momentum histogram).
The momentum histogram bars on the dots indicate the likely momentum direction: green histogram bars show when momentum is positive (above zero) and red histogram bars show when the momentum is negative (below zero). Bright green momentum bars indicate that the probable direction could be to the upside and the bright red momentum bars indicate that the probable direction be to the downside.
Once the momentum histogram turns from bright green to dark green (or bright red to dark red) this indicates that momentum could be weakening or dissipating. When the histogram colour turns to grey this indicates that the pulse has likely ended or dissipated.
After a pulse “fires” and then the momentum on the pulse dissipates, meaning when bright green histogram bars turn to dark green and then grey - or when bright red histogram bars turn to dark red and then grey - this indicates that there is a higher risk that price could reverse from its original direction, since the momentum is weakening. So for example, if after a pulse signal fires to the upside (positive) and then the green histogram bars turn dark green and then grey – this shows that there is a high probability that the upward momentum has ended and thus downside risk has increased (the reverse applies for red histogram bars when the pulse fires to the downside).
There is the possibility that the price can continue to move in its original direction, despite the momentum weakening or dissipating. Sometimes the pulse may fire in one direction, and then the price may quickly reverse direction (and momentum may reverse very quickly) – this is often due to the volatile, uncertain and probability nature of price action.
The indicator measures the risk of failure by incorporating and displaying a risk parameter box near the histogram – we call this the “risk box”. By “failure” we mean the risk of either a false signal (or a false breakout) or a loss in momentum which could result in a reversal in price – both scenarios would increase risk. The risk box is calculated by measuring the distance from the closing price of the previous bar to its velocity position and then dividing this by 2. The idea behind the risk box is to quickly know when risk of failure (or a false signal) has likely increased. For example, if a pulse signal fires to the upside (with bullish or positive momentum), a risk box near the histogram usually shows the risk level for the price (which is usually below the price). Therefore, if price were to suddenly drop below this risk level, the odds may have increased for a false signal (or false breakout) or the probability that the momentum may be about to dissipate and price could potentially reverse. In such a situation, chartists need to be aware that the probability of that original bullish or positive signal may have dropped significantly. The opposite applies in situations where a pulse fires to the downside with negative or bearish momentum – if price were to suddenly move above the risk price level, this indicates that the odds of any further downside have likely reduced and the probability of a false signal, false breakout or dissipation of momentum has likely increased.
We have also included a risk box for the “early signals” too. This means that if an early signal appears, price needs to remain above that risk level (as shown in the risk box) in order for the early signal to remain valid. If price were to breach the risk box level, it could increase the risk of a possible false signal (or a false breakout).
The indicator also colours the histogram bar yellow when risk has suddenly increased (based on the risk parameter in the risk box, explained above) – this is called a “risk increase”. So for example, if the momentum is bullish and the pulse has fired to the upside, as soon as price drops and falls below the risk parameter (the price mentioned in the risk box), the histogram bar turns yellow. This indicates that the probability of continuing upward momentum has decreased significantly – and that the odds of a reversal in price have increased. The reverse applies in cases of downward momentum. It should be noted that if the yellow “risk increase” signal occurs very soon after a pulse signal fires, this could mean that it was very likely a false signal (or a false breakout). Risk protection is therefore important.
The indicator includes a “potentially volatile move” signal – which colours the dots purple. This occurs when a pulse signal is forming at the same time as the ADX (average directional index) is below 20. These types of environments are usually associated with LOW volatility. So when the ADX is below 20 at the same time as a pulse signal forming (i.e. a low volatility period) this indicates that when the transition from low to high volatility eventually occurs, that the transition could be more “explosive” or volatile than usual. These types of signals can be more potent i.e. potentially stronger than normal – often resulting in bigger moves than one would usually expect, on balance of probabilities.
The “early signals” in the indicator is simply a CCI based signal that can be enabled (optional). Early signals often show a blue or magenta colour spike on the red dots before the pulse “fires” (blue being “bullish” and magenta being “bearish”). The idea behind the “early signals” is to show the probable direction the pulse may fire based on the momentum. The “bullish” early signals (blue) are based on CCI going above zero and crossing above its 20 SMA. The bearish early signals (magenta) are the opposite i.e. CCI going below zero and crossing below its 20 SMA.
The early signals are prone to the risks of false signals or “whipsaws” – mainly due to the unpredictable nature of sideways or rangebound markets whilst a pulse is forming. For this reason, we prefer to combine the “early signals” with other trend-based indicators (such as gamma confirmation or higher timeframe momentum) to potentially minimise the risks of whipsaws (although the risks of whipsaws can never be totally eliminated for any indicator). For example, if the trend is stronger in the upside direction (or if gamma confirmation is blue), and if price is above its key averages (e.g. the 21 EMA), then we prefer to mainly focus on the blue (or bullish) early signals instead of the magenta ones, due to the directional bias, the risks and probabilities. Vice versa applies for when trend is stronger in the downside direction (or if gamma confirmation is red), and if price is below its 21 EMA, then the probabilities usually tend to favour the magenta (or bearish) early signal.
Early signals should NOT be used by new or beginner chartists as this is an advanced strategy. For higher probability chart setups, it is better to wait for the pulse to actually fire first (i.e. wait for the red dots to turn to blue dots) – to have a better idea of the momentum direction and to reduce the risk of too many whipsaws and false signals.
As a general rule, when price is in an uptrend and is holding above the 21 EMA (or above LT Velocity), and usually when the momentum on the higher timeframe is also positive (e.g. rising bright green bars), there is a slightly higher probability for the pulse to fire to the upside. LT Gamma confirmation can also be used to increase the odds (as a blue gamma confirmation can indicate that the strongest trend and the path of least resistance is to the upside). Vice versa applies for when price is in a downtrend and below the 21 EMA (or below LT Velocity) and when higher timeframe is also in a downtrend, and gamma confirmation is red. Chartists should be aware of the probabilistic and uncertain nature of price action and the markets, and therefore prepare to limit and control any potential risks.
The indicator also incorporates a signal that can show that there is a high probability of an “extended move” – in other words, the odds of significantly further follow-thru in its original direction. This signal is ideally better suited for higher timeframe charts such as daily or weekly charts – specially after price has bounced off a key support (or resistance) level. The extended move setting is based on the price closing above (or below) its 5 SMA seven times consecutively, after a significant drop (or rise) in price. For example, in the bullish example, after a significant drop in price which causes the MACD to drop below zero (and specially in a downtrend), if the price then closes above its 5 SMA seven times consecutively – we get an orange vertical bar on the indicator. If the price closes above its 5 SMA only six times consecutively, we get a yellow bar. This principle works in reverse for bearish signals too: so for example, if the price is in an uptrend and MACD is above zero, if price were to close below its 5 SMA seven times consecutively, then we see a dark blue vertical bar (but if it is only six consecutive closes, we get a light blue bar).
The best way to apply the “extended move” setting in chart analysis is to wait for a pullback or retracement in the price after the signal appears. Then once the price has taken out the recent high (or low) that the price made before its pullback, this increases the likelihood of a move in the original direction. For example, if price is moving up and a yellow/orange vertical bar appears, we would first wait for a pullback in the price (e.g. a pullback to the averages). Then once price rallies again and takes out the most recent high made before its pullback (i.e. by closing above it), then this increases the probability of the potential “extended move” or continuation of the upward move. The same principle applies in reverse for downward moves: if a blue/dark-blue vertical bar appears, we would first wait for a pullback to the averages (i.e. a brief rally in price) – then if the price takes out the most recent low formed before the pullback (by closing below it) then this increases the odds of further follow-thru lower. As mentioned, the extended move signal is best used on higher timeframes such as the daily and weekly charts – and ideally only after price has bounced off or held a key support/resistance level. This could help minimise the risks of multiple false signals which this signal could generate.
The pulse signal was inspired by the “squeeze” as described by John Carter in his book, Mastering the Trade – which describes the idea of using bollinger bands and keltner channels (i.e. when bollinger bands enter and then exit the keltner channels). However, this indicator expands this concept much further by including the measurement of risk and possible failure (the “risk box”), the first indications of when a pulse could likely fire by showing an early shift in momentum (as shown by the “early signals”), the idea of potentially explosive or volatile breakouts (with ADX below 20), when the pulse signal ends (grey histogram bar), when risk increases (yellow histogram bar), the likelihood of an “extended move” (vertical bars) and alerts to accompany the majority of these signals.
The indicator also includes the option to increase the frequency of pulse signals. For example, on a chart which has relatively few pulse signals, the chartist can tweak the “Pulse frequency” setting to see if there are any “hidden” pulse signals. By toggling the drop-down menu which ranges from 1 to 6, the user can increase the number of pulse signals seen on the chart: the higher the number the higher the frequency of signals. This setting is optional and caution should be exercised when using this setting because the higher the frequency of signals can also mean more “false” signals as well. This is specially the case with settings of 5 and 6 – as they can show many signals, a lot of which could end up being false signals. Therefore, we prefer to mainly use a setting of 1 by default in the majority of circumstances, and only occasionally increase the setting to 3 or 4 as required or as when necessary.
Chartists should be aware of the probabilistic and uncertain nature of price action and the markets, and therefore prepare to limit and control any potential risks.
The indicator can be used on the charts of the majority of markets (e.g. stocks, indices, ETFs, currencies, cryptocurrencies, precious metals, commodities etc.) and any timeframe. It should be noted that the degree of noise and randomness increases significantly on lower timeframes. So the lower the timeframe that is chosen (e.g. 15-min or lower) the greater the degree of noise and randomness and therefore the higher the frequency of false signals or whipsaws. The indicator can be applied to candlesticks, bar charts and line charts.
If you would like access, please send me a PM on Tradingview.
Поиск скриптов по запросу "CCI"

TradeChartist Transformer ™TradeChartist Transformer is an extremely useful indicator that transforms any indicator plot, Oscillatory or Non-Oscillatory into Support/Resistance levels, thereby generating trade entries on Price chart.
How does ™TradeChartist Transformer work?
1. Connect any external indicator plot to Transformer by choosing it from the Transformer's Plug Indicator Here dropdown from the settings.
2. Choose whether the connected plot is Oscillatory or Non-Oscillatory from Indicator Type .
3. If connected indicator is an oscillator, enter the values for Transformer to generate Trade Entries. For example, if the connected Indicator is RSI, user can define RSI level 60 for BUY entries and RSI level 40 for SELL entries. For most oscillators, the value is 0 which is the default value.
4. There are two types of Trade Entries, one based on Fail/breach of Nearby Support/Resistance and the other based on Fail/breach of Ultimate Support/Resistance plotted by Transformer. For Higher Time-Frames like Daily, Fail/breach of Nearby S/R entry type will ensure early trade entries. This could vary from indicator to indicator and a thorough testing/observation on timeframe traded using paper trades is highly recommended before trading with real money.
5. Once Steps 1-4 are complete, BUY and SELL plots based on above will be plotted by Transformer on Price chart.
6. BUY and SELL plots are also decided by an ATR (Average True Range) condition + Indicator plot acting as filter itself along with fail/breach of Support/Resistance, as this helps minimise unproductive trade signals.
7. Enabling Dynamic Support/Resistance plots moving Support/Resistance levels for each bar. For most assets/timeframes, this doesn't alter the Trade entries.
8. Bar Colors and Profit Taking Bars can be enables from settings as these help identify the trend visually and also help recommend bars where profit taking is recommended.
9. Alerts can be created for Long and Short entries by using Once Per Bar Close as Alert Frequency. Entries are generated on Real time bars as close price fails Support or breaches Resistance. It is recommended to wait for bar close before taking a position based on Transformer Trade Entries.
10. Trade Entries or Transformer plots don't repaint. This can be verified using Bar Replay by confirming real time plots with historical plots. Also, when creating alerts, there will be no Alert Warning for repainting as the code doesn't use Security function or other functions that cause potential repainting.
===================================================================================================================
™TradeChartist Transformer can also be connected to ™TradeChartist Plug and Trade to generate Targets, Stop Loss Plot etc. and other alerts can also be created. Example chart shown below - Transformer connected to RSI to generate BUYs when RSI > 60 and SELLs when RSI < 40, connected to Plug and Trade.
===================================================================================================================
Example Charts:
1. CCI - (CCI>100 - Bullish and CCI<-100 - Bearish) connected to Transformer - BTC 1hr chart
2. Chaikin Money Flow with default values connected to Transformer - BTC 1hr chart
3. EMA connected to Transformer- BTC Daily chart
4. Awesome Oscillator connected to Transformer - GBPUSD Daily Chart
5. Ichimoku Cloud Conversion Line connected to Transformer - USOIL 1hr chart
===================================================================================================================
Best Practice: Test with different settings first using Paper Trades before trading with real money
===================================================================================================================
This is not a free to use indicator. Get in touch with me (PM me directly if you would like trial access to test the indicator)
Premium Scripts - Trial access and Information
Trial access offered on all Premium scripts.
PM me directly to request trial access to the scripts or for more information.
===================================================================================================================

Trend Lines Pro for IndicatorsHello Traders!
We need to make things better & better to solve the puzzle and I try to do my best on this way. now I am here with my new Trend Lines Pro for Indicators script.
As you know, Trend Lines is very subjective and many people (even professionals) draw different Trend Lines on the same chart. This is confusing and there must be an automation to make the life easer. with this tool I tried to automate it.
The idea in this script is different from my previous trend lines scripts. In this, I use channel idea so it can check number of pivot points it contains. it also checks the angle while choosing trend lines. then we get stronger and useful Trend Lines automatically.
There are some option in the script, let see one by one:
Indicator: the indicator on which you want to see Trend lines, Predefined Indicators are: RSI, CCI(Commodity Channel Index), OBV(On-Balance Volume), Momentum, MACD, CMF(Chaikin Money Flow), External Indicator
External Indicator: with this option you can use other indicators as input and get trend lines for them.
- First add an indicator (such as MFI)
- in "Indicator" option select "External Indicator"
- click "External Indicator" option
- and choose the indicator from the list
Pivot Period: The Length to calculate Pivot Highs/Lows
Threshold Rate: This rate is used for channel width. it you give bigger numbers then you get bigger channels. it's 4 by default
Minimum Angle Rate for new Trendline: if there are different trend lines , there must be an angle between them to choose best trend lines . you can set the angle with this option.
Minimum Strength: there can be many trend lines but we need to choose/use stronger ones. with this option you can set the number of pivot points a trend channel have to contains. default value is 2
Maximum Loopback Length : by default the script can check 40 pivot highs and 40 pivot lows but to make the script faster and useful I needed to add a limitation for the number of bars that the script can go back.
Show Trendlines as: you can see trend lines as "Trendline", "Channel", "Trend Channel". you can see examples below.
Enable Weak Trend Lines : if there is no trend lines strong enough (as defined in "Minimum Strength" option) you have option to see a weak trend line . that is useful sometimes. if you enable this option weak lines are shown as dotted lines.
Show Price Labels on Trendlines: the script can show the price levels to break trend lines . the example
Line Style: trend lines can be Solid or Dashed as you wish
Color theme: colors of the Up/Down Trend lines can be set. Red, Lime, Blue, White, Black, Olive, Gray
Indicator color: colors of the Up/Down Trend lines can be set. Red, Lime, Blue, White, Black, Olive, Gray and Yellow
and last options are for length options for RSI, CCI, Momentum, MACD, CMF
There are many alerts such: Support/Resistance Broken, Price in Support/Resistance channel, Support/Resistance line broken but still in a channel that means it broke S/R but there is another trend lines to break.
Below an example how the script uses external indicator as input and draws trend lines on it. in this example chaikin ossilator was added to the chart and get trend lines for it. (I am going to make a short video about it)
An example of Trend Channel is below. when you use trend channel option you can get "big picture" of whats going on
An example for trend lines in channels, that is the idea behind this trend lines script
An axample for trend lines for CCI:
Trend lines on OBV:
Trend lines on Momentum:
Trend lines on MACD:
Trend lines on CMF:
Different colors and line styles:
Please send me message for access and do not hesitate to ask your questions about this tool.
Enjoy!
DISCLAIMER: No sharing, copying, reselling, modifying, or any other forms of use are authorized for our documents, script / strategy, and the information published with them. This informational planning script / strategy is strictly for individual use and educational purposes only. This is not financial or investment advice. Investments are always made at your own risk and are based on your personal judgement. I am not responsible for any losses you may incur. Please invest wisely.
Платный скрипт

hamster-bot CCI_PSARTrending strategy using indicators:
Commodity Channel Index (CCI) www.tradingview.com(CCI)
Parabolic SAR (SAR) www.tradingview.com(SAR)
The trend is determined by PSAR indicator on the higher timeframe.
Signals of buy/sell by CCI indicator

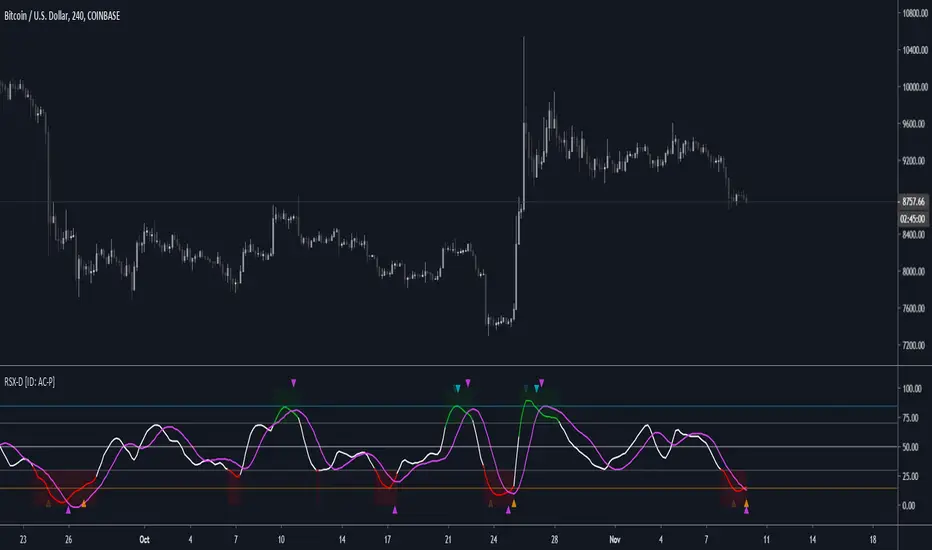
RSX-D [ID: AC-P]The "AC-P" version of Jaggedsoft's RSX Divergence and Everget's RSX script is my personal customized version of RSX with the following additions and modifications:
LSMA-D line that averages in three LSMA components to form a composite, the LSMA-D line. Offset for the LSMA-D line is set to -2 to offset latency from averaging togther the LSMA components to form a composite - recommended to adjust to your timeframe and asset/pair accordingly.
Divergence component from JustUncle, RicardoSantos, and Neobutane divergence scripts
Crossover indication and alerts for Midline, and custom M1 and M2 levels for both RSX and the LSMA-D line from Daveatt's CCI Stochastic Script
EMA21/55 zone cross highlighting option
SMA9/EMA45 MA option from my RSI sma/ema Cu script
Libertus Divergences and Pivot labels from Jaggedsoft's RSX Divergence script are hidden/off by default
Designed for darkmode by default. Minor visual changes from Jaggedsoft's and Everget's script(s) for darkmode and visual aesthetic.
Please Note:
Divergences that use fractal-based detection logic, offset, or a combination of both generally have a 1-2 bar/candle lag. This is an INHERENT limitation of divergence detection with fractals and offsets. Divergences generally will have a higher strikerate on HTF than LTF due to the 1-2 bar lag. While I'm not going to rule out a programming solution or math construct/formula that attempts to alleivates the 1-2 bar lag for divergences, this script is not it - please keep that in mind when using divergence components with a fractal base and offset.
LSMA-D is a composite of three LSMA lines, all with offset options. Different lengths and Offset values can compensate/adjust for the smoothing/latency from RSX, but only up to a certain point. For each LSMA, the least square regression line is calculated for the previous time periods, so the idea is that with finely tuned adjustments, you can get crossover/crossunder signals from the RSX with the LSMA-D line that you simply can't get with the SMA9/EMA45 due to the already smoothed RSX.
The defaults for the RSX and various components for the LSMA-D here will MOSTLY LIKELY NOT WORK OR BE APPLICABLE to every timeframe and asset that you trade - adjust, backtest, and test accordingly. The defaults are here are MEANT to be adjusted to the asset class and timeframe that you are trading.
If you're not familiar with the LSMA, tradingview author Alexgrover has a few great scripts that go into detail how the LSMA works, in addition to different interpretations and implementations of the LSMA.
References/Acknowledgements:
//@version=4
// Copyright (c) 2019-present, Alex Orekhov (everget)
// Jurik RSX script may be freely distributed under the MIT license.
//
//-------------------------------------------------------------------
// Acknowledgements:
//---- Base script:
// RSX Divergence — SharkCIA by Jaggedsoft
//
// Jurik Moving Average by Everget
//
//---- Divergences/Signals:
// Libertus RSI Divergences
//
// Price Divergence Dectector V3 by JustUncle
//
// Price Divergence Detector V2 by RicardoSantos
//
// Stochastic RSI with Divergences by Neobutane
//
// CCI Stochastic by Daveatt
//
//---- Misc. Reference:
// RSI SMA/EMA Cu by Auroagwei
//
// CBCI Cu by Auroagwei
//
// Chop and explode by fhenry0331
//
// T-Step LSMA by RafaelZioni
//
// Scripts by Jaggedsoft for structure and formatting
// Scripts by Everget for structure and formatting
//-------------------------------------------------------------------
// RSX-D v08
// Author: Auroagwei
// www.tradingview.com
//-------------------------------------------------------------------
HA_CCI Long onlyStratégie calculée sur le croisement d'in CCI lent et d'un CCI Rapide
Le CCI est calculé sur la cloture de bougie henki hashi

The K2 v2.0 StrategyThe updated version of THE K2 is finally here! A lot of changes were made when creating the second version of the K2, but the result was a much higher level of performance.
The new K2 consists of a 1 minute 'fast' CCI and 15 minute slow CCI. We identified key thresholds for each one to construct a more complex trading approach. The green shapes on the chart represent buy signals and the red shapes are sell signals. The text above them is the percentage of equity used in each trade. These percentages are based on the CCI's position relative to the fixed thresholds. By doing this, the strategy achieves a higher frequency of trades and lower max drawdown.
Here's a guide to help understand the various shapes:
Circles: Slow CCI trades using 50% equity.
Squares: 25%
Triangles: 15%
Crosses(X's): 10%
We will update the user guide on our website(ProfitProgrammers.com) to include an in-depth guide to using the new K2.
The results displayed on the chart are the results for the month of April. As always, the K2 strategy comes with its study equivalent(at no extra cost).
If you're interested in the K2, message us for a free 3 day trial!
All of our invite only studies and strategies can be found on our website ProfitProgrammers.com

ccid (with high low histogram)So this indicator has the following : CCI where the buy and sell signal can be either cross of the fast the slow and vice versa or cross of CCI bellow -50 and cross down CCI +50
the histogram (blue and red) is made by high low like histogram the buy and sell is based on crossing of the 0 . since its MTF type . you can toon the TF either to the time frame or use lower graph time with higher TF
since both indicator complement each other then I put them together

MBY_CCI Flow (Final)안녕하세요.
용 입니다.
이 지표는 CCI를 기반으로 Re building 되었으며, 빌트인 지표를 Develop 하는 수준에서 벗어나, Re building이라고 생각하시는 편이 좋을 것 같습니다.
본래는 비공개 지표이나, 많은 분들이 사용하시길 바라는 마음으로 Re-publish 합니다.
INVITE ONLY 적용으로 소스코드는 보실 수 없습니다.
한시적으로 신청자에 한해 사용권한을 드립니다.
사용기한 : 19.01.01 까지-
부디 많은 도움 되시길 소망합니다.
이 지표에는 3개의 기준선이 존재합니다.
1,100 : 단기 반등을 포기하고 현재 구간에서 매도 하는 것을 추천하는 Zone
2,0 : 기준선 (오실레이터 양 / 음 판단)
3. -100 : 매수 추천 Zone (단, 강한 매도세 출현 시, 단기 반등은 존재하기 때문에, 확실한 다이버전스를 확인 할 것)
기준선을 활용하시면, 안전한 매매 구간을 캐치 하실 수 있습니다.
또한, 퍼블리쉬되어 있는 차트에 나와있는 스토캐스틱을 활용하십시오!
해당 스토캐스틱 또한 본 작성자의 퍼블리쉬 인디케이터에 퍼블리쉬 되어 있으며, 신청해주시면 일괄 권한드립니다. 사용제한기간은 없습니다.
<매매활용 설명>
1) Day 타임 프레임 기준-
매도 해야 되는 곳 : CCIFlow 100이상 위치 and 스토캐스틱, 스토캐스틱 강세선 하방교차 (Dead cross)
* 스토캐스틱 강세선은 스토캐스틱의 현재 추세 유지강세를 파악하여, 한 템포 빠르게 데드/골든/ 횡보 등의 포지션을 예측할 수 있습니다.
매수 해야 되는 곳 : CCIFlow -100이하 and 스토캐스틱 & 스토캐스틱 강세 상방교차
해당 구간에서 매매 하시면, 단기 반등을 아쉬워 하실순 있겠지만 매도자리는 실패율이 거의 없다고 보시면됩니다. 매우 신뢰도가 높습니다.
많은분들이 혜택을 보시길 바랍니다.
* 추가 해설
CCI플로우의 오실레이터가 양봉에서 변곡점을 만들때에 매매에 유의 하셔야 합니다.
기본적으로 99~-99 사이에서는 변곡점의 형성여부와 스토캐스틱/스토캐스틱강세선에 의존도를 높이셔야 합니다.
스토캐스틱 /스토캐스틱가 주가 흐름변화에 선행 되며, CCI플로우가 신뢰도를 더욱 높게 해석해 준다는 점을 인지하셔야 합니다.
추후 아이디어 퍼블리쉬를 통해 자세히 설명드리겠습니다.

MBY_CCIThis Indicator Used Normal CCi & SMA.
Based on CCI but SMA of CCi and the other indicators used.
Just for Invite, Never sold or Free.
"May the Bit be with you."
MBY_LAB

Divergence TraderThe indicator catches the regular and hidden divergences on indicators like RSI, CCI and Williams %R. It is possible to select the indicator to be used for catching the divergences and multiple selection is possible. The script not only runs on Crypto trading but also Forex or DXY and EXY along with. The signal type can be selected as "Long/Short" or "Buy/Sell". Since the divergence does not occur sequentially, same signal may appear after the signal. There is no repaint, as the signal appears on the newly opened candle and it means the conditions are met and signal is solid to follow from the beginning time of candle. Besides, confirmations can be set for previous candle's high/low, previous candle's green or red, High/Low Doji or Body Doji candles. Doji sensibility can be set separately. There are 2 divergence calculation mode, each has to be used separately as they effect's calculation parameters differently. Alarms are defined in the indicator as again Long, Short, Buy or Sell.
Along with all of these, the entry point confirmations can be set as in indicators (ie. CCI has to be over 100 when Long condition met.) The confirmation code works separately from the divergence indicators so there is no need to use CCI divergence for confirmation. However, both divergence and confirmation source and length are the same.
The indicator does not depend on intervals. It focuses directly to divergences on the indicators.
Roadmap:
- MACD divergence integration
- Stoch RSI divergence integration
- Seperation of indicator confirmation modules and divergence base indicators in terms of length and source
- Implementation of exaggerated divergences

I AM Div3rgentIchimuko+MACD+William+CCi+Bollinger+4EMA,4SMA +ATR +pivot + strategy
When background is green William or cci or BOTH are under their boundaries (Good to Buy)
When background is red William or cci or BOTH are over their boundaries (Good to sell)
When Macd strategy tell u can buy
When it says close u can sell
Use ichimuko it is the best trend analyzer
U also can use EMA & SMA And ATR in option(touch Setting bottom)
,...
Hope u all EnJoY

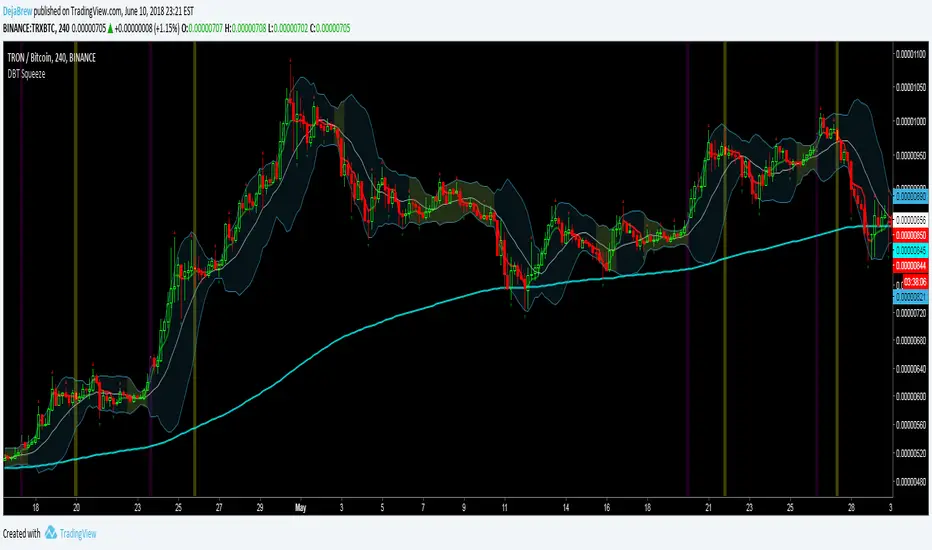
DBT SqueezeThe DejaBrew Trading Squeeze is an indicator designed over years of trading volatility. It uses Bollinger Bands to determine areas of low volatility, signified by the yellow shading of the squeeze. Then it takes into account CCI values to determine a breakout incoming. This indicator also has VWAP, 200 ema, and Williams Fractals built in.
To use this indicator first determine a time frame that does not give a large amount of signals (it was designed to work best on the 5min but has been tested and works great on all time frames above 5min). Once a time frame is determined then look for Bollinger Band squeezes signified by yellow shading. Once the squeeze is determined wait for a purple or blue buy candle to signal (purple are stronger signals). Once a buy candle has signaled evaluate price action, if bullish and supported by other indicators then either take an aggressive entry on the buy candle or wait for a pullback no greater than 50% of the buy candle. Once your position has been established place a stop loss at 1% or below the 200ema and VWAP if possible, no greater than 3% is recommended. Target a 3% gain or wait for the Yellow Sell Candle to close most or all of your position.
Do not take buy candles in extremely bearish markets. Purple Buy Candles are much stronger than blue because they are above the 200ema signifying a bullish trend. Do not take every buy candle if market is choppy and giving a lot of signals. Pair this indicator with a Commodity Channel Index (50) for the best signals. When the CCI is stable and not choppy the buy candles will be much more accurate. Do not take buy candles if the CCI is very choppy.
Use at your own risk. This is not financial advise and this indicator is not guaranteed to make you profits. Please message me if you have any questions or feedback. Enjoy.
DO NOT ASK FOR ACCESS. THIS INDICATOR WILL BE AVAILABLE ON MY WEBSITE ONCE IT RELEASES.
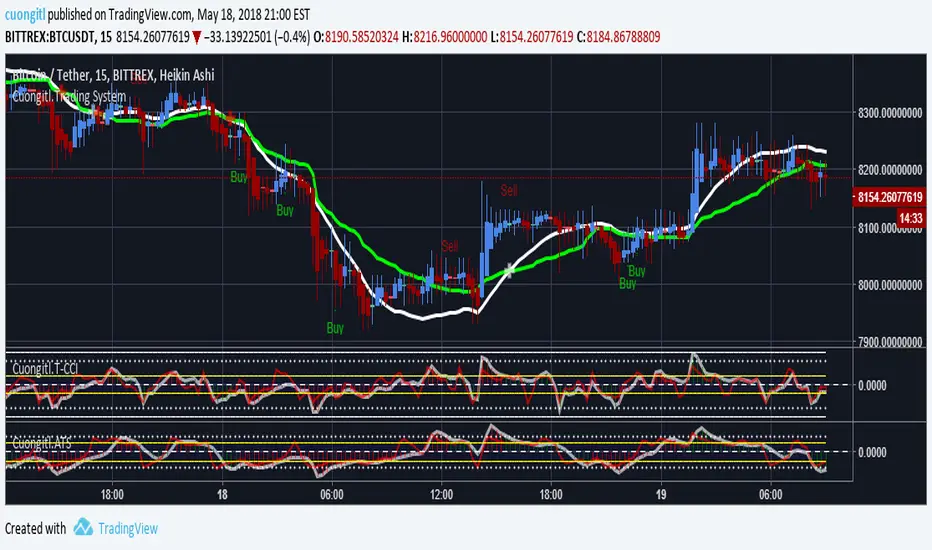
CryptoVN - Automated Trading System with Buy/Sell signalsTrading System:
Heiken Ashi candle
CCI
Double MA for HA Smoothed
An improved version for
Here's an backtest:
Who's paid and joined to beta testing for that version will be free update to this version.
If you like and want to try this, tips and donations are always welcome. :)
Bitcoin: 3BMEXfdqNNmVmtHYvZ1HqMyXchAGLUrbqF
(*) My Advice to You:
- The Trend Is Your Friend. TRADE WHAT YOU SEE, NOT WHAT YOU THINK.
Happy Trading Life ^^!
Severianocci StrategyBased on CCI @62
20 EMA
89 EMA
When price closes above 0 CCI signals trend could be changing. If after this happens and than CCI crosses +100 after a few candles after and as long as price is above 20 EMA and at the same time the 89 EMA is below the 20 EMA is a very bullish signal to enter long. Vice versa for Shorts This is my simple accurate strategy. Combine with taking profits after the price crosses the 20 EMA coming down .

Finns Trading Algorithm BETAThis is a script slot solely for beta tests. Please refer to the normal versions.
25.01.18 Beta test:
I combined CCI from the following timeframes: 5, 15, 30, 60 and 120 minutes. Not every single one needs to be used, it's customizable. The Sell mechanism is triggered when that combined value is crossing under a set value.
I played around with it a little bit and made my choice for CCI 15 minute and CCI 60 minute combined. As sell triggers I chose 160 and 90.
Warning: As you can see there are very few sells but they always appear on nice high points so:
1. You bag up naturally because there are more buys than sells
2. I will try it without TV_PROTECTION and TV_GAIN as I don't want to hold bags forever if the market is going down. In that case I'd rather sell at few % loss because the sell signal is on a high point even in downtrend

CB RSI & MFI StrategyAlternate version of
Published for client testing:
Changes
Replaced CCI entry indicator with RSI.

MTF CCI_8_34_5m_30minThis indicator is used in NimblrTA for plotting the following:
CCI-8 on 5 minutes
CCI-34 on 5 minutes
CCI-34 on 30 minutes interval on 5 minutes

Full VZ-Score (price & Volume)Z score is an Indicator really close to CCI, only difference is that CCI use a 1.5 factor of standard deviation, and Z score use only 1 deviation. This difference make CCI to have a range wider then Z score, but also less sharpe. Here I had use a light filter to smooth both price and volume. So we have same indicator with different source: Histogram is VOLUME Z score, and LINE is PRICE (hlc3). Remember that top volume is not always top price, it could be button one. Volume help to see how strong is the move of the Z score. Inversion could happen when top/high volume and top/bottom price. Low buttom volume with low/high price usualy means end of trend.

Reversal Signal by Vahid.jafarzadehReversal Signal by Vahid.j is a technical analysis tool designed to identify potential market turning points using a combination of Donchian channels, Fibonacci levels, and multi-oscillator divergences. This indicator calculates dynamic support and resistance levels based on recent highs and lows, applies key Fibonacci retracement zones, and evaluates divergences across multiple oscillators including RSI, MACD, Momentum, CCI, OBV, Stochastic, DI Oscillator, VWMA, CMF, and MFI.
Signals are displayed as bull 🐂 and bear 🐻 icons on the chart to indicate potential buy and sell zones. The indicator also tracks the cumulative divergence count, offering a quantitative perspective of market strength and trend reversal probability.
Alerts can be set for both bullish and bearish signals, enabling timely entries and exits based on divergence and Donchian-Fibonacci confluence.
-------
فارسی :
سیگنال بازگشت توسط Vahid.j یک ابزار تحلیل تکنیکال است که برای شناسایی نقاط احتمالی تغییر جهت بازار طراحی شده و از ترکیبی از کانالهای دونچیان، سطوح فیبوناچی و واگرایی چند نوسانگر استفاده میکند. این اندیکاتور سطوح حمایت و مقاومت پویا را بر اساس بالاترین و پایینترین قیمتهای اخیر محاسبه کرده، سطوح کلیدی فیبوناچی را اعمال میکند و واگراییها را در چندین نوسانگر شامل RSI، MACD، مومنتوم، CCI، OBV، استوکاستیک، DI اسیلاتور، VWMA، CMF و MFI ارزیابی میکند.
سیگنالها به صورت آیکون گاو 🐂 و خرس 🐻 روی چارت نمایش داده میشوند تا مناطق خرید و فروش احتمالی را نشان دهند. همچنین این اندیکاتور تعداد واگراییهای تجمعی را ردیابی میکند و دید کمی نسبت به قدرت بازار و احتمال بازگشت روند ارائه میدهد.
امکان فعالسازی آلارم برای سیگنالهای صعودی و نزولی وجود دارد تا بر اساس همگرایی واگرایی و سطوح دونچیان-فیبوناچی، ورود و خروجهای به موقع انجام شود

TrendSurfer Pro
TrendSurfer Pro 🚀 - Advanced Multi-Signal Trading Indicator
TrendSurfer Pro is a comprehensive all-in-one trading system that combines multiple proprietary algorithms and technical indicators to identify high-probability trading opportunities across all timeframes.
**Key Features:**
🔹 **Master Trend System** - Identifies major trend reversals using a combination of EMAs, RSI, and custom filters
🔹 **Smart Money Analysis** - Order Blocks detection with Z-Score impulse identification and rejection signals
🔹 **Session-Based Trading** - Tokyo, London, and New York session analysis with automatic breakout/rejection detection
🔹 **IFVG Detection** - Institutional Fair Value Gap identification for precision entries
🔹 **Multi-Timeframe Signals** - Triangle signals with volume analysis and VWAP proximity filtering
🔹 **KCandle/Boost System** - Advanced engulfing pattern detection with golden area projections
🔹 **CCI Signals** - Commodity Channel Index crosses with MACD confirmation filter
🔹 **Take Profit System** 🎯 - Advanced exit system combining 8 technical indicators (RSI, MACD, Stochastic, Bollinger Bands, Supertrend, CCI, EMA Cross, Price Action) with customizable confirmation requirements
**Unique Advantages:**
✅ Yellow Box Filter - Proprietary reversal zone detection
✅ Time Filters - Trade only during your preferred hours
✅ VWAP Integration - All signals respect price position relative to VWAP
✅ Customizable Alerts - Get notified for every signal type
✅ Visual Dashboard - Real-time trend confirmation table
Perfect for day traders, swing traders, and scalpers seeking precise entries and optimal exits! 🚀

Beast Mode PRO v4.0# Beast Mode PRO v4.0 - Advanced Multi-Regime Trading System
## Overview
Beast Mode PRO v4.0 is a sophisticated technical analysis indicator designed for active traders seeking high-probability setups across multiple timeframes. This system combines machine learning-inspired clustering algorithms with traditional technical analysis to identify market regimes and generate precision entry signals. The indicator adapts to different trading styles through intelligent preset configurations and multiple trading modes.
---
## Core Methodology
### Signal Generation Framework
The indicator employs a **multi-component voting system** that analyzes market conditions through several independent technical perspectives:
**Technical Components:**
- **RSI (Relative Strength Index)**: Momentum oscillator measuring overbought/oversold conditions
- **Fisher Transform**: Price transformation technique that normalizes price distributions for clearer turning points
- **DMI (Directional Movement Index)**: Trend strength indicator measuring directional pressure
- **Z-Score Analysis**: Statistical measure identifying price deviations from historical norms
- **Moving Average Ratio**: Price relationship to its moving average baseline
- **MFI (Money Flow Index)**: Volume-weighted momentum indicator
- **Stochastic Oscillator**: Momentum indicator comparing closing price to price range
- **CCI (Commodity Channel Index)**: Measures current price level relative to average price level
### Clustering Engine
The system utilizes a **k-means inspired clustering algorithm** that categorizes each technical indicator's normalized values into distinct market regimes (bullish, bearish, neutral). This approach:
1. **Normalizes** all indicators using z-score transformation over a historical lookback window
2. **Clusters** normalized values using percentile-based thresholds
3. **Aggregates** individual votes into a composite score ranging from -100 to +100
4. **Smooths** the composite score using selectable methods (SMA, EMA, WMA, HMA, TEMA, DEMA)
The clustering percentiles adapt dynamically based on current market volatility (ATR-normalized), ensuring the system remains responsive across different market conditions.
---
## Trading Modes
### 1. Normal Mode
Standard crossover-based signals using fixed thresholds (+10/-10). Suitable for balanced trading with moderate signal frequency.
### 2. Scalper Mode
Dynamic threshold adjustment based on recent score volatility. Generates more frequent signals by adapting to short-term price movements.
### 3. Aggressive Mode
Reversal-focused approach that triggers signals when the composite score crosses extreme levels (+80/-80), targeting major trend reversals.
### 4. Hybrid Mode
Combines Normal and Aggressive signals, capturing both standard crossovers and extreme reversals for comprehensive market coverage.
### 5. Super Scalper Mode
Ultra-responsive mode using signal line crossovers (14-period HMA of composite score) for maximum trade frequency.
### 6. Sniper Mode (Premium Feature)
Multi-confirmation system requiring alignment of:
- Composite score threshold breach
- Positive fast momentum (10-period SMI)
- Positive trend momentum (200-period SMI)
- Price above/below smart trend filter MA
This mode prioritizes precision over frequency, filtering out low-probability setups.
---
## Timeframe Presets
Pre-optimized configurations for common trading timeframes:
### 1 Minute Preset
- Fast smoothing (10-period WMA)
- Tight chop filter (61.8 threshold)
- Optimized for rapid scalping with minimal lag
### 2 Minute Preset
- Balanced smoothing (12-period EMA)
- Enhanced volume filtering
- Moderate cooling period (5 bars)
### 3 Minute Preset
- HMA smoothing for reduced lag
- Stochastic and CCI enabled
- Balanced approach for intraday trading
### 5 Minute Preset
- TEMA smoothing for trend following
- Stronger filters to reduce noise
- Extended lookback (1000 bars)
### 15 Minute Preset
- DEMA smoothing for swing positions
- Maximum filtering configuration
- All technical indicators enabled
- Suitable for swing trading and position building
Users can also select "Custom" to manually configure all parameters.
---
## Advanced Filtering System
### 1. Choppy Market Filter
Uses Choppiness Index calculation to identify consolidating markets. When CI exceeds the threshold, signals are suppressed to avoid whipsaw trades.
### 2. Smart Trend Filter
Configurable moving average (SMA/EMA/WMA/HMA/TEMA/DEMA/VWMA/RMA) that prevents counter-trend signals. Long signals require price above the MA, shorts require price below.
### 3. Volume Filter
Compares current volume to its moving average. Signals are suppressed when volume falls below the specified multiplier of average volume.
### 4. ATR Volatility Filter
Prevents trading during low volatility periods when ATR falls below its moving average multiplied by the specified factor.
### 5. Session Filter
Time-based filtering for Asia, London, New York, or combined sessions. Ensures trading only during preferred market hours.
### 6. Multi-Timeframe Confirmation
Optionally requires higher timeframe alignment before generating signals, adding confluence for higher probability trades.
### 7. Cooling Off Period
Prevents signal clustering by enforcing a minimum number of bars between consecutive signals.
---
## Smart Money Concepts Integration
### Order Block Detection
Identifies institutional supply/demand zones using multi-timeframe analysis:
- Detects strong directional candles followed by breakout moves
- Volume confirmation ensures significance
- Customizable timeframe selection (current TF or higher TF: 5m, 15m, 30m, 1H, Daily)
- Visual boxes mark active order blocks with automatic expiration after lookback period
- Price interaction alerts when touching active zones
### Liquidity Zones
Marks equal highs (EQH) and equal lows (EQL) where stop losses typically cluster, indicating potential reversal or breakout points.
---
## Momentum Analysis
### Fast Momentum (Default: 10-period)
Short-term momentum oscillator using Stochastic Momentum Index (SMI) calculation. Provides early warning of momentum shifts.
### Trend Momentum (Default: 200-period)
Long-term momentum gauge confirming overall trend direction. Used in Sniper Mode for multi-confirmation.
### Momentum Divergence Detection
Automatically identifies:
- **Regular Divergence**: Price makes new high/low but momentum doesn't (reversal signal)
- **Hidden Divergence**: Price makes higher low/lower high but momentum doesn't (continuation signal)
---
## Visual Components
### Price Chart Overlay
- **Smart Trend MA**: Dynamically colored moving average based on price position
- **EMA Cloud**: 50/200 EMA cloud showing long-term trend (background shading)
- **Trend Background**: Subtle background coloring based on composite score
- **Order Block Boxes**: Institutional supply/demand zones
- **Entry/Exit Markers**: Clear visual signals with emoji labels
- **Liquidity Markers**: EQH/EQL identification
### Bar Coloring
Bars change color based on active mode and market regime:
- **Sniper Mode**: Purple (bull) / Pink (bear)
- **Aggressive Mode**: Bright Green / Bright Red
- **Super Scalper**: Neon Green / Neon Red
- **Timeframe Presets**: Unique color schemes per preset
- **Choppy/Neutral**: Always gray regardless of mode
### Oscillator Pane
- **Composite Score Line**: Gradient-colored stepline showing current regime strength
- **Fast/Trend Momentum**: Optional overlays (gold/cyan colors)
- **Divergence Markers**: Visual alerts for regular, hidden, and momentum divergences
- **Power Zones**: Overbought/oversold regions (80/-80 levels)
- **Dynamic/Fixed Thresholds**: Visual reference lines based on active mode
### Interactive Dashboards
**Main Dashboard** displays:
- Active preset/mode configuration
- Real-time indicator values and votes
- Current market status (active/choppy/counter-trend/low volume/low ATR/MTF misalignment)
- Regime classification (Strong Long/Long/Neutral/Short/Strong Short)
- Smart Trend MA status
**Performance Dashboard** shows:
- Exit strategy (Fixed TP/SL, Trailing Stop, Opposite Signal)
- Total trades and win rate
- Total points and average per NY session
- Profit factor and recovery factor
- Best/worst trades and max drawdown
- Maximum winning/losing streaks
- Sharpe ratio and average risk:reward
**TP Optimizer** (33 variations tested):
- Tests take profit levels from 40 to 200 ticks (5-tick increments)
- Sortable by: Profit Factor, Win Rate, Total Points, Sharpe Ratio
- Displays top 5 configurations with full metrics
- Real-time optimization during backtesting
---
## Backtest Engine
### Exit Strategies
**1. Fixed TP/SL**
- Configurable in Ticks, ATR multiples, or Percentage
- Precise risk management with predefined targets
**2. Exit on Opposite Signal**
- Closes position when counter-signal appears
- Adapts to changing market conditions
- Useful for trend-following approaches
**3. Trailing Stop**
- Dynamic stop loss that follows profitable moves
- Configurable trailing offset percentage
- Locks in profits while allowing trends to develop
### Risk Management
- Optional minimum risk:reward filter
- Prevents trades below specified R:R threshold
- Date range filtering for historical analysis
- Session-based performance tracking
### Performance Metrics
- Win rate, profit factor, Sharpe ratio
- Maximum drawdown and recovery factor
- Consecutive win/loss streaks
- Average win/loss analysis
- Gross profit vs gross loss breakdown
---
## Alert System
Comprehensive alert conditions for:
- Entry signals (Long/Short)
- Exit events (TP/SL/Opposite/Trailing)
- Trend signals (Strong bullish/bearish)
- Divergences (Regular/Hidden/Momentum)
- Order block detection and touches
- Multi-condition strong signals (all confirmations aligned)
---
## How to Use
### Quick Start
1. Select your preferred timeframe preset (1m, 2m, 3m, 5m, 15m, or Custom)
2. Choose a trading mode (Normal, Scalper, Aggressive, Hybrid, Super Scalper, or Sniper)
3. Configure session filter to match your trading hours
4. Enable desired filters (choppy, trend, volume, ATR, MTF)
5. Set your exit strategy and TP/SL levels
6. Monitor signals on price chart and oscillator pane
### Optimization Workflow
1. Enable "Run TP Optimizer" in backtest settings
2. Run backtest on historical data
3. Review Optimizer Dashboard for best TP levels
4. Sort by preferred metric (Profit Factor, Win Rate, Total Points, Sharpe)
5. Apply winning configuration to live trading
### Advanced Configuration
- Customize individual indicator lengths and enable/disable specific components
- Adjust clustering parameters (lookback window, percentiles, cluster count)
- Fine-tune smoothing methods and lengths
- Configure order block detection timeframe and sensitivity
- Set cooling off period to control signal frequency
---
## Unique Features
1. **Adaptive Clustering**: Volatility-adjusted percentiles ensure consistent performance across market conditions
2. **Multi-Mode Architecture**: Six distinct trading modes from conservative to ultra-aggressive
3. **Timeframe Intelligence**: Pre-optimized presets eliminate guesswork for common timeframes
4. **Smart Money Integration**: Order block detection and liquidity zone marking
5. **Comprehensive Backtesting**: Three exit strategies with 33-variation TP optimization
6. **Visual Clarity**: Mode-specific bar coloring and clean chart presentation
7. **Filter Stack**: Seven-layer filtering system prevents low-quality signals
8. **Real-Time Metrics**: Live performance tracking with advanced statistics
---
## Benefits
- **Reduced False Signals**: Multi-confirmation clustering approach filters noise
- **Adaptability**: Works across timeframes and market conditions through preset system
- **Transparency**: Open visualization of all component votes and filtering status
- **Risk Management**: Built-in TP/SL optimization and R:R filtering
- **Time Efficiency**: Preset configurations save hours of manual optimization
- **Educational Value**: Dashboard shows exactly why signals trigger or get filtered
- **Professional Tools**: Institutional concepts (order blocks, liquidity zones) accessible to retail traders
---
## Best Practices
- Use Sniper Mode for high-probability setups during volatile markets
- Enable choppy filter during consolidation periods
- Combine Smart Trend Filter with MTF confirmation for swing trades
- Run TP Optimizer monthly to adapt to changing market dynamics
- Monitor Sharpe Ratio in addition to win rate for risk-adjusted performance
- Use session filters to avoid low-liquidity hours
- Start with preset configurations before custom optimization
---
## Technical Requirements
- TradingView Premium/Pro/Pro+ for full feature access
- Minimum chart history: 500 bars (adjustable in clustering settings)
- Works on all instruments (stocks, forex, crypto, futures)
- Compatible with standard candles (Heikin Ashi optional but not recommended for backtesting)
---
## Disclaimer
This indicator is a technical analysis tool designed to assist trading decisions. It does not guarantee profits and should be used in conjunction with proper risk management, fundamental analysis, and personal trading experience. Past performance does not indicate future results. Users should thoroughly test the indicator on demo accounts before live trading.
---
**Version**: 4.0
**Language**: Pine Script v6
**Type**: Overlay Indicator with Oscillator Pane
**Calculation**: On bar close (default) or real-time (configurable)

Take Profit XTake Profit X
Take Profit X solves the #1 problem in trading: knowing when to exit. Instead of guessing or using single indicators, it aggregates 8 technical signals to identify high-probability exit points through multi-confirmation consensus. This eliminates premature exits and emotional decision-making.
The indicator counts confirmations from your chosen technical tools:
Green dot = Multiple signals say "take profit on longs/exit shorts"
Red dot = Multiple signals say "take profit on shorts/exit longs"
Signals appear when you reach the minimum confirmations threshold you set.
Possible Settings:
Conservative (Swing Trading)
pine
Minimum Confirmations: 4
Use: RSI, MACD, CCI, Supertrend, Price Action
Disable: Stochastic, Bollinger Bands, EMA Cross
Look Back Bars: 10
Aggressive (Day Trading)
pine
Minimum Confirmations: 2
Use: All indicators ON
Look Back Bars: 3-5
RSI OB/OS: 75/25
Balanced (Most Markets)
pine
Minimum Confirmations: 3
Use: RSI, MACD, CCI, Supertrend
Price Action: ON
Look Back Bars: 5-7
