Fractional + Heikin-Ashi Candlestick – CF / ABNew model of Candlestick, Tis model constructed on Fractional Calculus mathematical, use two kernel - Caputo-Fabrizio and Atangana-Baleanu.
Поиск скриптов по запросу "Candlestick"

My Simple Gaps with overlay (Bar and Candlestick Charts)updated screenshot with some narrative
this is a bar and candlestick chart gap identification tool


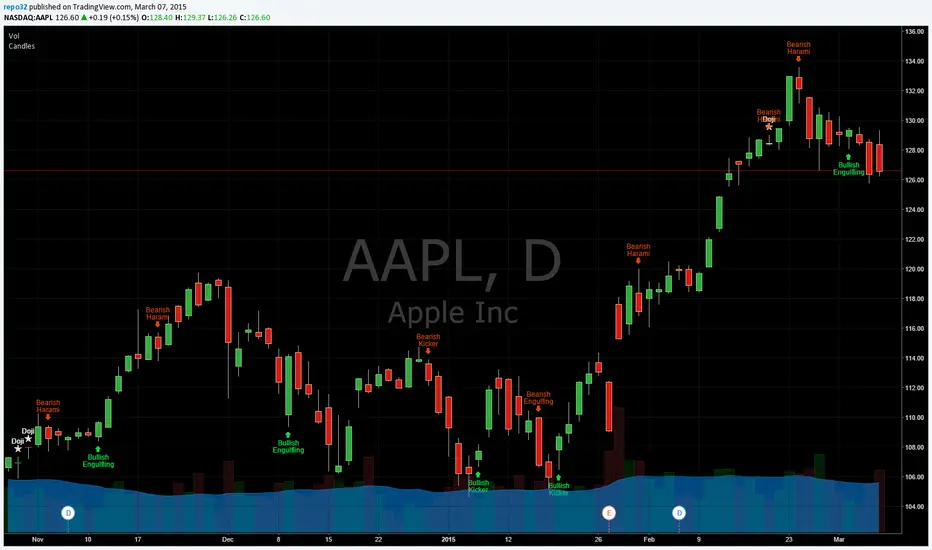
Candlesticks Patterns IdentifiedI was using another script that colored the bars to show the different candle patterns. Thanks to HPotter (www.tradingview.com). Unfortunately, I can't think that fast when looking across a screen of charts with different color bars. Fortunately, Tradingview came up with symbols and names on 2/26/15. I decided to take my favorite symbols and attach them to a name. This makes it easier to see what is going on and where your entry would be if it confirms. Works beautifully for me. Decided to share. I also added the ability to alter what shows up based upon a look back. A bullish engulfing at the top of a trend, or a bearish harami at the bottom of the trend, is nearly useless and clutters the chart. I have the default set for the open of the current bar to be higher or lower than the open from 5 bars back. You can adjust in the settings to what you like. This trend setting is on all the patterns except doji. If you want to see all the candle patterns, set it to "1".
The doji can be adjusted as well. I left some other patterns at the bottom of the script, but they are turned off. They became too much of a clutter for me. I prefer DovCaspi's pattern finder for hammers and stars: I use his due to the clean appearance.
The default script has: Doji, Bearish Harami, Bullish Harami, Bearish Engulfing, Bullish Engulfing, Piercing Line, Bullish Belt, Bullish Kicker, and Bearish Kicker. You can turn off what you don't like. The Piercing Line, Bullish Belt, and the Kickers will usually show up better in the daily charts.
If you would like the updated version, see the Related Ideas below:
Candlestick Pattern Strategy with Risk Management + AlertsThis strategy is built to detect volatility-driven squeeze expansion moves and automatically backtest both Breakout Longs and Breakdown Shorts with adjustable take-profit, stop-loss and volume confirmation filters.
It includes a built-in Auto-Optimizer, allowing the script to test multiple TP/SL/RSI/Volume profiles and automatically select the best configuration for the current market environment. Works across Stocks, Crypto and Forex — with each market automatically adjusting core system parameters.
🚀 Strategy Features
Feature Description
🔥 Long + Short Squeeze Detection Entries triggered by volatility expansion + BB break + strong momentum
⚙️ Auto-Optimizer Searches multiple TP/SL/RSI/Volume settings & selects best performer
📈 Full Backtest-Ready Strategy Includes stops, take profits + built-in performance table
🔔 Real-Time Alerts Get alerted instantly when a long or short squeeze event forms
🔄 Multi-Market Mode Tailored volatility & smoothing settings for Stocks / Crypto / Forex
🧠 Vol Spike Validation Filters signals using relative volume impulse
🏁 Trade Exit Logic Dynamic SL/TP calculated automatically based on optimized parameters
📊 How It Works
Detects breakouts above upper Bollinger band or breakdowns below lower band
Confirms strength using ATR expansion + Volume Surge
Confirms momentum using RSI selection (9/14/20 based on profile)
Enters Long/Short squeeze trade depending on breakout direction
Risk management automatically deploys TP + SL, optimized or manual
Displays performance statistics after backtest execution
🧬 Auto-Optimizer Logic
If Optimizer Mode = ON, the script tests:
Variable Range Tested
TP % 8 → 15%
SL % 4 → 8%
Volume Spike Filter 1.5 → 3.0x
RSI Window 9 / 14 / 20
The configuration that produces the highest score becomes active automatically for signals + backtest.
🛎 Alerts Included
🔥 Long Squeeze Alert
💀 Short Squeeze Alert
You can create TradingView alerts using → Add Alert → ANY alert() function call
Recommended Use
✔ Backtest system performance across assets
✔ Use Optimizer mode to find ideal TP/SL profiles
✔ Enable alerts for real-time squeeze entries
✔ Works best on 1h / 4h / 1D timeframes
🚫 Not financial advice — for research + strategy development only

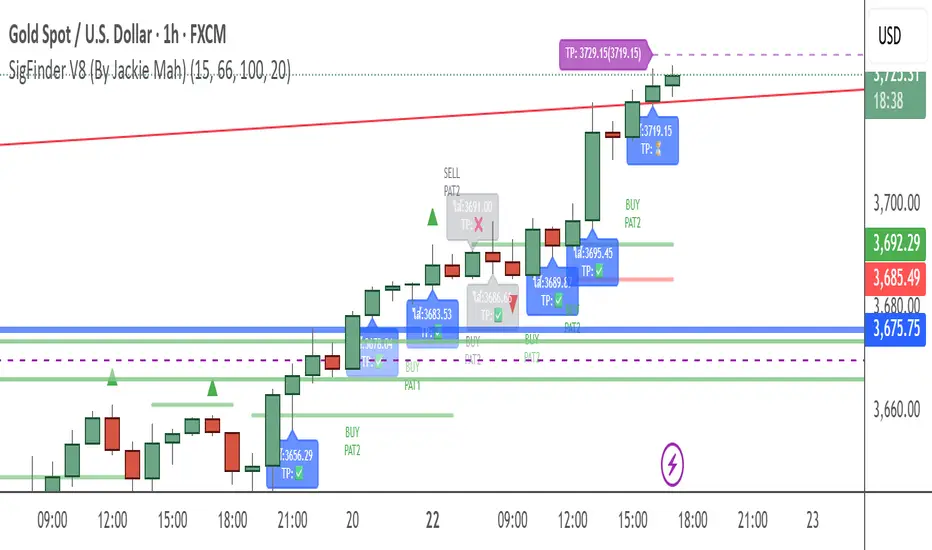
SigFinder V8 (By Jackie Mah)Candlestick Price Action & Signal Finder with Alerts system and text customization.
Time - Bar StatusCandlestick analysis
The Indicator "Bar Status" will display the current open candle state and the last three close candles state based on the logic below.
Abbreviations.
OC = Open Candle (if in no state listed below)
FB = False Break
BO = Break Out
IN = Inside Bar
FBR = False Break Reversal
Logic:
OC = This is the current open candle yet to close. Its status will change as it progresses through time until close.
Green False Break Revers (FBR) = bar Close is higher than previous bar Close AND bar High is higher than previous bar High AND bar Low is lower than previous bar Low.
Green False Break (FB) = bar Close is lower than previous bar High AND bar High is higher than previous bar High.
Green Breakout (BO) = bar Close is higher than previous bar Close AND bar High is higher than previous bar High.
Green Inside Bar (IN) = bar High is lower than previous bar High AND bar Low is higher than previous bar Low.
Red False Break Revers (FBR) = bar Close is lower than previous bar Close AND bar Low is lower than previous bar Low AND bar High is Higher than previous bar High.
Red False Break (FB) = bar Close is higher than previous bar Low AND bar Low is lower than previous bar Low.
Red Breakout (BO) = bar Close is lower than previous bar Close AND bar Low is lower than previous bar Low.
Red Inside Bar (IN) = bar High is lower than previous bar High AND bar Low is higher than previous bar Low.
The end column is the current open candle/bar.
The second from the end column is the last closed candle/bar.
The third from the end column is the second closed candle/bar.
The forth from the end column is the third closed candle/bar.
=============================================================
Also Includes candle countdown timer, of various candles. i.e. 4 hour, 1 hour, 15min, 5 min.

Japanese Candlestick Pattern RecognizerJapanese candlestick patterns are a powerful tool in technical analysis, offering traders and investors a detailed view of price action and market sentiment.
1. Spinning Top
Description: The Spinning Top has a small candle body with long upper and lower shadows. This indicates that both buyers and sellers were active during the period, but neither took control. The close is near the open.
Significance: Signals indecision in the market. Can appear in both uptrends and downtrends and suggests that the current direction may be losing momentum.
Type: Neutral
2. Doji
Description: A Doji has almost equal opening and closing prices, meaning there was no clear direction during the period. It has long upper and lower shadows.
Significance: Signals indecision or a potential trend reversal. In the context of a strong trend, a Doji can indicate that the trend is losing strength.
Type: Neutral
3. White Marubozu
Description: A long white (or green) candle body with no shadows. Indicates that buyers were in control throughout the entire period.
Significance: Strongly bullish. A White Marubozu often signals the continuation of an uptrend or the start of a new uptrend.
Type: Bullish
4. Black Marubozu
Description: A long black (or red) candle body with no shadows. Indicates that sellers were in control throughout the entire period.
Significance: Strongly bearish. A Black Marubozu often signals the continuation of a downtrend or the start of a new downtrend.
Type: Bearish
5. Hammer
Description: A small candle body at the upper end of the trading range with a long lower shadow. Signals a bullish reversal after a downtrend.
Significance: Bullish reversal. The long lower shadow shows that sellers were strong during the day, but buyers managed to push the price back up.
Type: Bullish
6. Hanging Man
Description: A small candle body at the upper end of the trading range with a long lower shadow. Signals a bearish reversal after an uptrend.
Significance: Bearish reversal. The long lower shadow shows that sellers were strong during the day, suggesting that buyers may be losing strength.
Type: Bearish
7. Inverted Hammer
Description: A small candle body at the lower end of the trading range with a long upper shadow. Signals a bullish reversal after a downtrend.
Significance: Bullish reversal. The long upper shadow shows that buyers attempted to push the price up, indicating a potential trend reversal.
Type: Bullish
8. Shooting Star
Description: A small candle body at the lower end of the trading range with a long upper shadow. Signals a bearish reversal after an uptrend.
Significance: Bearish reversal. The long upper shadow shows that buyers tried to push the price higher, but sellers managed to drive it back down.
_____________________________________
Japanische Candlestick-Muster sind ein leistungsstarkes Werkzeug in der technischen Analyse, das Händlern und Investoren eine detaillierte Sicht auf die Kursentwicklung und Marktstimmung bietet.
1. Spinning Top
Beschreibung: Der Spinning Top hat einen kleinen Kerzenkörper und lange obere und untere Schatten. Dies zeigt, dass sowohl Käufer als auch Verkäufer während der Periode aktiv waren, aber keiner die Kontrolle übernommen hat. Der Schlusskurs liegt nahe dem Eröffnungskurs.
Bedeutung: Signalisiert Unentschlossenheit im Markt. Kann sowohl im Aufwärtstrend als auch im Abwärtstrend erscheinen und zeigt an, dass die aktuelle Richtung möglicherweise an Schwung verliert.
Typ: Neutral
2. Doji
Beschreibung: Ein Doji hat nahezu gleiche Eröffnungs- und Schlusskurse, was bedeutet, dass es während der Periode keine klare Richtung gab. Es hat lange obere und untere Schatten.
Bedeutung: Signalisiert Unentschlossenheit oder mögliche Trendumkehr. Im Kontext eines starken Trends kann ein Doji darauf hinweisen, dass der Trend an Kraft verliert.
Typ: Neutral
3. White Marubozu
Beschreibung: Langer weißer (oder grüner) Kerzenkörper ohne Schatten. Zeigt an, dass Käufer den ganzen Tag über die Kontrolle hatten.
Bedeutung: Stark bullisch. Ein White Marubozu signalisiert oft die Fortsetzung eines Aufwärtstrends oder den Beginn eines neuen Aufwärtstrends.
Typ: Bullish
4. Black Marubozu
Beschreibung: Langer schwarzer (oder roter) Kerzenkörper ohne Schatten. Zeigt an, dass Verkäufer den ganzen Tag über die Kontrolle hatten.
Bedeutung: Stark bärisch. Ein Black Marubozu signalisiert oft die Fortsetzung eines Abwärtstrends oder den Beginn eines neuen Abwärtstrends.
Typ: Bearish
5. Hammer
Beschreibung: Kleiner Kerzenkörper am oberen Ende der Handelsspanne, langer unterer Schatten. Signalisiert eine bullische Umkehr nach einem Abwärtstrend.
Bedeutung: Bullische Umkehr. Der lange untere Schatten zeigt an, dass die Verkäufer während des Tages stark waren, aber die Käufer konnten den Preis zurück nach oben treiben.
Typ: Bullish
6. Hanging Man
Beschreibung: Kleiner Kerzenkörper am oberen Ende der Handelsspanne, langer unterer Schatten. Signalisiert eine bärische Umkehr nach einem Aufwärtstrend.
Bedeutung: Bärische Umkehr. Der lange untere Schatten zeigt an, dass die Verkäufer während des Tages stark waren, was darauf hindeutet, dass die Käufer an Kraft verlieren könnten.
Typ: Bearish
7. Inverted Hammer
Beschreibung: Kleiner Kerzenkörper am unteren Ende der Handelsspanne, langer oberer Schatten. Signalisiert eine bullische Umkehr nach einem Abwärtstrend.
Bedeutung: Bullische Umkehr. Der lange obere Schatten zeigt, dass die Käufer versucht haben, den Preis nach oben zu treiben, und dies könnte auf eine bevorstehende Trendumkehr hinweisen.
Typ: Bullish
8. Shooting Star
Beschreibung: Kleiner Kerzenkörper am unteren Ende der Handelsspanne, langer oberer Schatten. Signalisiert eine bärische Umkehr nach einem Aufwärtstrend.
Bedeutung: Bärische Umkehr. Der lange obere Schatten zeigt, dass die Käufer versucht haben, den Preis weiter nach oben zu treiben, aber die Verkäufer konnten den Preis wieder nach unten drücken.
Typ: Bearish

FRAMA and Candlestick Patterns [CSM]FRAMA (Fractal Adaptive Moving Average) is a technical analysis indicator that adapts its smoothing period according to the market's volatility, allowing it to provide accurate signals in all market conditions. This indicator script plots the FRAMA on a chart and generates buy and sell signals based on the FRAMA and candlestick patterns. It also includes an option to filter signals based on bullish and bearish engulfing patterns.
To detect candlestick patterns, the script imports the "BankNifty_CSM" library from the creator's public library on TradingView. The FRAMA calculation is done using a loop that iterates over the last "length" number of bars, with the smoothing factor adjusted based on the "fracDim" parameter.
The buy and sell signals are generated based on the position of the current price relative to the FRAMA line. If the "engulfing" parameter is set to true, the signals are further filtered based on bullish and bearish engulfing patterns.
Overall, this script combines various technical indicators and candlestick pattern recognition to provide a complete trading strategy. However, as with any trading strategy, it should be thoroughly backtested and evaluated before using it in a live trading environment.

Regression Channel, Candles and Candlestick Patterns by MontyRegression Candles by ugurvu
Regression Channel by Tradingview
All Candlestick Patterns By Tradingview
This script was combined for a friend of mine who needed this.
This Script has regression candles by ugurvu, Regression channel and Candlestick patterns by tradingview.
The intention was to fuse these together so more information can be processed on the cost of a single indicator.

Multi Price Action & Candlestick Patterns - Horizontals R/SNote:
This is a script that synthesizes a number of popular price action and candlestick patterns along with a trading strategy based on horizontal support and resistance. Scripts are used for learning and research purposes.
Useage:
Support and resistance are two important areas in Price Action analysis and trading. After confirming the support and resistance zone line, waiting to confirm the appropriate candlestick pattern and execute the trade, set a reasonable stop loss and take profit, This is critical for compliance with your money management rules.
Notation:
In the script, price action and candlestick pattern are denoted as follows:
- Bullish Engulfing (BU) & Bearish Engulfing (BE)
- Hammer (HM)
- Hanging Man (MM)
- Morning Star (MS)
- Evening Star (ES)
- Tweezer Top (TZT)
- Tweezer Bottom (TZB)
- Shooting Star (SS)
- Bullish Pinbar (PBBBU) & Bearish Pinbar (PBBE)
- Doji Gravestone (GS)
- Doji Dragonfly (DF)
- Doji - Long legged (LL)
- Spinning Top (ST)
Settings:
- Number of left candle to compare lowest/highest: Compare the high/low price of the current candle with the highest/lowest price of previous candles.
- Number of left candle to calc avg body: Compare the average price of the current candle with the average price of previous candles
- S/R Left Bars: The number of bars left hand side of the Pivot
- S/R Right Bars: The number of bars right hand side of the Pivot
- S/R Volume Threshold - The threshold value (%) for the volume oscillator
The code is open and commented - please feel free to use, share, comment & provide feedback.
Good luck!
Feel free to get indicator or strategy trading signals at yummyprofit.

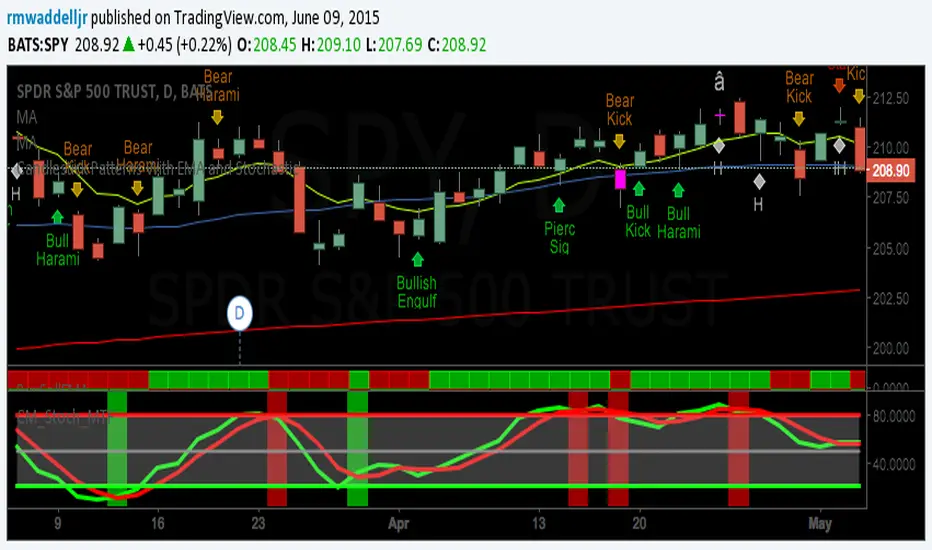
Candlestick Patterns With EMA and StochasticCandlestick patterns identified and color coded according to position above or below 8EMA(TLine).
Special thanks to repo32, DavidR, and Chris Moody for coding ideas.
Bullish candlestick buy signals have a greater probability of success when Stochastics are oversold. Bearish ones have a
greater probability of success when overbought. Stack as many factors in your favor as possible. A candlestick signal by itself is of little value unless you apply additional information with it. Regardless of systems and strategies used, make your second trade first: Know when you're going to exit. Risk management rules. Good luck and good trading.
IU Engulfing Candlestick PatternDISCRIPTION
📈 The IU Engulfing Candlestick Pattern indicator spotlights both bullish and bearish engulfing formations in real‑time. It shades each pattern with a transparent box and drops a concise label so you can catch potential reversals at a glance—no clutter, no noise, just the candles that matter.
USER INPUTS :
1. Pattern Recognition Based on = “Both” | “Wicks” | “Body” ( Default Both )
• Both → only highlights candles that satisfy **both** wick‑and‑body engulfing rules
• Wicks → checks full candle range (high‑to‑low)
• Body → checks only the real bodies (open‑to‑close)
2. Show Labels ( Default true )
If ticked then it will show the text as "Bullish Engulfing" or "Bearish Engulfing".
3. Show The Box ( Default true)
if ticked then it will show the green or red boxes.
INDICATOR LOGIC:
🔹 Bullish Engulfing (green box)
– Current bar closes higher than it opens and fully “wraps” the prior bar per your chosen rule.
🔹 Bearish Engulfing (red box)
– Current bar closes lower than it opens and fully “wraps” the prior bar per your chosen rule.
🔸 When a pattern confirms:
1. The script records the local high/low range.
2. Draws a semi‑transparent box spanning the engulfing pair.
3. Prints a compact up/down label exactly at the reaction point.
4. Fires a once‑per‑bar alert (“Bullish Engulfing” / “Bearish Engulfing”) you can route to webhooks or notifications.
WHY IT IS UNIQUE:
✨ Combines classic body‑only engulfing with an optional wick filter, letting traders demand stricter confirmation when markets are noisy.
✨ Box overlays visually segment the engulfed range—clearer than single‑bar markers.
✨ Lightweight: one input, zero repaint, and capped at 500 boxes to keep charts responsive.
✨ Ready‑to‑use alerts—no extra code needed for automation.
HOW USER CAN BENIFIT FROM IT :
- Spot early reversal zones or continuation thrusts without scanning candle by candle.
- Pair the alerts with trading bots, TradingView strategy testers, or mobile push notifications.
- Adapt the strictness (Body vs. Wicks vs. Both) to suit different assets, timeframes, or volatility regimes.
- Use the colored range boxes as dynamic support/resistance references for entries, targets, and stop‑loss placement.
📌 Tip: Test on multiple instruments and timeframes to find the sweet spot that matches your risk profile. This script is for educational purposes—always combine with sound risk management and confirm signals with broader market context.
Disclaimer :
This Video is not financial advice, it's for educational purposes only highlighting the power of coding( pine script) in TradingView, I am not a SEBI-registered advisor. Trading and investing involve risk, and you should consult with a qualified financial advisor before making any trading decisions. I do not guarantee profits or take responsibility for any losses you may incur.


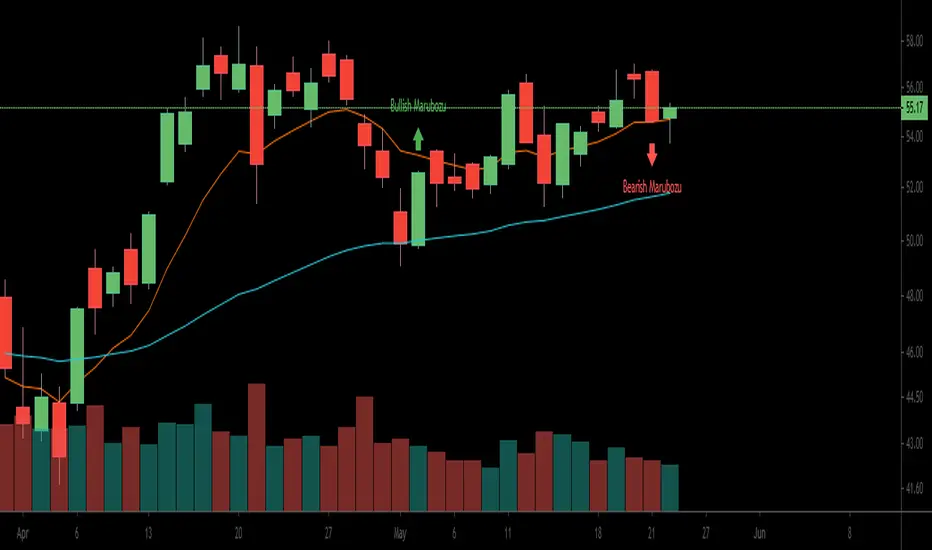
Reversal Candlestick Pattern With Trend IndentifierThis script help to identified popular candlestick pattern combined with trend identifier.
Most script only focus on criteria of the pattern. Such as how much the length of the body compared to previous candle etc.
Besides criteria of the candle, this script also considered the trend into the logic.
For example bullish engulfing is a bullish reversal signal, which is only valid in a down trend.
To identified trend, I'm using RSI. Normally, RSI less than 50 is considered a down trend, and RSI greater than 50 is considered up trend. In this script, you can customize the criteria of how much RSI is up trend and down trend.
Default value RSI >= 55 is up trend, RSI <= 45 is down trend.
Your feedback and suggestion is welcome.
Supported pattern:
White Marubozu (wm)
Black Marubozu (bm)
Hammer (h)
Hanging Man (hm)
Inverted Hammer (ih)
Shooting Star (ss)
Bullish Engulfing (e)
Bearish Engulfing (e)
Tweezer Bottom (tb)
Tweezer Top (tt)
Three White Soldiers (tws)
Three Black Crows (tbc)
Morning Star (ms)
Evening Star (es)
Three Inside Up (tiu)
Three Inside Down (tid)
Reference:
babypips.com


Marubozu ScannerCandlestick Marubozu patterns scanner with multiple settings to fine-tune the scanning.

Candlestick Patterns With EMA and Stochastic and IchimokuEMA, Stochastic RSI, Ichinoku를 이용한 Candle Patterns 입니다.

US30 Challenge ComplementPurpose of the Script
This script is designed to analyze bullish and bearish engulfing patterns on the US30 index. It combines moving averages (MA and EMA) on both daily and hourly charts to detect crossovers, evaluates engulfing candlestick patterns, and adds additional conditions based on the size of candlestick wicks. The script provides visual feedback by coloring bars and plotting flags when certain conditions are met.
Explanation of the Key Features
User Input Parameters:
The script allows users to customize the period and color of both a simple moving average (SMA) and an exponential moving average (EMA). This flexibility enables users to adapt the moving average settings to their preferred strategy.
Moving Averages (MA and EMA):
Two key moving averages are calculated:
A simple moving average (SMA) with a period of 18 for both daily and hourly timeframes.
An exponential moving average (EMA) with a period of 8 for both daily and hourly timeframes.
These moving averages are used to detect whether the EMA is above or below the SMA in both the daily and hourly charts, providing trend direction insights.
Engulfing Patterns:
The script detects bullish and bearish engulfing patterns across multiple candlesticks.
Bullish Engulfing: Occurs when a green candlestick (closing higher than it opens) completely engulfs the body of the previous red candlestick.
Bearish Engulfing: Occurs when a red candlestick (closing lower than it opens) completely engulfs the body of the previous green candlestick.
The script detects these patterns not only for a single previous candle but also up to three previous candles, making it more versatile in recognizing different engulfing scenarios.
A percentage threshold is introduced to ensure that the engulfing candles meet a minimum size requirement, which can be customized by the user.
Cross-Detection on Multiple Timeframes:
The script checks whether the EMA is above or below the SMA on both daily and hourly charts.
This crossover is critical for confirming bullish or bearish conditions. If the EMA is below the SMA on the hourly chart, combined with a bullish engulfing pattern, it suggests a potential bullish reversal. Conversely, if the EMA is above the SMA with a bearish engulfing pattern, it signals a potential bearish reversal.
Candlestick Size and Wick Filters:
The script includes functions to filter candlesticks based on their wick sizes.
Bullish Wick Filter: Ensures that the upper wick of a bullish candle is not too large compared to the body.
Bearish Wick Filter: Ensures that the lower wick of a bearish candle is not too large compared to the body.
These filters help confirm strong candlesticks, reducing noise from candles with long wicks that might indicate indecision.
Visual Cues (Bar Coloring and Flags):
The script colors bars green if bullish engulfing conditions are met and red if bearish engulfing conditions are met. This provides an immediate visual indication of potential reversal points.
It also plots flags above bullish candlesticks and below bearish candlesticks if they have favorable wick characteristics. This adds an extra layer of confirmation for identifying stronger candles.
How to Use the Script
Adjust Parameters:
Before using the script, traders can customize the moving average periods, colors, and the percentage threshold for the engulfing candlesticks. This allows users to fine-tune the script to different timeframes and market conditions.
Engulfing Pattern Detection:
Traders can rely on the script to automatically detect and highlight bullish and bearish engulfing patterns, making it easier to spot potential reversal points. The script considers both single and multi-candlestick engulfing patterns, adding robustness to its detection logic.
Cross-Verification with Moving Averages:
The script adds a layer of confirmation by checking the relationship between the EMA and SMA. Traders can look for alignment between the moving averages and the engulfing patterns to increase the likelihood of successful trades.
Filter Candles Based on Wick Size:
Traders can use the additional wick filters to focus on stronger, more decisive candles. Flags are plotted on these candles, making them easier to identify.
Differences from Other Scripts
Multi-Candle Engulfing Detection: The script detects engulfing patterns over multiple previous candles (up to three), which is not commonly found in most scripts.
Customizable Engulfing Size: The user can set a minimum size threshold for engulfing candles, providing greater control over the pattern detection.
Wick Filters: The inclusion of filters to check for wick size makes this script more precise in identifying strong engulfing candles, reducing false signals from indecisive candles with large wicks.
EMA and SMA Crossover Integration: By integrating moving average crossovers, the script provides additional trend confirmation, increasing the reliability of the engulfing signals.
***************************************************(Español)
Propósito del Script
Este script está diseñado para analizar patrones de envolvente alcista y bajista en el índice US30. Combina medias móviles (MA y EMA) en gráficos diarios y horarios para detectar cruces, evalúa patrones de velas envolventes y añade condiciones adicionales basadas en el tamaño de las mechas. El script ofrece retroalimentación visual coloreando barras y trazando banderas cuando se cumplen ciertas condiciones.
Explicación de las Características Clave
Parámetros de Entrada del Usuario:
El script permite personalizar el período y el color tanto de una media móvil simple (SMA) como de una media móvil exponencial (EMA), lo que permite a los usuarios ajustar las configuraciones según su estrategia.
Medias Móviles (MA y EMA):
Dos medias móviles clave se calculan:
Una media móvil simple (SMA) con un período de 18 tanto para los marcos de tiempo diarios como horarios.
Una media móvil exponencial (EMA) con un período de 8 tanto para los marcos de tiempo diarios como horarios.
Patrones Envolventes:
El script detecta patrones de envolvente alcista y bajista en múltiples velas.
Se introduce un umbral porcentual que garantiza que las velas envolventes tengan un tamaño mínimo, personalizable por el usuario.
Detección de Cruces en Múltiples Marcos Temporales:
El script verifica si la EMA está por encima o por debajo de la SMA en gráficos diarios y horarios, lo que ayuda a confirmar las condiciones de tendencia.
Filtros de Tamaño de Mecha:
El script incluye funciones para filtrar velas según el tamaño de sus mechas, lo que ayuda a identificar velas más fuertes y decisivas.
Indicadores Visuales:
El script colorea las barras en verde si se cumplen las condiciones de envolvente alcista y en rojo si se cumplen las de envolvente bajista. También traza banderas para indicar velas con mechas favorables.
Cómo usar el Script
Ajustar Parámetros.
Detección de Patrones Envolventes.
Verificación con Medias Móviles.
Filtrar Velas Según el Tamaño de Mecha.
Diferencias con Otros Scripts
Detección Multi-Velas de Envolventes.
Tamaño Personalizable de Envolventes.
Filtros de Mechas.
Integración de Cruces de EMA y SMA.

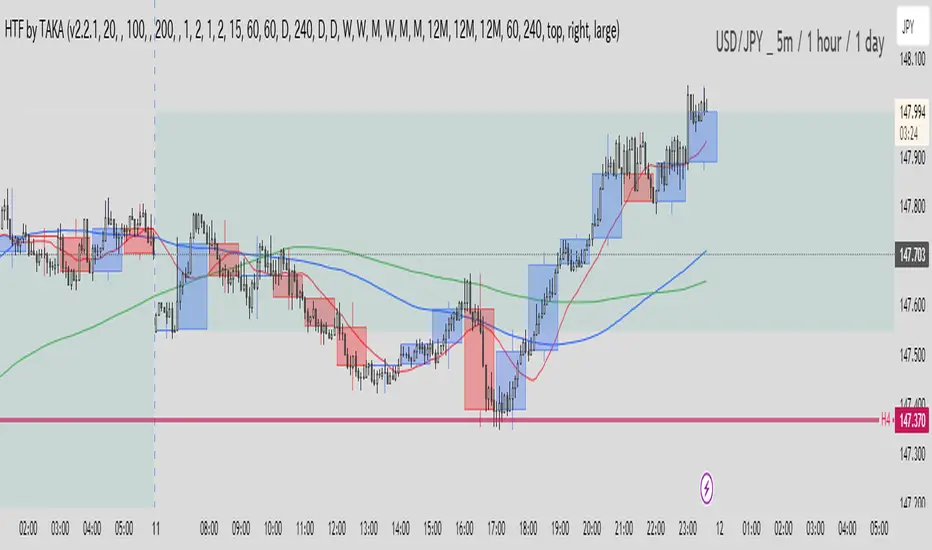
TAKA (Timeframe Adjustment Kasane Ashi)TAKA (Timeframe Adjustment Kasane Ashi)
概要 | Overview
**TAKA (Timeframe Adjustment Kasane Ashi)**インジケーターは、「HTF Candles」スクリプト(「informanerd」作)と、TradingViewのビルトインスクリプト「Multi-Time Period Charts」に触発されて作られました。このスクリプトは、ユーザーが高時間足のローソク足を現在のチャートにオーバーレイ表示できる高度にカスタマイズ可能なインターフェースを提供します。時間足、ローソク足タイプ、そしてボディ、ボーダー、ウィックのスタイリングオプションを簡単に調整できます。
The TAKA (Timeframe Adjustment Kasane Ashi) indicator was inspired by the "HTF Candles" script (created by "informanerd") and TradingView's built-in script "Multi-Time Period Charts." This script provides a highly customizable interface that allows users to overlay higher timeframe candlesticks onto the current chart. You can easily adjust the timeframe, candle type, and styling options for the body, borders, and wicks.
TAKAを使用することで、複数の時間足を通じて市場の大きなトレンドを把握でき、短期的な取引でも長期的な視点を得ることができます。短期トレーダーから長期投資家まで、異なる時間軸での価格動向を視覚的に確認することが可能になります。
By using TAKA, you can understand the larger trends of the market through multiple timeframes and gain a longer-term perspective even in short-term trading. It allows traders and investors of all types to visually confirm price movements across different timeframes.
主な特徴 | Main Features
高時間足(HTF)のローソク足表示 | Higher Timeframe (HTF) Candlestick Display
ユーザーが指定した高時間足(例:日足、週足、月足など)のローソク足を現在のチャートにオーバーレイ表示できます。この機能により、トレーダーは異なる時間軸のチャート上で高時間足のローソク足を視覚的に確認し、市場の大きな動きを把握できます。
Users can overlay higher timeframe candlesticks (e.g., daily, weekly, monthly) onto the current chart. This feature allows traders to visually confirm higher timeframe candlesticks on charts with different timeframes, helping them identify larger market movements.
例: もし15分足のチャートを使用している場合でも、日足のローソク足をオーバーレイ表示し、広い視点で市場動向を分析できます。
Example: Even when using a 15-minute chart, you can overlay daily candlesticks to analyze the market from a broader perspective.
カスタマイズ可能なローソク足タイプ | Customizable Candle Types
Candles(通常のローソク足)、Heikin Ashi(平滑化されたローソク足)、Bars(バー)の3つのローソク足タイプから選択できます。Heikin Ashiは、価格のノイズを減らし、トレンドを視覚的に把握しやすくするため、トレンドを平滑化します。
You can choose from three candlestick types: Candles (regular candlesticks), Heikin Ashi (smoothed candlesticks), and Bars. Heikin Ashi helps smooth out trends and reduces price noise, making it easier to visually interpret market trends.
例: Heikin Ashiローソク足を使用すると、上昇トレンドや下降トレンドがより明確に視覚化されます。
Example: Using Heikin Ashi candlesticks makes it easier to visualize uptrends and downtrends.
ローソク足の色やスタイルのカスタマイズ | Customizable Candle Colors and Styles
ローソク足のボディ(本体)、ボーダー、ウィック(髭)の色を、上昇時と下降時で個別に設定できます。また、ローソク足の幅やスタイル(ソリッド、ドット、破線)も自由に調整可能です。
The body, border, and wick colors of the candlesticks can be customized separately for rising and falling candles. You can also adjust the width and style of the candlesticks (solid, dotted, dashed).
例: 上昇したローソク足を緑、下降したローソク足を赤に設定することで、視覚的に強調できます。
Example: Setting rising candles to green and falling candles to red visually emphasizes the trend.
時間残り表示 | Time Remaining Display
ローソク足の閉じるまでの残り時間を表示するオプションがあります。これにより、次のローソク足が完成するまでの時間を確認し、取引のタイミングを計りやすくなります。
There is an option to display the remaining time until the candlestick closes. This helps traders to track the time until the next candle forms and plan their trading decisions accordingly.
例: 5分足のチャートで、現在の5分足ローソク足が閉じるまでの残り時間を表示し、次のローソク足の形成を意識した取引が可能になります。
Example: On a 5-minute chart, displaying the remaining time for the current candle helps traders plan for the next candlestick.
新しく追加された特徴・機能(TAKA (Timeframe Adjustment Kasane Ashi) v2.0.1以降)| New Features in TAKA (Timeframe Adjustment Kasane Ashi) v2.0.1 and Later
時間足別の移動平均(MA)設定 | Timeframe-specific Moving Average (MA) Settings
ユーザーは、異なる時間足ごとに移動平均(MA)を設定できるようになりました。これにより、1時間足の移動平均、4時間足の移動平均、日足の移動平均など、各時間軸でのトレンドを視覚的に分析できます。
Users can now set moving averages (MA) for different timeframes. This allows you to analyze trends on different timeframes, such as the 1-hour MA, 4-hour MA, and daily MA.
例: 15分足の移動平均を使用して短期的なトレンドを確認し、日足の移動平均を使用して市場全体のトレンドを把握することができます。
Example: Use the 15-minute MA to confirm short-term trends, and the daily MA to understand the overall market trend.
移動平均にタイムフレーム別設定オプション | Timeframe-Specific MA Settings
MA1、MA2、MA3に異なるタイムフレームを設定でき、複数の時間軸での市場の動きを同時に確認できます。
You can set different timeframes for MA1, MA2, and MA3, allowing you to check market movements across multiple timeframes simultaneously.
例: MA1を15分足、MA2を1時間足、MA3を日足に設定して、各時間軸のトレンドを比較できます。
Example: Set MA1 to 15 minutes, MA2 to 1 hour, and MA3 to daily, and compare trends across each timeframe.
時間足別のカスタムタイムフレーム設定 | Custom Timeframe Settings for Each Timeframe
時間足別にカスタマイズできるタイムフレーム設定が追加されました。これにより、例えば5分足、15分足、1時間足、日足、週足など、異なる時間足ごとに適切な高時間足(HTF)の設定を行うことができます。
A new feature allows you to customize the timeframe settings for each timeframe, such as 5 minutes, 15 minutes, 1 hour, daily, and weekly, to use the appropriate higher timeframes (HTF) for each.
例: 1時間足のチャートで4時間足の高時間足を選択し、15分足のチャートで日足の高時間足を選択することができます。
Example: Choose the 4-hour HTF for the 1-hour chart, and the daily HTF for the 15-minute chart.
使用方法 | How to Use
TAKAインジケーターは、任意のチャートに任意の時間足で適用できます。ただし、1分未満の非常に低い時間足では、バー間にギャップが発生する場合があり、ローソク足が正しく描画されないことがあります。
The TAKA indicator can be applied to any chart at any time frame. However, very low timeframes (less than 1 minute) may show gaps between bars and the candlesticks may not render correctly.
「Same as chart」オプションを「Resolution」フィールドで選択すると、インジケーターはローソク足を描画するために適切な高時間足解像度を自動的に選択します。
When the "Same as chart" option is selected in the "Resolution" field, the indicator will automatically select the appropriate higher timeframe resolution for drawing the candlesticks.
リリースノート | Release Notes
TAKA (Timeframe Adjustment Kasane Ashi) v2.0.1以降 | v2.0.1 and Later
新機能と修正 | New Features and Fixes:
時間足別の移動平均(MA)設定 | Timeframe-specific Moving Average (MA) Settings.
高時間足ローソク足のカスタムタイムフレームオプション | Custom Timeframe Options for HTF Candlesticks.
各時間足に対する時間足カスタマイズ設定の追加 | Added Custom Timeframe Settings for Each Timeframe.
TAKAインジケーターで、強力で柔軟な市場分析をお楽しみください!
Enjoy powerful and flexible market analysis with the TAKA indicator!
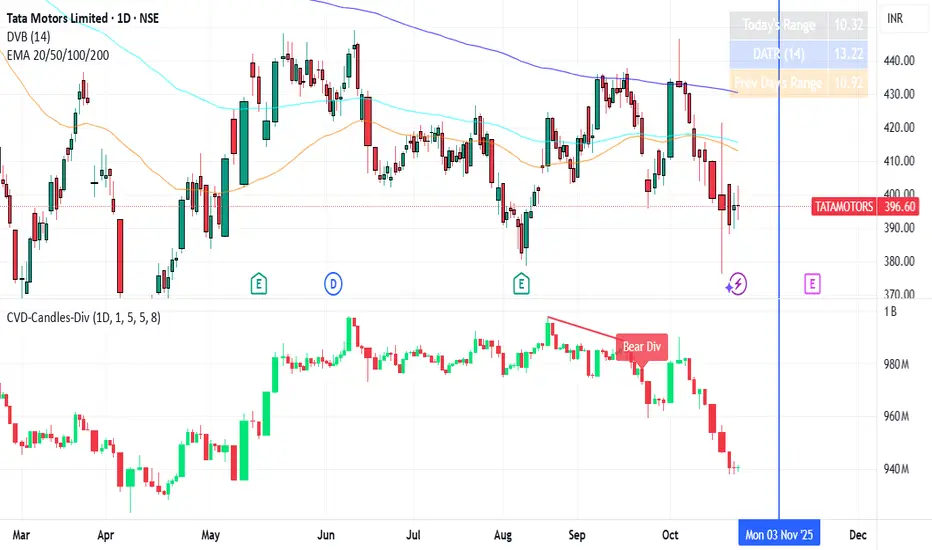
CVD Candles + Divergence (Pane) [NIRALA]This indicator provides a powerful way to analyze market dynamics by visualizing Cumulative Volume Delta (CVD) as candlesticks and automatically detecting divergences between price and order flow. It is designed to help traders spot potential trend exhaustion and reversals that may not be apparent from price action alone.
Key Concepts
Cumulative Volume Delta (CVD): CVD is a running total of the difference between buying and selling volume from market orders. A rising CVD indicates aggressive buying, while a falling CVD indicates aggressive selling. Unlike price, which can be influenced by passive limit orders, CVD shows the raw intent of aggressive market participants.
Divergence: A divergence occurs when price and CVD move in opposite directions. This signals a potential conflict between price action and the underlying order flow, often preceding a reversal.
Bearish Divergence: Price makes a new high, but CVD fails to make a new high (or makes a lower high). This suggests buying aggression is weakening despite the higher price, and a reversal to the downside may be imminent.
Bullish Divergence: Price makes a new low, but CVD fails to make a new low (or makes a higher low). This suggests selling pressure is drying up, and a reversal to the upside may be coming.
Features
CVD as Candlesticks: Plots CVD in a familiar OHLC candlestick format in a separate pane, providing a more intuitive view of order flow momentum and volatility compared to a simple line.
Automatic Divergence Detection: The script automatically identifies classic bullish and bearish divergences between price pivots and CVD pivots, drawing lines on both the main price chart and the indicator pane to clearly highlight them.
Multi-Timeframe Analysis: Calculates CVD from a user-defined lower timeframe, offering a more granular and precise view of the order flow that builds up a single candle on your chart.
Customizable Pivot Lookbacks: Allows you to adjust the sensitivity of the pivot detection for finding both short-term and long-term divergences.
Alerts: Includes built-in alerts that can notify you when a new bullish or bearish divergence is confirmed.
How to Use
Look for High-Probability Setups: This indicator is most powerful when its signals appear at key areas of support or resistance. A divergence at a major price level is a much stronger signal than one in the middle of a range.
Confirm with Price Action: Do not trade on a divergence signal alone. Wait for a confirmation candle (e.g., a bearish engulfing candle after a bearish divergence, or a bullish hammer after a bullish divergence) before considering an entry.
Combine with Your Strategy: Use this indicator as a confirmation tool to enhance your existing trading strategy. For example, if your primary strategy gives a sell signal and this indicator simultaneously prints a bearish divergence, it significantly increases the probability of the trade.
This tool is designed for discretionary traders looking to add a layer of order flow analysis to their decision-making process.
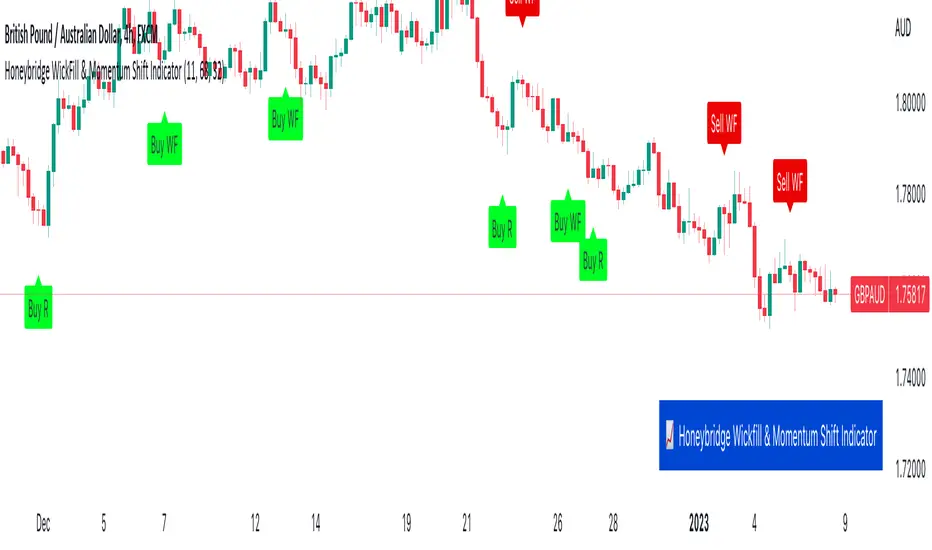
Honeybridge WickFill & Momentum Shift IndicatorAs the creator of this script, I am proud to introduce the "Honeybridge WickFill & Momentum Shift Indicator," a powerful tool for traders looking to capitalize on market opportunities using these two proven strategies.
WICK FILLS
First, let's take a closer look at the WickFill method. In financial markets, candlestick charts are a popular way to visualize the price movement of a security, derivative, or currency over a specific time period. Each candlestick on the chart is composed of a real body and shadows, with the top of the upper shadow representing the highest price paid during the time period, and the bottom of the lower shadow representing the lowest price paid.
The WickFill method involves placing market orders at the closed price indicated by the candlestick. This means that if a trader using this method sees a long upper wick on a bullish candlestick chart, they may place a buy market order at the closed price of the candlestick with the take profit target at the candlestick high price (the highest price paid during the time period), in the belief that the price is likely to rise. Similarly, if they see a long lower wick on a bearish candle, they may place a sell market order at the closed price of the candlestick with the take profit target at the candlestick low price (the lowest price paid during the time period), in the belief that the price is likely to fall.
The idea behind the WickFill method is that the wicks of candlestick chart patterns can provide valuable information about the price action of a security and the sentiment of market participants. By placing market orders at the prices indicated by the candlesticks close, traders using this method hope to capitalize on potential price movements and maximize their returns.
The image below highlights two Wick Fill opportunities. A signal will be provided at the candle close that says: 'Sell WF' or 'Buy WF'.
--------------
MOMENTUM SHIFT REVERSAL
Now, let's turn to the Momentum Shift method. As the name suggests, this method involves identifying changes in the momentum of the price of a security. Traders who use this method are looking to capitalize on shifts in the strength or direction of the price momentum.
There are various ways to trade based on momentum shifts. For example, a trader may look for a security whose price is trending strongly in one direction and then look for a momentum shift that signals a change in the trend. They may then enter a trade in the direction of the new trend, hoping to ride the momentum of the price movement. Alternatively, a trader may look for a security whose price is moving in a range and then look for a momentum shift that signals a breakout from the range. They may then enter a trade in the direction of the breakout, hoping to capitalize on the momentum of the price movement.
--------------
WICK REJECTION REVERSALS
A second Momentum Shift method is the concept of wick rejection reversal trading opportunities. This is a powerful technique for traders looking to capitalize on market opportunities.
So, what exactly is a wick rejection reversal opportunity? Essentially, it is a situation in which the price of a security rejects a wick (or shadow or tail) of a candlestick chart pattern and then reverses direction. For example, if the price is trending upwards and then encounters resistance at a certain level, it may create a long upper wick on a candlestick chart. If the price then falls back below the level of resistance and continues trending downwards, this could be considered a wick rejection reversal opportunity.
Traders can use the Indicator and signals provided to identify wick rejection reversal opportunities by defining certain conditions. For example, the code includes conditions for identifying a "sell reversal" based on the presence of a green candle with a long upper wick, and an RSI value above a certain threshold. This type of setup may indicate that the price is rejecting the resistance represented by the long upper wick and is likely to continue trending downwards.
Similarly, the code includes conditions for identifying a "buy reversal" based on the presence of a red candle with a long lower wick, and an RSI value below a certain threshold. This type of setup may indicate that the price is rejecting the support represented by the long lower wick and is likely to continue trending upwards.
Traders can find wick rejection reversal opportunities particularly beneficial for several reasons. First, these opportunities can provide clear entry and exit points for trades, which can help traders manage risk and maximize their returns. By identifying a specific level of resistance or support that has been rejected by the price, traders can have a clear idea of where to place their orders and where to set their stop-losses.
Second, wick rejection reversal opportunities can be a reliable indicator of market sentiment and direction. By considering the wicks of candlestick chart patterns, traders can gain a deeper understanding of the forces at work in the market and how market participants are reacting to them. This can help traders make more informed decisions about when to enter or exit trades.
Finally, wick rejection reversal opportunities can be found in a variety of market conditions and across different financial instruments. Whether the market is trending, range-bound, or volatile, traders can use this indicator provided to identify wick rejection reversal opportunities and capitalize on them.
In conclusion, wick rejection reversal opportunities are a valuable technique for traders looking to capitalize on market opportunities and improve their returns. By using the indicator provided and considering the wicks of candlestick chart patterns, traders can identify clear entry and exit points, understand market sentiment, and trade across different market conditions and instruments.
The image below depicts two sell opportunities, the top left is a Momentum Shift example and the top right is a Wick Rejection example. A signal will be shown on the chart at the candle close that says: 'Sell R' or 'Buy R'.
--------------
CONCLUSION
So why might traders find the WickFill and Momentum Shift methods useful? There are several reasons. First, these methods can help traders identify potential trade opportunities that may not be immediately apparent from a simple analysis of price trends or chart patterns. By considering the wicks and momentum of a security's price movement, traders can gain a more nuanced understanding of the forces at work in the market and make more informed decisions about when to enter or exit trades.
Second, the WickFill and Momentum Shift methods can be used in conjunction with other technical analysis tools and techniques. For example, traders may use moving averages, oscillators, and trendlines to help confirm the presence of a WickFill or Momentum Shift opportunity. This can help traders increase the reliability and profitability of their trades.
Finally, the WickFill and Momentum Shift methods can be applied to a wide range of financial instruments, including stocks, forex, futures, and more. This versatility makes them useful for traders with diverse investment portfolios and strategies.
Overall, the WickFill and Momentum Shift methods are powerful tools for traders looking to capitalize on market opportunities and improve their returns. By considering the wicks and momentum of a security's price movement, traders can find profitable trading opportunities.
------------
FINAL COMMENT
Just like any other indicator or strategy out there, please consider the timeframe and asset that you are using this indicator with. Higher timeframe price action is more reliable than lower timeframe price action. For example, the 4H and Daily timeframes will provide more reliable signals than the 5m timeframe. With regards to assets, the indicator works extremely well with Forex pairs and Commodities, such as Gold.
I hope you enjoy the indicator.