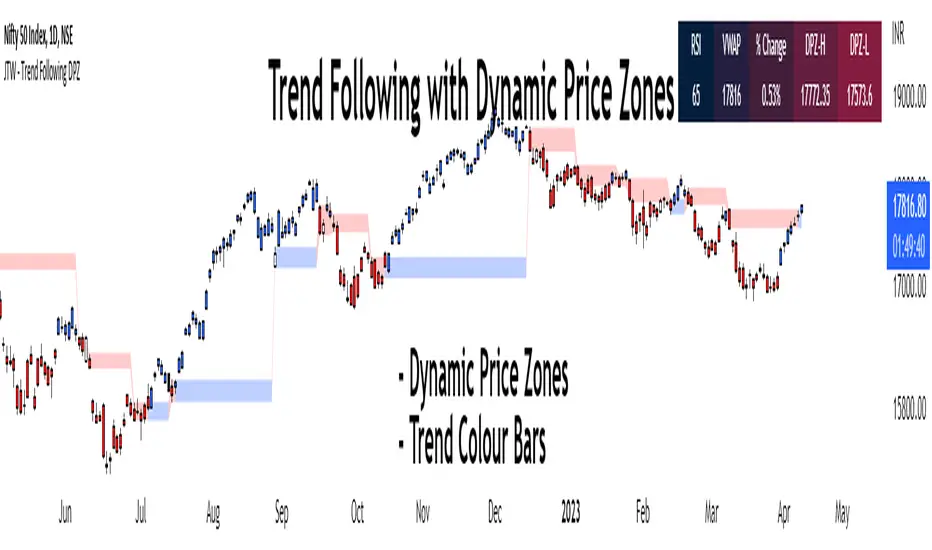
Trend Following with Dynamic Price ZonesThis script provides a complete framework for following trends , especially on those assets which are sufficiently liquid and don't go through random spikes.
Since it is a trend-following system, it works well during trends only. However, I cannot claim any numbers since the execution requires some discretion at the user's end. This framework can also be combined with other technical tools such as trend lines to increase its efficacy.
Features:
Dynamic Price Zones:
• The Dynamic Price Zones (DPZ) are determined using a proprietary logic that incorporates price movement and certain other factors.
• These zones change more rapidly than conventional support and resistance (S/R) zones, which is why I have named them "Dynamic".
• DPZs can serve as support and resistance zones and help with trend identification to some extent.
• The upper boundary of a zone is called Dynamic Price Zone High (DPZ-H) , while the lower boundary is called Dynamic Price Zone Low (DPZ-L) .
Colour Bars:
• Candle colours are based on another proprietary logic, independent of dynamic price zones .
• These are not traditional moving average-based coloured bars, which is evident from the presence of uncoloured bars in between.
• The uncoloured bars indicate periods of uncertain trends .
• Colour functionality helps in smoothening the trend and assists in riding it for as long as possible.
Stats Table:
• RSI
• VWAP
• % Change from the previous day's closing
• Dynamic Price Zone High (DPZ-H) value
• Dynamic Price Zone Low (DPZ-L) value
Settings:
• DPZs are displayed as horizontal lines with background fill by default, but users can toggle lines and background fill on or off.
• Bar colours can be customized according to user preferences.
• The table can be enabled or disabled based on user input.
• The position of the table can be changed based on 4 available options: Top Left, Top Right, Bottom Left, and Bottom Right.
• Users can toggle individual table fields on or off . For example: If the user wants to hide "Vwap" and "%Change" values, he can turn them off. In that case, only 3 fields will be displayed on the table without occupying additional space.
• Background and text colours for each field of the table can be customized based on user preferences.
How to Use the Dynamic Price Zones:
• When the price is above a DPZ, it indicates a bullish trend , suggesting the possibility of higher prices. These zones are termed Bullish DPZs.
• Conversely, if the price is below a DPZ, it signals a bearish trend , with an expectation of lower prices. These zones are termed Bearish DPZs.
• In a trending market, when the price returns to a previous DPZ, it can present a trading opportunity in the direction of the prior trend (e.g., if the market is falling and the price returns to a previous DPZ, it is likely to reject it).
• Consecutive ascending DPZs indicate a shift in buyers from lower to higher levels and can provide buying opportunities. This also indicates a period of a strong bullish trend.
• Similarly, consecutive descending DPZs indicate a shift in sellers from higher to lower levels and can provide selling opportunities. This also indicates a period of a strong bearish trend.
• Please note that we must be flexible when determining the consecutive zones. For example: There may be a few smaller bearish DPZs in between the bullish DPZs but if the area is dominated by the bullish DPZs then we can consider the zones as consecutive. Similar is true for bearish consecutive zones.
• Closely stacked or adjacent zones suggest that prices will likely remain within a range, moving sideways.
• Wider zones act as big hurdles and, the price may struggle to cross them. They may also lead to a sideways movement.
• Zones that remain clean and untested for several sessions are likely to act as strong support or resistance when the price revisits them.
Bullish Examples:
Bearish Examples:
Some Examples of the Complete System
Trend follower system combined with Trendlines
Special Thanks
I would like to extend my special thanks to all the experts whose lectures and blogs I have studied to gain a limited yet significant knowledge of the Pine language.
Best regards,
Rajat Kumar Singh (@johntradingwick)
Community Manager (India), TradingView.
Поиск скриптов по запросу "TRENDLINES"
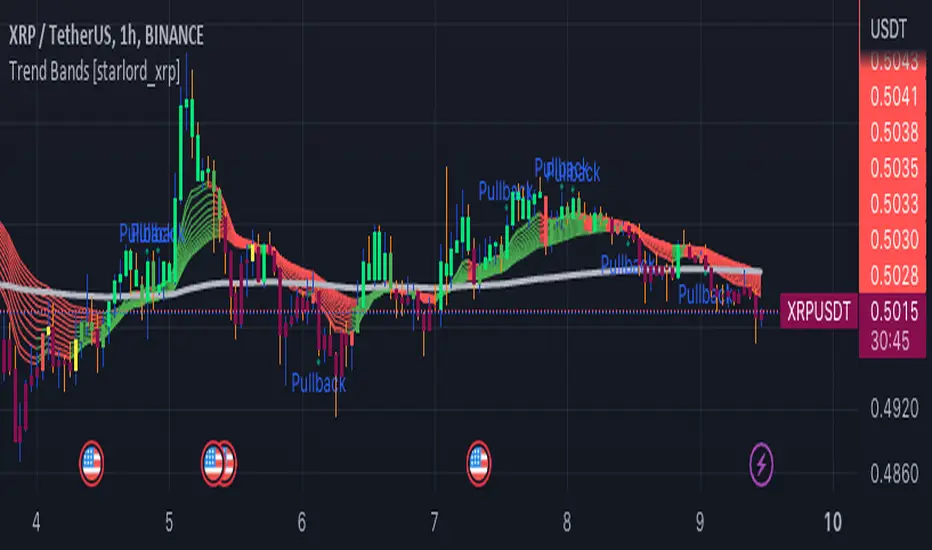
Trend Bands [starlord_xrp]This indicator uses multiple trendlines to determine the overall trend and trend changes. It also highlights areas of potential pullbacks to entry.
Swing Counter [theEccentricTrader]█ OVERVIEW
This indicator counts the number of confirmed swing high and swing low scenarios on any given candlestick chart and displays the statistics in a table, which can be repositioned and resized at the user's discretion.
█ CONCEPTS
Green and Red Candles
• A green candle is one that closes with a high price equal to or above the price it opened.
• A red candle is one that closes with a low price that is lower than the price it opened.
Swing Highs and Swing Lows
• A swing high is a green candle or series of consecutive green candles followed by a single red candle to complete the swing and form the peak.
• A swing low is a red candle or series of consecutive red candles followed by a single green candle to complete the swing and form the trough.
Peak and Trough Prices (Basic)
• The peak price of a complete swing high is the high price of either the red candle that completes the swing high or the high price of the preceding green candle, depending on which is higher.
• The trough price of a complete swing low is the low price of either the green candle that completes the swing low or the low price of the preceding red candle, depending on which is lower.
Peak and Trough Prices (Advanced)
• The advanced peak price of a complete swing high is the high price of either the red candle that completes the swing high or the high price of the highest preceding green candle high price, depending on which is higher.
• The advanced trough price of a complete swing low is the low price of either the green candle that completes the swing low or the low price of the lowest preceding red candle low price, depending on which is lower.
Green and Red Peaks and Troughs
• A green peak is one that derives its price from the green candle/s that constitute the swing high.
• A red peak is one that derives its price from the red candle that completes the swing high.
• A green trough is one that derives its price from the green candle that completes the swing low.
• A red trough is one that derives its price from the red candle/s that constitute the swing low.
Historic Peaks and Troughs
The current, or most recent, peak and trough occurrences are referred to as occurrence zero. Previous peak and trough occurrences are referred to as historic and ordered numerically from right to left, with the most recent historic peak and trough occurrences being occurrence one.
Upper Trends
• A return line uptrend is formed when the current peak price is higher than the preceding peak price.
• A downtrend is formed when the current peak price is lower than the preceding peak price.
• A double-top is formed when the current peak price is equal to the preceding peak price.
Lower Trends
• An uptrend is formed when the current trough price is higher than the preceding trough price.
• A return line downtrend is formed when the current trough price is lower than the preceding trough price.
• A double-bottom is formed when the current trough price is equal to the preceding trough price.
█ FEATURES
Inputs
• Start Date
• End Date
• Position
• Text Size
• Show Sample Period
• Show Plots
• Show Lines
Table
The table is colour coded, consists of three columns and nine rows. Blue cells denote neutral scenarios, green cells denote return line uptrend and uptrend scenarios, and red cells denote downtrend and return line downtrend scenarios.
The swing scenarios are listed in the first column with their corresponding total counts to the right, in the second column. The last row in column one, row nine, displays the sample period which can be adjusted or hidden via indicator settings.
Rows three and four in the third column of the table display the total higher peaks and higher troughs as percentages of total peaks and troughs, respectively. Rows five and six in the third column display the total lower peaks and lower troughs as percentages of total peaks and troughs, respectively. And rows seven and eight display the total double-top peaks and double-bottom troughs as percentages of total peaks and troughs, respectively.
Plots
I have added plots as a visual aid to the swing scenarios listed in the table. Green up-arrows with ‘HP’ denote higher peaks, while green up-arrows with ‘HT’ denote higher troughs. Red down-arrows with ‘LP’ denote higher peaks, while red down-arrows with ‘LT’ denote lower troughs. Similarly, blue diamonds with ‘DT’ denote double-top peaks and blue diamonds with ‘DB’ denote double-bottom troughs. These plots can be hidden via indicator settings.
Lines
I have also added green and red trendlines as a further visual aid to the swing scenarios listed in the table. Green lines denote return line uptrends (higher peaks) and uptrends (higher troughs), while red lines denote downtrends (lower peaks) and return line downtrends (lower troughs). These lines can be hidden via indicator settings.
█ HOW TO USE
This indicator is intended for research purposes and strategy development. I hope it will be useful in helping to gain a better understanding of the underlying dynamics at play on any given market and timeframe. It can, for example, give you an idea of any inherent biases such as a greater proportion of higher peaks to lower peaks. Or a greater proportion of higher troughs to lower troughs. Such information can be very useful when conducting top down analysis across multiple timeframes, or considering entry and exit methods.
What I find most fascinating about this logic, is that the number of swing highs and swing lows will always find equilibrium on each new complete wave cycle. If for example the chart begins with a swing high and ends with a swing low there will be an equal number of swing highs to swing lows. If the chart starts with a swing high and ends with a swing high there will be a difference of one between the two total values until another swing low is formed to complete the wave cycle sequence that began at start of the chart. Almost as if it was a fundamental truth of price action, although quite common sensical in many respects. As they say, what goes up must come down.
The objective logic for swing highs and swing lows I hope will form somewhat of a foundational building block for traders, researchers and developers alike. Not only does it facilitate the objective study of swing highs and swing lows it also facilitates that of ranges, trends, double trends, multi-part trends and patterns. The logic can also be used for objective anchor points. Concepts I will introduce and develop further in future publications.
█ LIMITATIONS
Some higher timeframe candles on tickers with larger lookbacks such as the DXY , do not actually contain all the open, high, low and close (OHLC) data at the beginning of the chart. Instead, they use the close price for open, high and low prices. So, while we can determine whether the close price is higher or lower than the preceding close price, there is no way of knowing what actually happened intra-bar for these candles. And by default candles that close at the same price as the open price, will be counted as green. You can avoid this problem by utilising the sample period filter.
The green and red candle calculations are based solely on differences between open and close prices, as such I have made no attempt to account for green candles that gap lower and close below the close price of the preceding candle, or red candles that gap higher and close above the close price of the preceding candle. I can only recommend using 24-hour markets, if and where possible, as there are far fewer gaps and, generally, more data to work with. Alternatively, you can replace the scenarios with your own logic to account for the gap anomalies, if you are feeling up to the challenge.
The sample size will be limited to your Trading View subscription plan. Premium users get 20,000 candles worth of data, pro+ and pro users get 10,000, and basic users get 5,000. If upgrading is currently not an option, you can always keep a rolling tally of the statistics in an excel spreadsheet or something of the like.
█ NOTES
I feel it important to address the mention of advanced peak and trough price logic. While I have introduced the concept, I have not included the logic in my script for a number of reasons. The most pertinent of which being the amount of extra work I would have to do to include it in a public release versus the actual difference it would make to the statistics. Based on my experience, there are actually only a small number of cases where the advanced peak and trough prices are different from the basic peak and trough prices. And with adequate multi-timeframe analysis any high or low prices that are not captured using basic peak and trough price logic on any given time frame, will no doubt be captured on a higher timeframe. See the example below on the 1H FOREXCOM:USDJPY chart (Figure 1), where the basic peak price logic denoted by the indicator plot does not capture what would be the advanced peak price, but on the 2H FOREXCOM:USDJPY chart (Figure 2), the basic peak logic does capture the advanced peak price from the 1H timeframe.
Figure 1.
Figure 2.
█ RAMBLINGS
“Never was there an age that placed economic interests higher than does our own. Never was the need of a scientific foundation for economic affairs felt more generally or more acutely. And never was the ability of practical men to utilize the achievements of science, in all fields of human activity, greater than in our day. If practical men, therefore, rely wholly on their own experience, and disregard our science in its present state of development, it cannot be due to a lack of serious interest or ability on their part. Nor can their disregard be the result of a haughty rejection of the deeper insight a true science would give into the circumstances and relationships determining the outcome of their activity. The cause of such remarkable indifference must not be sought elsewhere than in the present state of our science itself, in the sterility of all past endeavours to find its empirical foundations.” (Menger, 1871, p.45).
█ BIBLIOGRAPHY
Menger, C. (1871) Principles of Economics. Reprint, Auburn, Alabama: Ludwig Von Mises Institute: 2007.

Shorting when Bollinger Band Above Price with RSI (by Coinrule)The Bollinger Bands are among the most famous and widely used indicators. A Bollinger Band is a technical analysis tool defined by a set of trendlines plotted two standard deviations (positively and negatively) away from a simple moving average ( SMA ) of a security's price, but which can be adjusted to user preferences. They can suggest when an asset is oversold or overbought in the short term, thus providing the best time for buying and selling it.
The relative strength index ( RSI ) is a momentum indicator used in technical analysis. RSI measures the speed and magnitude of a security's recent price changes to evaluate overvalued or undervalued conditions in the price of that security. The RSI can do more than point to overbought and oversold securities. It can also indicate securities primed for a trend reversal or corrective pullback in price. It can signal when to buy and sell. Traditionally, an RSI reading of 70 or above indicates an overbought situation. A reading of 30 or below indicates an oversold condition.
The short order is placed on assets that present strong momentum when it's more likely that it is about to reverse. The rule strategy places and closes the order when the following conditions are met:
ENTRY
The closing price is greater than the upper standard deviation of the Bollinger Bands
The RSI is less than 70.
EXIT
The trade is closed when the RSI is less than 70
The lower standard deviation of the Bollinger Band is less than the closing price.
This strategy was backtested from the beginning of 2022 to capture how this strategy would perform in a bear market.
The strategy assumes each order to trade 70% of the available capital to make the results more realistic. A trading fee of 0.1% is taken into account. The fee is aligned to the base fee applied on Binance, which is the largest cryptocurrency exchange by volume.

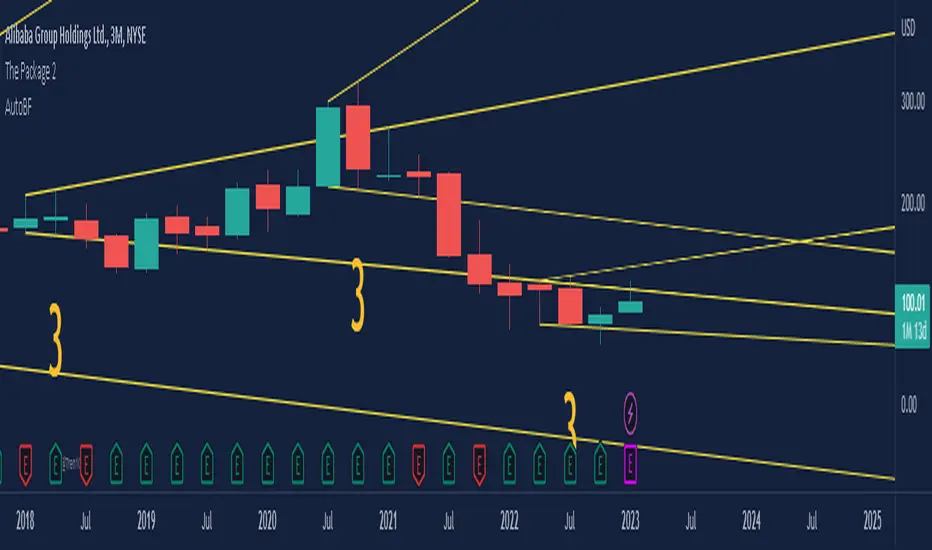
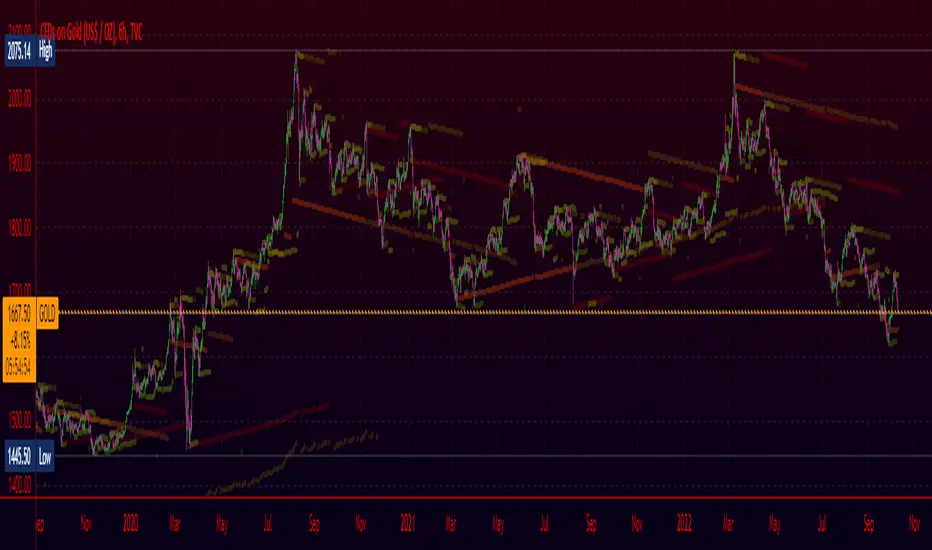
AutoBF by Tren10xBroadening Formation is a powerful technical analysis tool that is characterized by two converging trendlines that widen over time. This pattern typically signals a period of volatility and uncertainty in the market and can indicate a potential reversal in trend direction.
This script uses advanced algorithms to automatically detect and plot broadening formations on your chart, making it easy to identify these patterns and potentially profit from them, all while saving you time from drawing them yourself. With customizable settings, this indicator is a must-have tool for any trader looking to take advantage of this powerful chart pattern.
Features:
● Automatically detects and plots broadening formations on any chart within TradingView
● Customizable settings for greater flexibility and control
● Choose to draw your broadening formation from the outside bar to the "Previous Candle" or "Compound Candle" aka to the previous lowest/highest candle within the outside bar.
● Clear visual display of broadening formations and easy identification
● Compatible with all markets and timeframes, from stocks and forex to cryptocurrencies and commodities
● Designed for both novice and experienced traders, with user-friendly interface and comprehensive documentation
● By default, the year will look back 75 years, the quarter will look back 20 years, the month will look back 7 years, the week will look back 3 years, and the day will look back 90 days. However, you now have the ability to change these at your will.
● Added the ability to enable Broadening Formations on the 6 Month, 2 Month, 2 Week, and 2 Day charts.
● ALERTS! Receive timely notifications when the price breaches or activates a broadening formation.
All Timeframes available:
● Year
● 6 Month
● Quarter
● 2 Month
● Month
● 2 Week
● Week
● 2 Day
● Day
tinyurl.com
Predicting future outcomes is impossible. Nobody knows what the future will bring. With this Broadening Formation Indicator, you will have the edge you need to identify potentially profitable trading opportunities and make more informed decisions in the markets.
Regards,
Tren10x
Disclaimer: It is essential to note that returns on investments are not guaranteed, and investors should exercise prudence in conducting thorough due diligence before making any investment decisions
I would like to express my gratitude to my wife for her meticulous testing and insightful contributions throughout the course of this project. Additionally, I extend my appreciation to the esteemed Alpha Pack Group, whose exceptional acumen and investment expertise have been instrumental in the success of this endeavor.
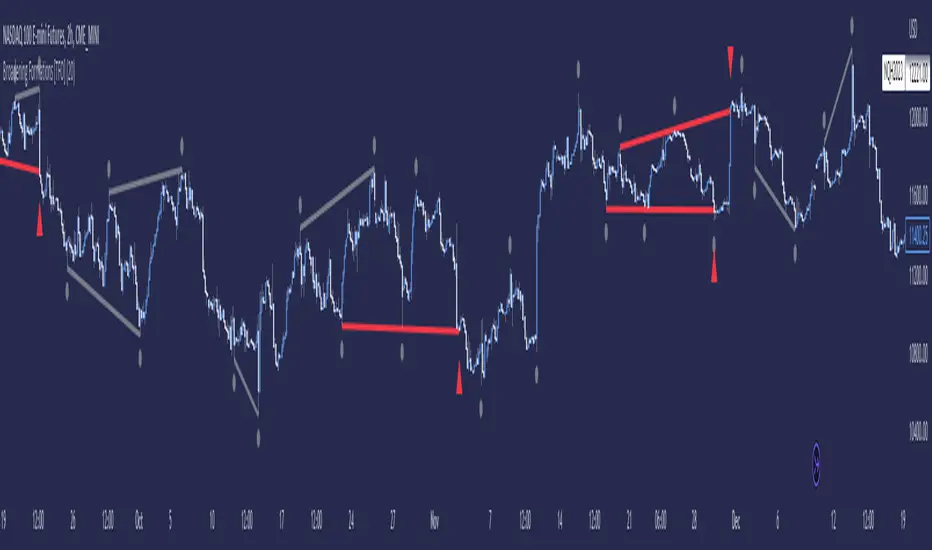
Broadening Formations [TFO]This indicator highlights deviations from broadening formations (or megaphone patterns). Deviations from broadening ranges can often foreshadow reversals, especially in consolidation phases. These deviations are highlighted via trendlines that change color when tested, and also have the option to be alerted.
These broadening formations are heavily used with "The Strat" and can add confluence when looking for reversals within higher timeframe points of interest.
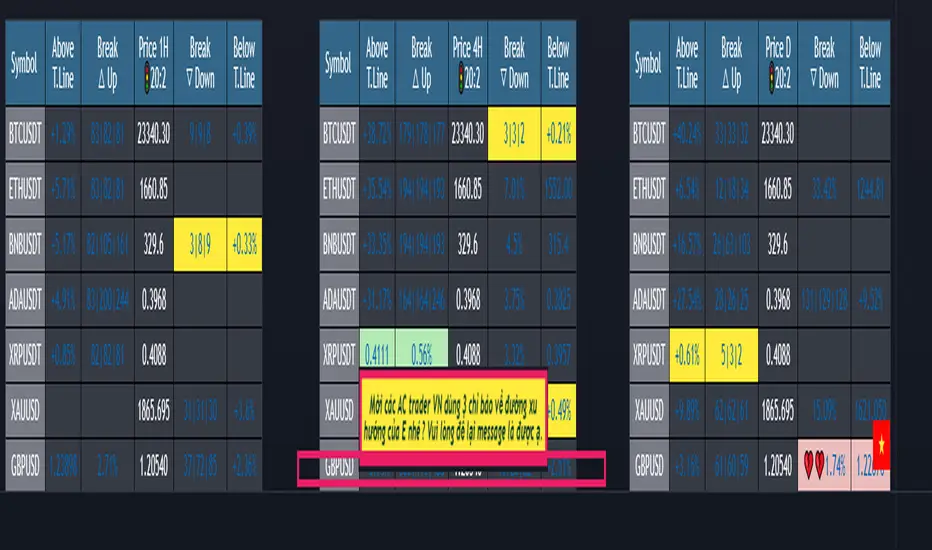
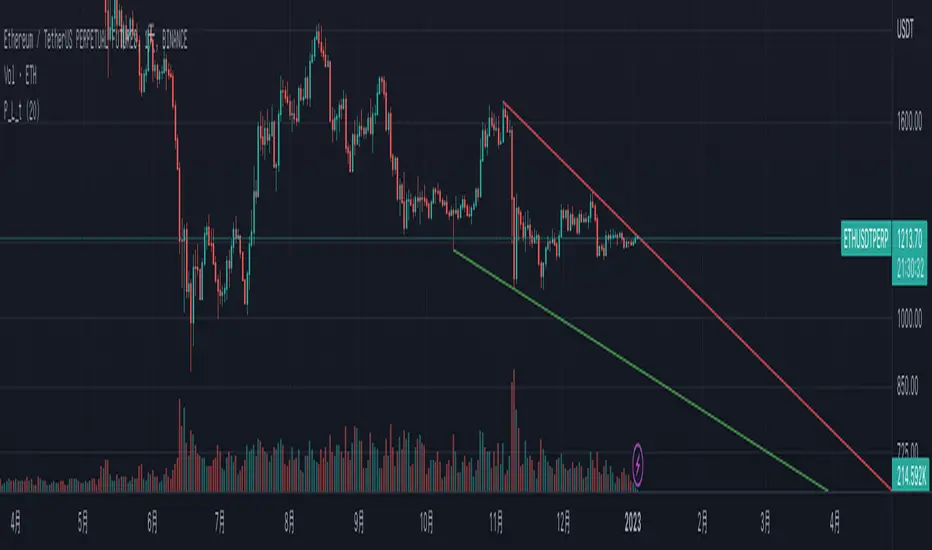
(1-20)Dashboard trendlines PriceThis is a script about 20 trading pairs with trendline.
-on each chart of a trading pair, there is only one trendline pair: 1 uptrendline and 1 downtrendline
-so when the statistics on the table also show the column of the uptrend and the column of the downtrend
-When the price approaches any trendline but the ratio is 1%, that trendline will be colored blue (downtrend), red (uptrend)
-the column above T.line(below T.line) is the value of the current trendline compared to the closing price of the candle
-The Break up (Break down) column when the price breaks will show the green heart (break up), the red heart break (break down) and the percentage value when breaking through the point of the trendline.
-price column is the current price of the candle
-especially when a candle has closed above the trendline (assuming an uptrend), then from the 2nd tree to the current , it will count according to memory so that traders know when the price broke, and how many candles already.
-The breakdown parameter is displayed (for example, 3|8|10), which means that the price has broken through 10 candles, of which 8 trees are closing above the breakout point, and the last 3 are closing above. break point
-In addition, when displaying 3 parameters as above, the next column (above/below T.line) will display the percentage from when the price breaks that point to the current price of the candle.
-you can change the time in Resolution indicator settings to show multiple time arcs
Thank you everyone for your interest and trust
- 5 pairs are free for traders :https://vn.tradingview.com/script/KGSjrLC3/
---------------------------------------------------------------------------------
Vietnamese
Đây là script về bảng thống kê 20 cặp giao dịch với đường trendline .
-trên mỗi biểu đồ của cặp giao dịch chỉ tồn tại duy nhất 1 cặp trendline là: 1trendline tăng và 1 trendline giảm
-vì vậy khi thống kê trên bảng cũng hiển thị cột của trend tăng và cột của trend giảm
-khi giá tiến gần đến 1 đường trendline bất kì mà tỉ lệ còn 1% thì đường trendline đó tô màu xanh(trend giảm) ,màu đỏ(trend tăng)
-cột above T.line(below T.line) là giá trị của đường trendline hiện tại so với giá đóng cửa của nến
-cột Break up(Break down) khi giá phá vỡ sẽ thể thiện trái tim xanh(phá vỡ lên),trái tim đỏ vỡ(phá vỡ xuống) và giá trị phần trăm khi phá qua điểm của trendline.
-cột giá là giá hiện tại của nến
-đặc biệt khi 1 cây nến đã đóng cửa trên đường trendline(giả sử trend tăng) thì từ cây thứ 2 đến hiện tại nó sẽ đếm theo bộ nhớ để các trader biết được giá đã phá khi nào,và qua bao nhiêu nến rồi.
-thông số khi phá vỡ hiển thị (ví dụ là 3|8|10) thì hiểu là giá đã phá vỡ qua 10 nến, trong đó có 8 cây đóng cửa trên điểm phá vỡ,và 3 cây gần nhất đang đóng cửa trên điểm phá vỡ
-ngoài ra khi hiện 3 thông số như trên thì cột bên cạnh (above/below T.line) sẽ hiển thị được số phần trăm tính từ khi giá phá vỡ điểm đó đến giá hiện tại của cây nến.
-các bạn có thể thay đổi thời gian trong cài đặt chỉ báo Resolution để hiển thị nhiều cung thời gian
Cảm ơn mọi người đã quan tâm và tin dùng
MATHR3E LINES█ OVERVIEW
MATHR3E LINES automatically draws Demand lines and Supply lines with their associated targets
█ CONCEPTS
Disclaimer:
MATHR3E LINES indicator is intended for advanced traders and may fit your profile, whether you are a day trader or a long-term investor.
It was originally developed by a renowned market analyst and documented in numerous books. Among them is the author Jason Perl.
It is recommended to have read the trading techniques mentioned in the books covering this indicator beforehand.
How to use:
The indicator draws Demand lines and Supply lines with their associated targets.
These lines connect pivot points which are:
- Lows surrounded on either side by higher lows
- Highs surrounded on either side by lower highs.
The key to drawing trend lines objectively is to select the right pivot points. Their significance is determined by the number of surrounding highs and lows.
By default, these are set to 1 since they are more sensitive to price action than higher level pivot points, and therefore provide an earlier breakout signal.
Another approach suggests that the most significant points to connect are those whose levels coincide with trend reversals.
Once you have chosen a demand line, there are 3 conditions that must be met for the trend line to be used.
As far as one or more of the conditions is met, a break of the intrabar trendline is expected, and a closing violation above the breakout level is likely.
Qualifiers
• Qualifier #1: Reverse Break
• Qualifier #2: Gap Break
• Qualifier #3: Pressure Break
In turn, a confirmed breakout entry may be invalidated the following bar, if any of the disqualifying conditions occur:
Disqualifiers
• Open Failure
• Close Failure
• H/L Failure
█ FEATURES & BENEFITS
Versatile:
This indicator can be applied to any market or time frame.
The methodology is equally relevant whether you are day trading or position trading.
Breakout confirmation:
• If a breakout is confirmed, its associated lines will turn solid.
• Otherwise, for invalidated breakouts or broken trendlines , they will remain dashed
Alerts
Get notified on:
•Demand/Supply Line Confirmed Breaks
•Demand/Supply Invalidated Breaks
•Demand/Supply Target Reached

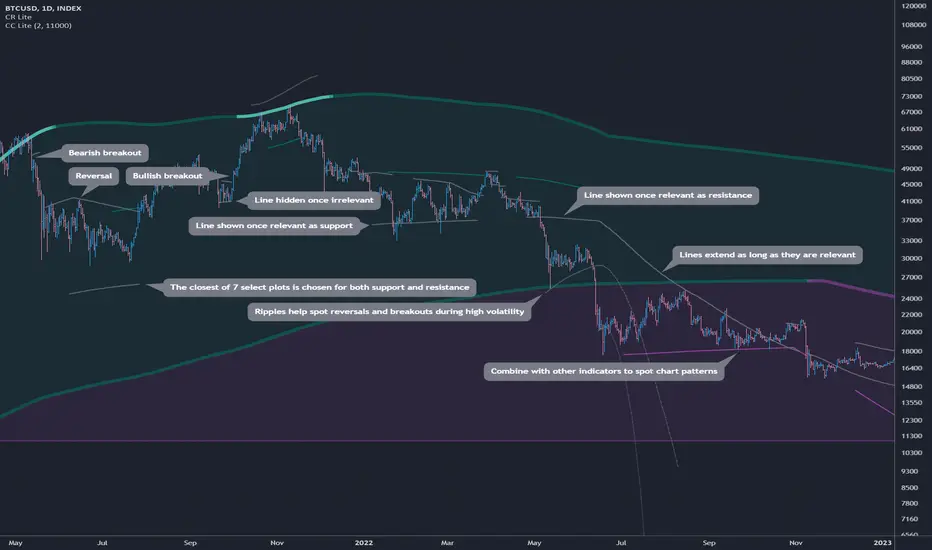
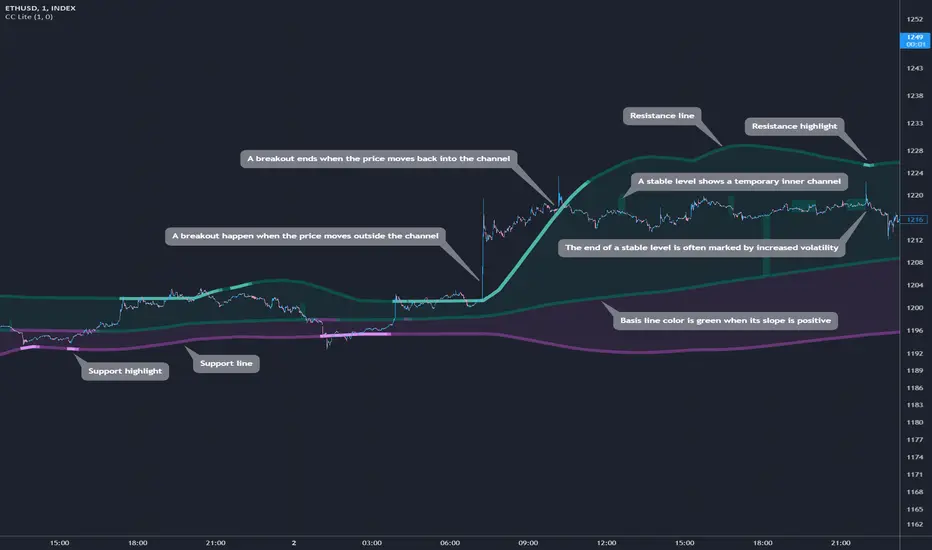
Cosmic Rays LiteCosmic Rays Lite ( CR Lite ) draws dynamic non-repainting trendlines and helps
⭐ see small and large trends
⭐ predict reversals with high accuracy
⭐ spot bullish and bearish breakouts
⭐ time the end of breakouts
👀 HOW IT WORKS
Cosmic Rays Lite compresses 14 moving averages of varying type and length into 7 plots and filters those down into the closest support and resistance lines. When the price moves above final resistance or below final support, additional "ripple" lines are appended using aggregate standard deviation multiples. The visibility of each line is toggled depending on its stability and its proximity to the price.
📗 HOW TO USE IT
Cosmic Rays Lite is designed specifically to be visible only during the most relevant times so as not to clutter your main setup. Likewise you will know to pay attention when a certain Cosmic Rays Lite level is shown. The main strategies are:
long when the price reverses off of the support line and short when the price reverses off of the resistance line
long when the price breaks above a support or resistance line and short when it breaks below
long when it reaches a support ripple line and short when the price reaches a resistance ripple line
use in combination with other indicators to spot chart patterns such as triangles (see chart)
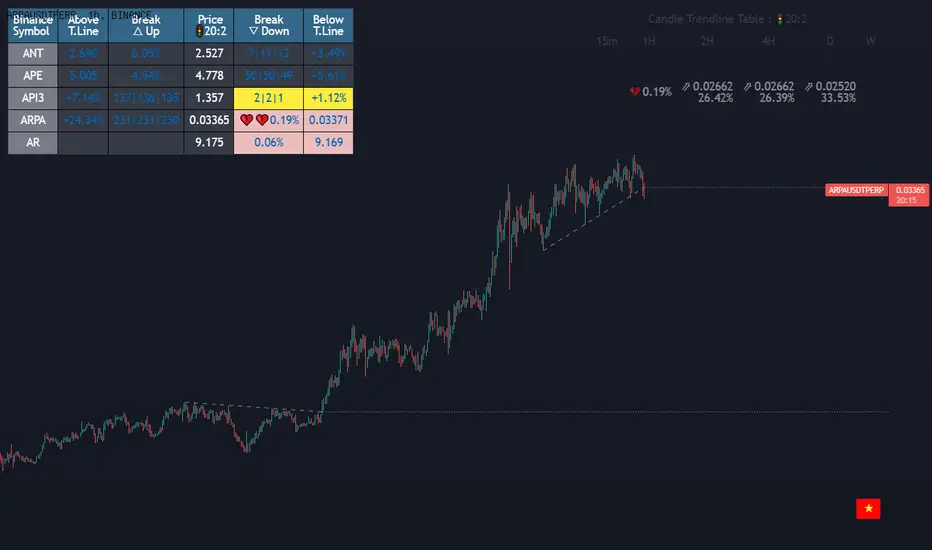
Dashboard trendlines Price(ichimoku14642)Happy new year 2023
Dedicated to traders, the trendline indicator of 5 trading pairs is automatically listed in this table. Wish success
-on each chart of a trading pair, there is only one trendline pair: 1 uptrendline and 1 downtrendline
-so when the statistics on the table also show the column of the uptrend and the column of the downtrend
-When the price approaches any trendline but the ratio is 1%, that trendline will be colored blue (downtrend), red (uptrend)
-the column above T.line(below T.line) is the value of the current trendline compared to the closing price of the candle
-The Break up (Break down) column when the price breaks will show the green heart (break up), the red heart break (break down) and the percentage value when breaking through the point of the trendline.
-price column is the current price of the candle
-SYMBOL is all taken from Binance in the perpetual contract
-especially when a candle has closed above the trendline (assuming an uptrend), then from the 2nd tree to the current , it will count according to memory so that traders know when the price broke, and how many candles already.
-The breakdown parameter is displayed (for example, 3|8|10), which means that the price has broken through 10 candles, of which 8 trees are closing above the breakout point, and the last 3 are closing above. break point
-In addition, when displaying 3 parameters as above, the next column (above/below T.line) will display the percentage from when the price breaks that point to the current price of the candle.
Thank you everyone for your interest and trust
Đây là script về bảng thống kê đường trendline .
-trên mỗi biểu đồ của cặp giao dịch chỉ tồn tại duy nhất 1 cặp trendline là: 1trendline tăng và 1 trendline giảm
-vì vậy khi thống kê trên bảng cũng hiển thị cột của trend tăng và cột của trend giảm
-khi giá tiến gần đến 1 đường trendline bất kì mà tỉ lệ còn 1% thì đường trendline đó tô màu xanh(trend giảm) ,màu đỏ(trend tăng)
-cột above T.line(below T.line) là giá trị của đường trendline hiện tại so với giá đóng cửa của nến
-cột Break up(Break down) khi giá phá vỡ sẽ thể thiện trái tim xanh(phá vỡ lên),trái tim đỏ vỡ(phá vỡ xuống) và giá trị phần trăm khi phá qua điểm của trendline.
-cột giá là giá hiện tại của nến
-SYMBOL là toàn bộ lấy của sàn Binance trong hợp đồng vĩnh cửu
-đặc biệt khi 1 cây nến đã đóng cửa trên đường trendline(giả sử trend tăng) thì từ cây thứ 2 đến hiện tại nó sẽ đếm theo bộ nhớ để các trader biết được giá đã phá khi nào,và qua bao nhiêu nến rồi.
-thông số khi phá vỡ hiển thị (ví dụ là 3|8|10) thì hiểu là giá đã phá vỡ qua 10 nến, trong đó có 8 cây đóng cửa trên điểm phá vỡ,và 3 cây gần nhất đang đóng cửa trên điểm phá vỡ
-ngoài ra khi hiện 3 thông số như trên thì cột bên cạnh (above/below T.line) sẽ hiển thị được số phần trăm tính từ khi giá phá vỡ điểm đó đến giá hiện tại của cây nến.
Cảm ơn mọi người đã quan tâm và tin dùng
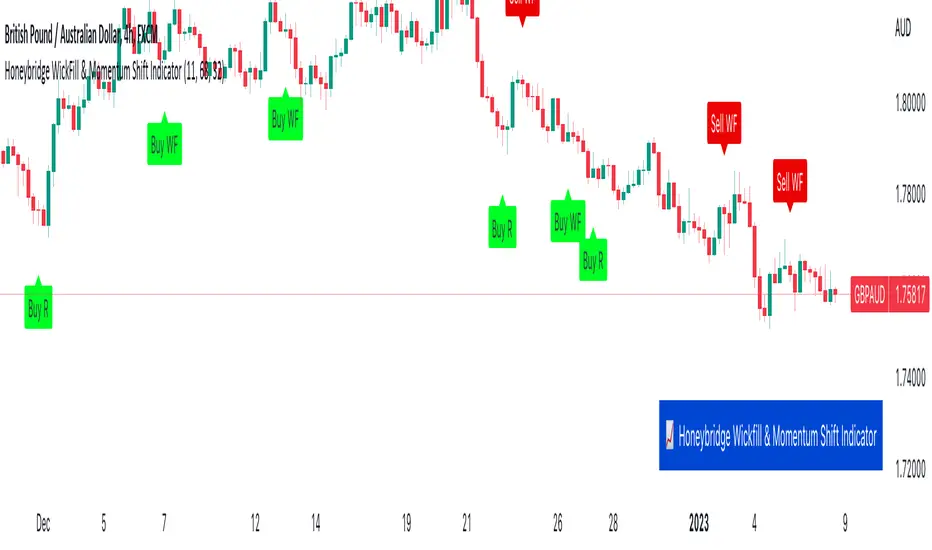
Honeybridge WickFill & Momentum Shift IndicatorAs the creator of this script, I am proud to introduce the "Honeybridge WickFill & Momentum Shift Indicator," a powerful tool for traders looking to capitalize on market opportunities using these two proven strategies.
WICK FILLS
First, let's take a closer look at the WickFill method. In financial markets, candlestick charts are a popular way to visualize the price movement of a security, derivative, or currency over a specific time period. Each candlestick on the chart is composed of a real body and shadows, with the top of the upper shadow representing the highest price paid during the time period, and the bottom of the lower shadow representing the lowest price paid.
The WickFill method involves placing market orders at the closed price indicated by the candlestick. This means that if a trader using this method sees a long upper wick on a bullish candlestick chart, they may place a buy market order at the closed price of the candlestick with the take profit target at the candlestick high price (the highest price paid during the time period), in the belief that the price is likely to rise. Similarly, if they see a long lower wick on a bearish candle, they may place a sell market order at the closed price of the candlestick with the take profit target at the candlestick low price (the lowest price paid during the time period), in the belief that the price is likely to fall.
The idea behind the WickFill method is that the wicks of candlestick chart patterns can provide valuable information about the price action of a security and the sentiment of market participants. By placing market orders at the prices indicated by the candlesticks close, traders using this method hope to capitalize on potential price movements and maximize their returns.
The image below highlights two Wick Fill opportunities. A signal will be provided at the candle close that says: 'Sell WF' or 'Buy WF'.
--------------
MOMENTUM SHIFT REVERSAL
Now, let's turn to the Momentum Shift method. As the name suggests, this method involves identifying changes in the momentum of the price of a security. Traders who use this method are looking to capitalize on shifts in the strength or direction of the price momentum.
There are various ways to trade based on momentum shifts. For example, a trader may look for a security whose price is trending strongly in one direction and then look for a momentum shift that signals a change in the trend. They may then enter a trade in the direction of the new trend, hoping to ride the momentum of the price movement. Alternatively, a trader may look for a security whose price is moving in a range and then look for a momentum shift that signals a breakout from the range. They may then enter a trade in the direction of the breakout, hoping to capitalize on the momentum of the price movement.
--------------
WICK REJECTION REVERSALS
A second Momentum Shift method is the concept of wick rejection reversal trading opportunities. This is a powerful technique for traders looking to capitalize on market opportunities.
So, what exactly is a wick rejection reversal opportunity? Essentially, it is a situation in which the price of a security rejects a wick (or shadow or tail) of a candlestick chart pattern and then reverses direction. For example, if the price is trending upwards and then encounters resistance at a certain level, it may create a long upper wick on a candlestick chart. If the price then falls back below the level of resistance and continues trending downwards, this could be considered a wick rejection reversal opportunity.
Traders can use the Indicator and signals provided to identify wick rejection reversal opportunities by defining certain conditions. For example, the code includes conditions for identifying a "sell reversal" based on the presence of a green candle with a long upper wick, and an RSI value above a certain threshold. This type of setup may indicate that the price is rejecting the resistance represented by the long upper wick and is likely to continue trending downwards.
Similarly, the code includes conditions for identifying a "buy reversal" based on the presence of a red candle with a long lower wick, and an RSI value below a certain threshold. This type of setup may indicate that the price is rejecting the support represented by the long lower wick and is likely to continue trending upwards.
Traders can find wick rejection reversal opportunities particularly beneficial for several reasons. First, these opportunities can provide clear entry and exit points for trades, which can help traders manage risk and maximize their returns. By identifying a specific level of resistance or support that has been rejected by the price, traders can have a clear idea of where to place their orders and where to set their stop-losses.
Second, wick rejection reversal opportunities can be a reliable indicator of market sentiment and direction. By considering the wicks of candlestick chart patterns, traders can gain a deeper understanding of the forces at work in the market and how market participants are reacting to them. This can help traders make more informed decisions about when to enter or exit trades.
Finally, wick rejection reversal opportunities can be found in a variety of market conditions and across different financial instruments. Whether the market is trending, range-bound, or volatile, traders can use this indicator provided to identify wick rejection reversal opportunities and capitalize on them.
In conclusion, wick rejection reversal opportunities are a valuable technique for traders looking to capitalize on market opportunities and improve their returns. By using the indicator provided and considering the wicks of candlestick chart patterns, traders can identify clear entry and exit points, understand market sentiment, and trade across different market conditions and instruments.
The image below depicts two sell opportunities, the top left is a Momentum Shift example and the top right is a Wick Rejection example. A signal will be shown on the chart at the candle close that says: 'Sell R' or 'Buy R'.
--------------
CONCLUSION
So why might traders find the WickFill and Momentum Shift methods useful? There are several reasons. First, these methods can help traders identify potential trade opportunities that may not be immediately apparent from a simple analysis of price trends or chart patterns. By considering the wicks and momentum of a security's price movement, traders can gain a more nuanced understanding of the forces at work in the market and make more informed decisions about when to enter or exit trades.
Second, the WickFill and Momentum Shift methods can be used in conjunction with other technical analysis tools and techniques. For example, traders may use moving averages, oscillators, and trendlines to help confirm the presence of a WickFill or Momentum Shift opportunity. This can help traders increase the reliability and profitability of their trades.
Finally, the WickFill and Momentum Shift methods can be applied to a wide range of financial instruments, including stocks, forex, futures, and more. This versatility makes them useful for traders with diverse investment portfolios and strategies.
Overall, the WickFill and Momentum Shift methods are powerful tools for traders looking to capitalize on market opportunities and improve their returns. By considering the wicks and momentum of a security's price movement, traders can find profitable trading opportunities.
------------
FINAL COMMENT
Just like any other indicator or strategy out there, please consider the timeframe and asset that you are using this indicator with. Higher timeframe price action is more reliable than lower timeframe price action. For example, the 4H and Daily timeframes will provide more reliable signals than the 5m timeframe. With regards to assets, the indicator works extremely well with Forex pairs and Commodities, such as Gold.
I hope you enjoy the indicator.
Cosmic Channel LiteCosmic Channel Lite ( CC Lite) draws dynamic non-repainting trendlines and helps
⭐ know when a breakout is about to begin
⭐ predict the position and timing of the next swing reversal
⭐ predict sudden changes in volatility
⭐ recognize whether the price is in bearish or bullish territory
👀 HOW IT WORKS
Cosmic Channel Lite draws a dynamic channel consisting of a support line, basis line and resistance line. These are calculated by applying the Reduced Median Method to groups of moving averages of different type over several periods each, effectively taking 20 data points and reducing them to 3. In between, 6 internal levels are left to give context inside the channel with stable levels, the extremes of which help highlight the SR lines (see chart). The basis line color is determined by its smoothed angle with positive angles in green and negative in purple. The aim of this indicator is to provide a consistent and generic price context that works out-of-the-box and accordingly the settings have been stripped to the bare minimum with no need to continually adjust them.
📗 HOW TO USE IT
The Cosmic Channel Lite plots are meant to be used as a guide for entering and exiting positions and setting stop-loss and take profit levels. The indicator is deemed effective for any particular timeframe as long as the price stays within the maximum bounds of the indicator's plots. For this reason it is recommended to use Cosmic Channel Lite in a multi-chart layout where each chart has a different timeframe. The 5 primary strategies are:
long when the price reverses off of the support line and short when the price reverses off of the resistance line
long when the support line is highlighted and short when the resistance line is highlighted
long when the price breaks above the resistance line and short when the price breaks below the support line
long when the price moves above the basis line after being below it for a prolonged period and visa-versa (short when the price moves below the basis line)
long/short in the direction the price takes after a stable level ends
🔔 SMART ALERTS
Get notified at the most critical times by settings just one alert. Simply select CC Lite and Any alert() function call as the conditions when creating an alert and you will be tipped-off on bar-close as follows:
R─ (resistance line is highlighted)
S─ (support line is highlighted)
For example, an alert such as CC Lite 6h R─ would mean that during the last 6-hour bar the resistance line has been highlighted. The highlight lasts at least 15 bars from the first highlight bar regardless of price action.
Pivot TrendLine with typeIntro
The simplest version of the indicator automatically draws trendLine on your charts, with newest Type syntax.
Type is some thing like type or interface in typescript or Structure in Clang.
with type key word you can write more clear code in pinescript.
Usage
You can change the looking back length settings to get more proper lines you want.
There is also a switch to turn off the historical trendlines .
You can use this to build more advanced indicators or strategies.
Theory Affinity TrendlinesThis indicator is perfect for traders who want to identify trend lines on a chart. It draws higher low uptrends and lower high downtrends, making it easy to see where the trend is going. You can also customize the settings to fit your needs, making it the perfect tool for your trading arsenal.
With this new tool, you can easily customize your experience to get the most out of your trading and analysis. With options like max lines, strength multiplier, pivot plots/text, and more, you can easily create the perfect trading analysis environment.
So why wait? Try it out today!
Leave feedback and let me know what you think.
// ############################################################################################## Input Descriptions
Pivot Left ----------------- look left n bars
Pivot Right ---------------- look right n bars
Strength ------------------- Pivot multiplier (Higher = Wider Trend lines)
Max Lines ------------------ Number of lines for each Uptrend and Downtrend
Structure Text ------------ Show HH, LL, etc. on chart
Structure Markers -------- Dots at the Pivot Highs and Lows
Plots ------------------------ Draw a line at Pivot Highs and Lows
Last Up Width ------------- Width of the current Uptrend line
Historical Up Width ------ Width of previous Uptrend lines
Last Down Width --------- Width of the current Downtrend lines
Historical Down Width --- Width of previous Downtrend lines
Line Offset ---------------- Shift trend lines right or left
* Lines may or may not "repaint". For use to identify trends that are more than likely already established and to identify trend line breaks.

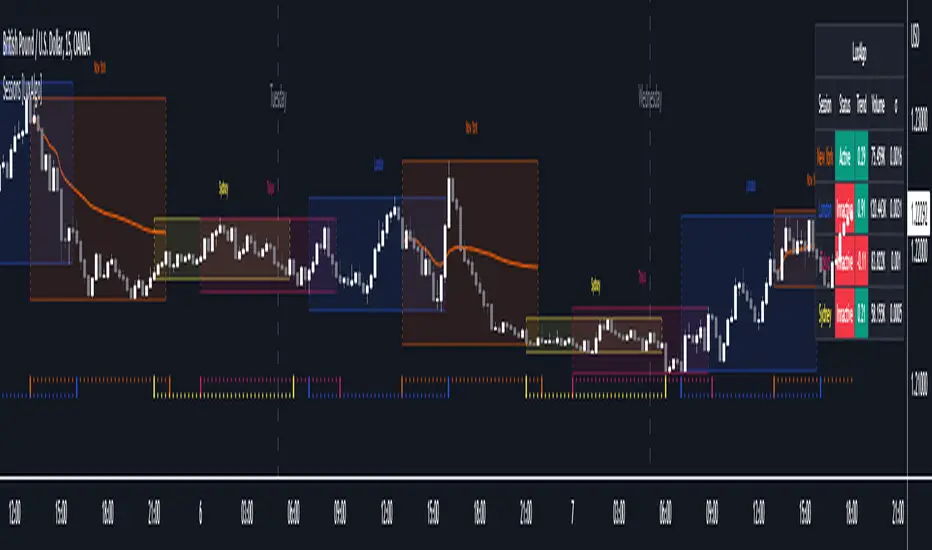
Sessions [LuxAlgo]This indicator shows when user set sessions are active and returns various tools + metrics using the closing price within active sessions as an input. Users have the option to change up to 4 session times.
The indicator will increasingly lack accuracy when the chart timeframe is higher than 1 hour.
Settings
Sessions
Enable Session: Allows to enable or disable all associated elements with a specific user set session.
Session Time: Opening and closing times of the user set session in the hh:mm format.
Range: Highlights the associated session range on the chart.
Trendline: Returns the associated session trendline on the chart.
Mean: Returns the associated session mean average on the chart.
VWAP: Returns the associated session volume weighted average price on the chart.
Ranges Settings
Range Area Transparency: Transparency of the area highlighting sessions ranges.
Range Outline: Highlights the borders of the session range area.
Range Label: Shows the session label at the mid-point of the session interval.
Dashboard
Show Dashboard: Enables sessions dashboard on the chart.
Advanced Dashboard: Returns more information regarding user set sessions on the dashboard.
Dividers
Show Session Divider: Highlights active sessions using intervals on the bottom of the chart (this can lead to less responsive charts)
Show Daily Divider: Highlights days on the chart.
Usage
This tool is versatile and allows the user to perform a wide variety of tasks all focusing on highlighting and analyzing price movements within a specific user set session in a periodic fashion.
Significant forex trading sessions are used by default, but the users are free to choose the opening and closing time of their choices.
Using ranges can indicate which sessions returned the most volatile price movements.
Trendlines can be useful to estimate the underlying trend of a specific session, but they can also offer a quick way to see which session started a trend reversal.
The session Mean highlights the equilibrium level within a session, extrapolating these levels can provide potential support and resistances levels of interest.
Finally, users can use the sessions VWAP's for real time applications, using them as trailing supports and resistances.
Using The Advanced Dashboard
The advanced dashboard returns useful information regarding the user set sessions. Each dashboard elements are described below:
Status: Highlights whether the user set session is active (open) of inactive (closed).
Trend: Shows correlation coefficient between the session prices and a linear sequence of values. Values above 0 indicates an up-trending session, while values under 0 indicates a down-trending session. Values closer to (1, -1) indicates a more trending session.
Volume: Shows accumulated volume within the session
σ (Standard Deviation): Shows standard deviation of the session, while this value is not bounded it can be useful to compare it with the other ones to see which session was the most volatile.
Note that when a session becomes inactive the value on the dashboard will hold until the specific session becomes active again.
Click Draw TrendLine [UhoKang] v2
This is an indicator that directly draws a trend line by clicking on the candle.
Click to Create Trend lines !!
Create a trend line by connecting A, B, and C with three vertices.
1. Draw Bear Trend line
Click pivot high : First pivothigh of the downtrend line
Click pivot low : pivotlow of the downtrend line
Click pivot high : Second pivothigh of the downtrend line
2. Draw Bull Trend line
Click pivot low : First pivotlow of the uptrend line
Click pivot high : pivothigh of the uptrend line
Click pivot low : Second pivotlow of the uptrend line
Modefiy Trendlines
1. Edit Bear Trend line
Drag Red , ,
2. Edit Bull Trend line
Drag Green , ,

Cosmic GravityCosmic Gravity draws dynamic non-repainting trendlines and helps
⭐ know when to scalp
⭐ predict the position and timing of the next major reversal
⭐ predict sudden changes in volatility
⭐ recognize if the trend is bearish or bullish
👀 HOW IT WORKS
Cosmic Gravity draws a dynamic channel consisting of a basis line and several support and resistance levels for low/medium/high volatility situations, as defined by the Inner Channel and 2 Outer Channel plots respectively. The script achieves this by reducing a large number of select moving averages, their multiples, and other trend levels into a single basis line and deriving the remaining plots off of it using ATR and probability-constant multiples. The basis line color is determined by its smoothed vector similar to how our Cosmic Vector indicator paints its plot. The aim of this indicator is to provide a consistent and generic price context that works out-of-the-box; accordingly a single static average period is used throughout and the settings have been stripped to the bare minimum with no need to ever update them.
📗 HOW TO USE IT
Cosmic Gravity's channel levels are meant to be used as a guide for entering and exiting positions and setting stop-loss and take profit levels. The indicator is deemed effective for any particular timeframe as long as the price stays within the maximum bounds of the indicator's plots. For this reason it is recommended to use Cosmic Gravity in a multi-chart layout where each chart has a different timeframe. The 5 primary strategies are:
long when the price reverses off of an Outer Channel support level and short when the price reverses off of an Outer Channel resistance level
long when the price crosses above the basis line after being below it for a prolonged period and vice-versa (short when the price trend moves below the basis line)
long when the basis line color turns blue after being pink for a prolonged period and visa-versa (short when the basis line color turns pink)
long/short in the direction the price takes when it goes outside the Magnetic Gravity channel when this channel is in a tight squeeze
scalp as the price bounces between the Inner Channel levels (do this only while the price is contained inside the Inner Channel )
🔔 SMART ALERTS
Get notified at the most critical times with a single alert. Simply select Cosmic Gravity - Any alert() function call as the condition when creating an alert and you will be tipped-off on bar-close as follows:
RR↘ (price close crossed below Outer Channel R6 plot)
RR↗ (price high crossed above Outer Channel R6 plot)
R└ (price low entered R channel from above)
R┘ (price high exited R channel from above)
R┐ (price high exited R channel from below)
R┌ (price high entered R channel from below)
B↘ (price high crossed below Basis plot)
B↗ (price low crossed above Basis plot)
B╮ ( Basis vector turned negative)
B╯ ( Basis vector turned positive)
S└ (price low entered S channel from above)
S┘ (price low exited S channel from above)
S┐ (price low exited S channel from below)
S┌ (price high entered S channel from below)
SS↘ (price low crossed below Outer Channel S6 plot)
SS↗ (price close crossed above Outer Channel S6 plot)
For example, an alert such as Cosmic Gravity 6H R┐ B↘ means that during the last 6-hour bar the price exited the R channel from below and also crossed below the basis line.
🚩 DISCLAIMER
The information we create and publish here is not prohibited, doesn't constitute investment advice, and isn't created solely for qualified investors.

Converging Pullbacks and PeaksMulti Timeframe Converging Lines Indicator. Using the highest/lowest Values at 2 different lengths. Convergence created by taking the highest/lowest value and subtracting/adding the # of barssince the highest/lowest bar was set multiplied by the price multiplied by the float. Curves are created from averaging out the emas of the center lines of the extremeties.
Helps show trendlines automatically most of the time but can be tweaked by changing the floats or Fast/Slow lengths to you liking.
TradersCustomLibraryLibrary "TradersCustomLibrary"
TODO: add library description here
SelectOptimalTimeframeTrendlineSettings()
calculateShortStopLoss()
calculateLongStopLoss()
werdygerTrend()
trendLines()
stoch()
timeToString()
All-in-One-BTFinancialsI like to share my ALL-IN-ONE script to help you understand trendlines, overbought/sold, unified EMA, Volume trades, Chopiness index and my favourite Fibonacci. It looks a bit messy but you will get used to it.

Kalman Gain Parameter MechanicsFrequently asked question is to explain how Gain parameter works in kalman funtion. This script serves as a visual representation of Gain parameter of Kalman function used in HMA-Kalman & Trendlines script. (The function creator's name was misspeled in that script as Kahlman)
To see better results set your Chart's timeframe to Daily.

double Bollinger BandsThis Bollinger Band indicator is a technical analysis tool defined by a set of trendlines plotted Four standard deviations (two positively and two negatively) away from a simple moving average (SMA) of a security's price, but which can be adjusted to user preference.

Step-MA Filtered Stochastic [Loxx]Step-MA Filtered Stochastic is a stochastic indicator with step moving average filtering. This smooths the signal by filtering out noise.
What is the Stochastic Indicator?
The stochastic oscillator, also known as stochastic indicator, is a popular trading indicator that is useful for predicting trend reversals. It also focuses on price momentum and can be used to identify overbought and oversold levels in shares, indices, currencies and many other investment assets.
The stochastic oscillator measures the momentum of price movements. Momentum is the rate of acceleration in price movement. The idea behind the stochastic indicator is that the momentum of an instrument’s price will often change before the price movement of the instrument actually changes direction. As a result, the indicator can be used to predict trend reversals.
The stochastic indicator can be used by experienced traders and those learning technical analysis. With the help of other technical analysis tools such as moving averages, trendlines and support and resistance levels, the stochastic oscillator can help to improve trading accuracy and identify profitable entry and exit points.
Included:
Bar coloring
3 signal variations w/ alerts
Loxx's Expanded Source Types
