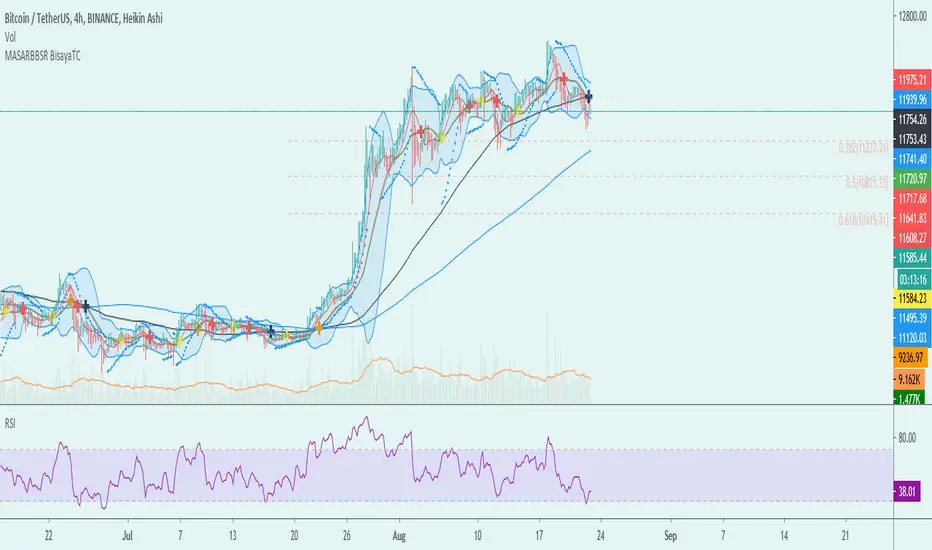
MA-SAR-BB-SR - BisayaTCThe script allows you to use multiple indicators such as Moving Averages, Parabolic SAR, Bollinger Bands, Support and Resistance and it includes alerts for each indicator.
MA - The moving average (MA) is a simple technical analysis tool that smooths out price data by creating a constantly updated average price. The average is taken over a specific period of time, like 10 days, 20 minutes, 30 weeks or any time period the trader chooses.
SAR - The Parabolic SAR is a technical indicator developed by J. Welles Wilder to determine the direction that an asset is moving. The indicator is also referred to as a stop and reverse system, which is abbreviated as SAR. It aims to identify potential reversals in the price movement of traded assets.
BB- Bollinger Bands are envelopes plotted at a standard deviation level above and below a simple moving average of the price. Because the distance of the bands is based on standard deviation, they adjust to volatility swings in the underlying price.
SR - Support and Resistance are certain predetermined levels of the price of a security at which it is thought that the price will tend to stop and reverse. These levels are denoted by multiple touches of price without a breakthrough of the level.
DISCLAIMER: For educational purposes only. Nothing in this content should be interpreted as financial advice or a recommendation to buy or sell any sort of security or investment including all types of crypto. DYOR
Поиск скриптов по запросу "Volatility"
Cumulative distribution function - Probability Cumulative distribution function (tScore and zScore)
This script provides the calculation of the cumulative distribution function (i.e., probability). The measure allows you to calculate the chances of a value of interest being above or below a hypothesized value over the measurement period—nothing fancy here, just good old statistics and mathematics. The closer you are to 0 or 1, the more significant your measurement. We’ve included a significance level highlighting feature. The ability to turn price and/or volume off.
We have included both the Z and T statistics. Where the ‘Z’ is looking at the difference of the current value, minus the mean, and divided by the standard deviation. This is usually pretty noisy on a single value, so a smoother is included. Nice shoutout to the Pinecoders Github Page with this function also. The t-statistic is measuring the difference between a short measurement, an extended measurement, and divided by the standard error (sigma/sqrt(n)). Both of these are neatly wrapped into a function, so please feel free to use them in your code. Add a bit of science to your guessing game. For the purists out there, we have chosen to use sigma in the t-statistic because we know the population's behavior (as opposed to the s-measure). We’ve also included two levels of the t-statistic cumulative distribution function if you are using a short sample period below 6.
Finally, because everyone loves choices, we’ve included the ability to measure the probability of:
the current value (Price and volume)
change
percent change
momentum (change over a period of time)
Acceleration (change of the change)
contribution (amount of the current bar over the sum)
volatility (natural log ratio of today and the previous bar)
Here is a chart example explaining some of the data for the function.
Here are the various options you have the print the different measurements
A comparison of the t-statistic and z-statistic (t-score and z-score)
And the coloring options

VIX3M/1M ratioThis script simply calculates and plots the VIX 3 month versus 1 month ratio. Values below 1 indicate a strong panic situation in the market (1 month volatility is higher than the 3 month volatiliy). This might be a good opportunity to sell options.

[CP]ATR Triple Stop Loss LevelsATR based Triple Stop Loss levels that are plotted on the chart (like moving averages!).
With ATR Levels plotted on the price chart itself, you can better set your volatility based trailing Stop Loss.
Also helps to define the SL when making an entry into a stock.
Note:
This indicator is supposed to be used on Daily and Weekly Charts.
For other timeframes you would need to tweek the default parameters.

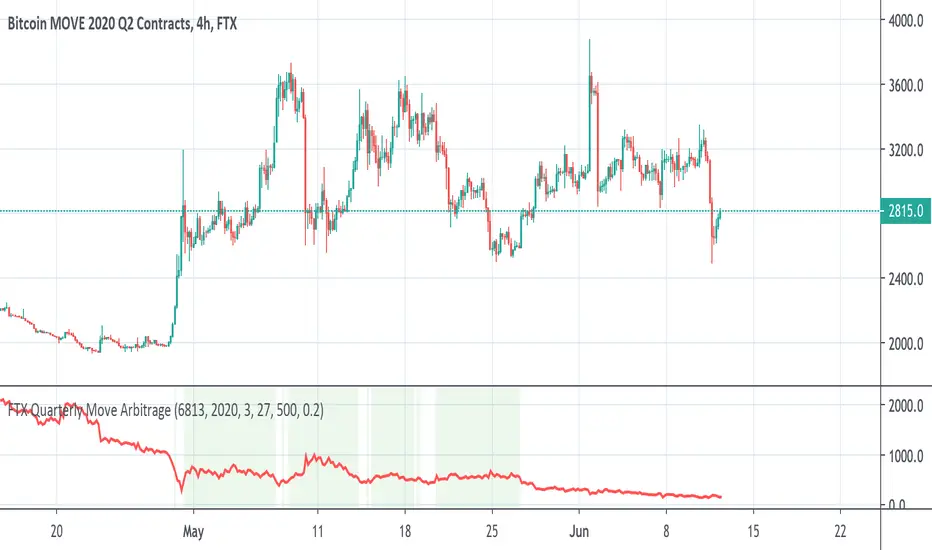
FTX BTC Quarterly Move ArbitrageThis script is for arbitraging BTC's volatility on FTX.
We use 3 factors to detect the best timing for arbitraging:
1. BTC Quarterly Move current price
2. BTC Quarterly Move strike price
3. BTC current price
When green background appears, long BTC and short BTC move.
When red background appears, short BTC and short BTC move.
Ehlers Signal To Noise Ratio [CC]The Signal To Noise Ratio was created by John Ehlers (Rocket Science For Traders pgs 81-82) and this indicator is perfect for all of the scalpers out there! This will let you know when the stock is at a high volatility or not and when to buy or sell. If the indicator crosses over the dotted line then that means the stock is volatile and it is trading flat then it will be below the dotted line. Buy when the indicator line is green and sell when it is red.
This was a custom request so let me know if there are any other scripts you would like me to publish or if you want something custom done!

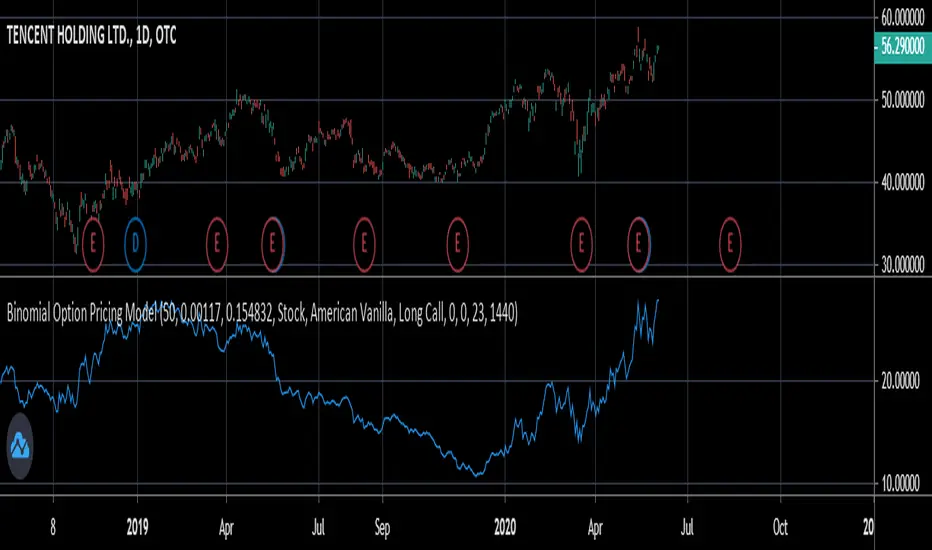
Binomial Option Pricing ModelA binomial option pricing model is an option pricing model that calculates an option's price using binomial trees. The BOPM method of calculating option prices is different from the Black-Scholes Model because it provides more flexibility in the type of options you want to price. The BOPM, unlike the BS model typically used for European style options, allows you to price options which have the ability to exercise early, such as American or Bermudan options. Although you can use the BOPM for any option style.
This specific model allows you to price both American and European vanilla options.
The way the BOPM calculates option prices is by:
First, dividing up the time until expiry into equal parts called steps. This specific model presented only uses 2 steps. For example, say you have an option with an expiry of 60 days, and your binomial tree has only two steps. Then each step will contain 30 days.
Second, the model will project the expected price of the underlying at the end of each step, called a node. The expected price is calculated by using the underlying's volatility and projecting what the price of the underlying would be if it were to rise and fall. This step is repeated until the terminal node, aka the end of the tree, is reached.
Third, once the terminal node's expected underlying prices are calculated, their expected option prices must be calculated.
Finally, after calculating the terminal option prices, backwards induction must be used to calculate the option prices at the previous nodes, until you reach Node 0, aka the current option price.
In order to use this model:
1st. Enter your option's strike price.
2nd. Enter the risk-free-rate of the currency the option is based in.
3rd. Enter the dividend yield of the underlying if it's a stock, or the foreign risk-free-rate if it's an FX option.
*For example, if you were trading an AAPL stock option, in the risk-free-rate box mentioned in step 2, you would enter the US risk-free-rate because AAPL options are traded in US dollars. In the dividend yield box mentioned in step 3, you would enter the stock's dividend yield, which for AAPL is 0.82.
*If you were, for example, trading an option on the EUR/JPY currency pair, the risk-free-rate mentioned in step 2, would be the Japanese risk-free-rate. Then in the the dividend yield box from step 3, you'd input the Eurozone risk-free-rate.
*If you were trading an options on futures contract, the risk-free-rate mentioned in step 2, would be the risk-free-rate for whatever currency the futures contract is denominated in. For example EUR futures are denominated in USD, so you would input the US risk-free-rate. Meanwhile, something like FTSE futures are denominated in GBP, so you would input the British risk-free-rate. As for the dividend yield box mentioned in step 3, for all options on futures, enter 0.
4th. Pick what type of underlying the option is based on: stock, FX, or futures.
5th. Pick the style of option: American or European.
6th. Pick the type of option: Long Call or Long Put.
7th. Input your time until expiry. You can express this in terms of days, hours, and minutes.
8th. Lastly, input your chart time-frame in term of minutes. For example, if you're using the 1 min time-frame enter 1, 4hr time-frame enter 480, daily time-frame enter 1440.
*Disclaimer, because this particular model only uses 2 steps, it won't work on stocks with high prices (over $100). If you want to use this on stocks with prices greater than $100, you would need to add more steps to the code, shown below. The model in its current form should work for stocks below $100.
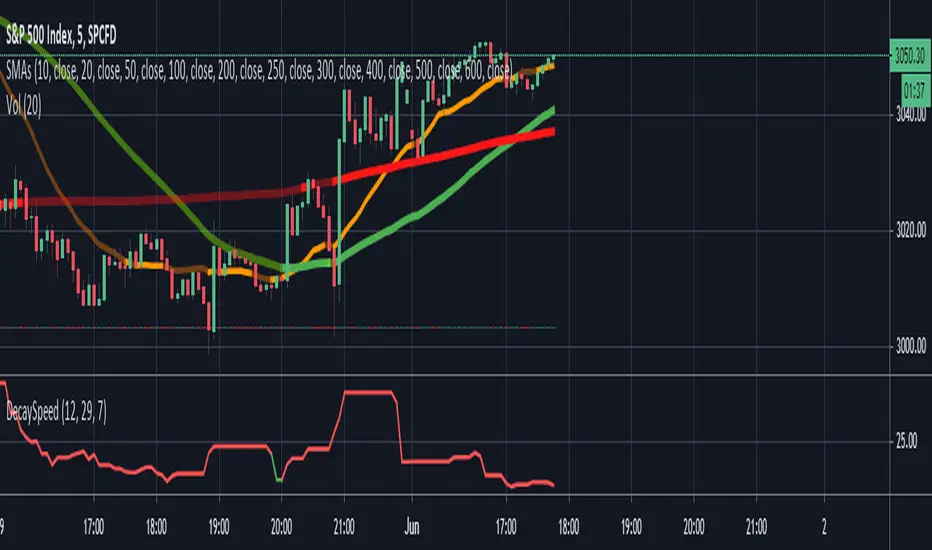
Options Decay Speed for 0DTEUse only for:
SPX, 5 minutes time frame
This indicator is complementing options 0DTE strategy - selling options for SPX index in the same day as they are expiring. Output of the indicator (red or green color of the curve) indicates whether is profitable to sell options at given moment at delta and VIX specified in the parameters. Changing parameter "Candles" is not recommended.
Main thought is that options expire with certain speed (theta decay) when stock doesnt move. When stock moves in unfavorable direction slowly enough, decay speed can compensate for disadvantage coming from option delta. Intuitively there must be certain speed of stock value change (expressed in stock value per 5 minutes) that is exactly compensating theta decay. This indicator calculates those two values (details below) and shows, where theta decay is faster than stock movement in the last hour and thus favorable to sell options.
Indicator gets its result from comparing two values:
1) volatility in the form of highest high and lowest low for past 12 candles (one hour in total) divided by 12 - meaning average movement of stock expressed in
2) speed of options value decay in form of combination of theta decay and option delta. Formulas are approximation of Black-Scholes model as Pine script doesnt allow for advanced functions. Approximations are accurate to 2 decimal points from market open to one hour before market close and will not indicate green when accuracy is not sufficient. Its value is also expressed in so its mutualy comparable.
My focus was not on code elegance but on practical usability.
Written by Ondřej Škop.
Double Vwap - JDThis indicator (The "Volume-Volatility weighted Average Price" or "Double Vwap") gives an alternative to the well known standard VWAP line with some special sauce.
The standard VWAP sometimes lags on big price moves, when there's not much volume "underneath them".
This indicator tries to combat that by adding the option to weigh in large price moves in the calculation, even without large volume,
and can give you faster targets after big "pumps" and "dumps".
Enjoy!
JD.
#nottradingadvice
#DYOR

Moving percentiles channelThis script plots moving percentiles of past price distribution, creating a channel useful for trend and volatility analysis, and for operational purposes also. Percentiles are more robust than common moving averages when it comes to address noise during lateral price movements.
Percentiles included:
- 10th
- 25th (= 1st quartile)
- 50th (= median)
- 75th (= 3rd quartile)
- 90th
You can choose between 2 methods to compute percentiles:
- Linear interpolation
- Nearest rank
(Check pinescript reference manual for more details)
The script also let you plot one Moving average, useful for comparison with the median. Supported MA:
- SMA
- EMA
- WMA
- VWMA
- Hull
- Arnaud Legoux
- Least squares
An example of operational rule could be:
- Buy when observing crossovers between price and 3rd quartile, and viceversa, sell when observing crossunders between price and 1st quartile.
- Close buy positions when observing crossunder between price and median, and viceversa.
However these are only simple example for teaching purpose. I suggest you to create your own strategy.
Hope you enjoy the script. Please support and follow me if you like my work. More content will be added in the future.
@Bezzus

MobilityThe indicator measure realized mobility of the underlying in the terms of V.Kurbakovsky. It is not an exact realization without access to bid and ask prices, but you can choose source prices in the settings window. The indicator can be used to estimate the degree of variation of the underlying price in volatility trading. It is advised to use it on a 1M (1 minute) timeframe. In the calculations the mobility will be normalized to a day. In Minutes in period setting you can specify the number of the estimating periods during MOEX trading session, which is 810 minutes. Thus, mobility is measured in points per day.
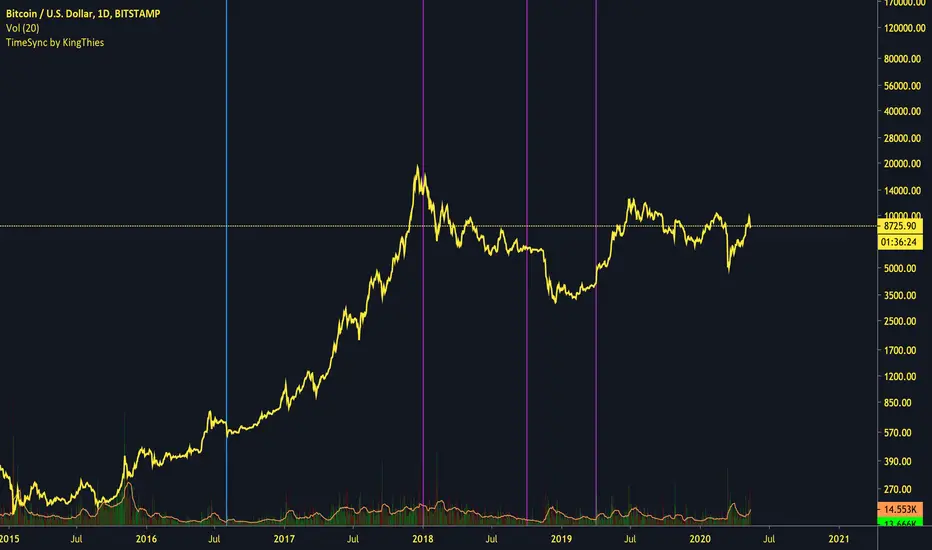
TimeSync by KingThies TimeSync by Kingthies
Written in Pine v4
Applies one function that was published in the Tradingview Pinescript Manual
The Motivation behind this script - Time is 50% of your chart. Many ignore it entirely. This should help give an idea on how to read it and incorporate it in their analysis.
TimeSync by KingThies takes a simple concept and turns it into a visual tracking system of when timeframes of significant impact, all close at the same time.
By utilizing several high time-frames, we see overlaps in periods and more significant events occurring when multiple periods close at once.
The TFs included are 3D,1W,2W and 1M. When users use the timeframes above intraday, the resolution for these HTF's is shown. When using the LTFs, anything lower than 1D/is intraday, the user sees a similar concept but comprised of the 4H, 6H,8H and 10H charts.
Users can adjust the settings to show the HTFs in sync AND also factor in if the event was on a business quarter or new year, which adds more significance to the occurrence.
By seeing when these periods end in sync, we can assume more volatility is present in a given market, presenting various opportunities for traders to take advantage of a given situation.
Apologies in advance for any questions that come up - I will do my best to reply or respond here on Tradingview.com.
Additional Resources for this topic can be found in my account signature, located at the bottom of this post.
Rate Of Change - Weekly SignalsRate of Change - Weekly Signals
This indicator gives a potential "buy signal" using Rate of Change of SPX and VIX together,
using the following criteria:
SPX Weekly ROC(10) has been BELOW -9 and now rises ABOVE -5
*PLUS*
VIX Weekly ROC(10) has been ABOVE +80 and now falls BELOW +10
The background will turn RED when ROC(SPX) is below -9 and ROC(VIX) is above +80.
The background will turn GREEN when ROC(SPX) is above -5 and ROC(VIX) is below +10.
So the potential "buy signal" is when you start to get GREEN BARS AFTER RED - usually with
some white/empty bars in between...but wait for the green. This indicates that the volatility
has settled down, and the market is starting to turn up.
This indicator gives excellent entry points, but be careful of the occasional false signals.
See Nov. 2001 and Nov. 2008, in both cases the market dropped another 25-30% before the final
bottom was formed. Always have an exit strategy, especially when buying in after a downtrend.
How I use this indicator, pretty much as shown in the preview. Weekly SPX as the main chart with
some medium/long moving averages to identify the trend, VIX added as a "Compare Symbol" in red,
and then the Weekly ROC signals below.
For the ROC graphs, you can show SPX+VIX together, SPX alone, or VIX alone. I prefer to display
them separately because they don't scale well together (VIX crowds out the SPX when it spikes).
Background color is still based on both SPX/VIX together, regardless of which graph is shown.
Note that there is no VIX data available on Trading View prior to 1990, so for those dates the
formula is using only ROC(SPX) and the assigned thresholds (-9 and -5, or whatever you choose).

Average Daily Range (ADR) with variable look back periodThis script allows the user to change the look back period with a default of 7 periods. Fixed stops and/or profit targets can lead to risk mismanagement during high or low volatility conditions. For a particular setup, a profit target could be say 15% of the ADR and the stop at 10% of the ADR. ADR is sometimes preferred over ATR (Average True Range) as the former doesn't include gaps

[mya] ATR FilteredATR Filtered for NNFX trading.
A classic Average True Range (ATR) indicator with a simple feature to filter out the spikes.
The ATR value is the tool to determine your TP and SL on daily time-frame, specifically in the NNFX way of trading.
VP mentions in his podcast that when the ATR spikes up you have 2 options: 1. wait 14 candles for the ATR to normalize, 2. use the ATR value prior to the spike.
ATR spikes are easy to spot (thus easy to exclude) for an itraday flash crash.
On the other hand when volatility increases over several candles (as in the Covid-19 shock) it can be difficult to determine which ATR value to base your TP/SL on.
In definition of standard deviation, 95.4% of the value will fall within the 2 sigma bands. Therefore the rest 4.6% can be filtered out as an extreme value (a spike).
The ATR in this indicator will plot the standard ATR value in normal condition, then when the ATR spike happens it will stay at the highest value at the point, when the ATR exceeded its 2 sigma band.
The filtering will reset when the ATR comes back down below the extended highest value.
*Disclaimer: Use at your own risk. I am not a programmer, just another guy trying to beat this game. Let's go get it.

Mean Deviation IndexThe Mean Deviation Index (MDX) is used to see how much price is deviating from the mean. This indicator takes both volatility and mean deviation in consideration.
It uses the standard deviation of the ATR to filter an EMA, and uses this as the mean. It then only plots > or < 0 if price is more than one x ATR away from the mean. If index is positive, the background turns green, meaning price is more than 1 x ATR above the mean. If the index is negative, the background turns red, meaning price is more than 1 x ATR below the mean. This setting can be changed by changing the setting "ATR Multiplier", but the default is 1 x ATR.
There are two main ways to use this index.
1. Use it aggressively to find trends (by combining it with other indicators) by entereding each time the background changes color to green for longs or red for shorts.
2. Use it spot breakouts, waiting for a pullback, and then entering on the next move in the same direction. In this context for a short, you wait for the background color to turn green, then wait for the index to pull back, and then enter once it starts moving up again.

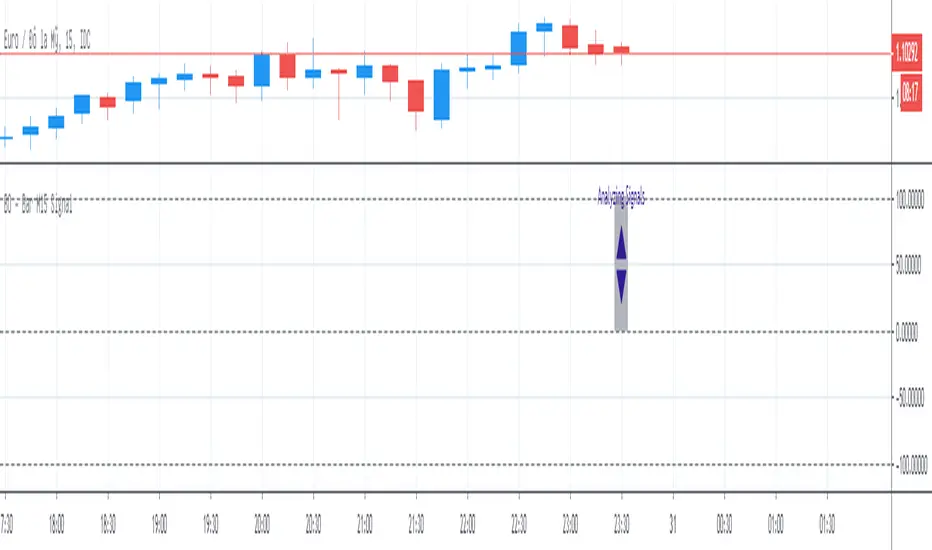
BO - Bar M15 Signal* This script show the signal base on volatility of previous bar M15 to trade Binary Option.
* Rule of Signal is below:
A. Rule 1: Wait for prices created temporary peak and bottom
Row 18: 10 minutes till close
B. Rule 2: Reversal previous bar's direction
1. Put Signal - Row 22 - 25:
- Delay 5' after bar M15 open
- previous bar's direction is upward
- price less than previous close
- temporary bottom greater than previous open
2. Call Signal - Row 29 - 32:
- Delay 5' after bar M15 open
- previous bar's direction is downward
- price greater than previous close
- temporary peak less than previous open
C. Rule 3: Follow previous bar's direction
1. Put Signal - Row 37 - 40:
- Delay 5' after bar M15 open
- previous bar's direction is downward
- price greater than previous open
- temporary peak less than previous peak
2. Call Signal - Row 43 - 46:
- Delay 5' after bar M15 open
- previous bar's direction is upward
- price less than previous open
- temporary bottom greater than previous bottom
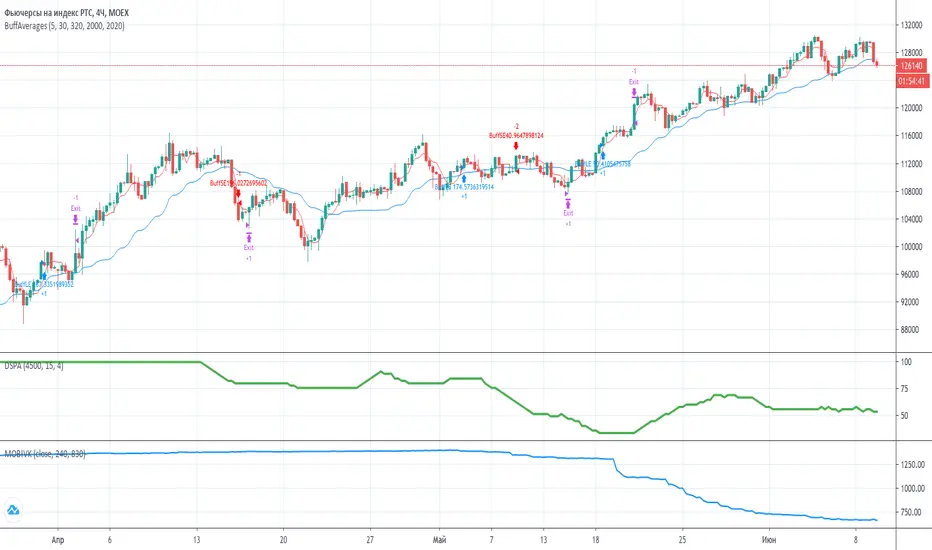
Trend Follower | jhThis is a trend following system that combines 3 indicators which provide different functionalities, also a concept conceived by VP's No Nonsense FX / NNFX method.
1. Baseline
The main baseline filter is an indicator called Modular Filter created by Alex Grover
- www.tradingview.com
- Alex Grover - Modular Filter
-------
That's the moving average like baseline following price, filtering long and short trends and providing entry signals when the price crosses the baseline.
Entry signal indicated with arrows.
2. Volume/Volatility, I will called it Trend Strength
The next indicator is commonly known as ASH, Absolute Strength Histogram.
This indicator was shared by VP as a two line cross trend confirmation indicator, however I discovered an interesting property when I modified the calculation of the histogram.
- Alex Grover Absolute Strength
-------
My modification and other info here
- Absolute Strength Histogram v2
-------
I simplified the display of the trend strength by plotting squares at the bottom of the chart.
- Lighted Squares shows strength
- Dimmed Squares shows weakness
3. Second Confirmation / Exits / Trailing Stop
Finally the last indicator is my usage of QQE (Qualitative Quantitative Estimation), demonstrated in my QQE Trailing Line Indicator
- QQE Trailing Line for Trailing Stop
-------
Three usages of this amazing indicator, serving as :
- Second trend confirmation
- Exit signal when price crosses the trailing line
- Trailing stop when you scaled out the second trade
This indicator is plotted with crosses.
Additional plots and information
Bar Color
- Green for longs, Red for shorts, White when the baseline direction conflicts with the QQE trailing line direction
- When it's white, it's usually ranging and not trending, ASH will also keep you off ranging periods.
-------
ATR Filter
- White circles along the baseline, they will show up if the price has moved more than one ATR from the baseline
- The default allowance is 1 ATR.
-------
The previous and current ATR value
- Label on the right side of the chart showing the previous and current value of ATR
Adding my Didi and ASH indicators up on this screenshot
Didi Index Improved with QQE

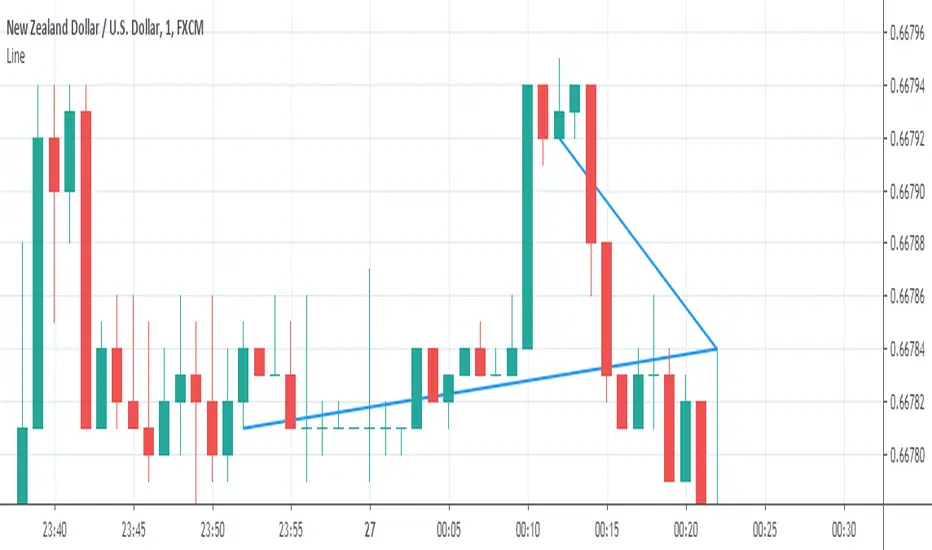
Two Lines Diferent M (derivate)The script is only for information about two lines of diferent derivates, one with 10 candles and the another with 30 candles, the diferent slope of those lines tangents shows an indication of a tendencial if the value of the instrument is bearish or bullish.
Its aplicable to all instruments in high volatility times.
Moving Average Responsive ATRThis is an experimental moving average that gets more sluggish when the volatility increases.
It has two parameters:
- Period, the period for the average true range calculation.
- Responsiveness, higher value more responsive (range: 0.001…1.0)

ACTION Locator v2.0The indicator is based on making the standard deviation (where the mean is a moving average) a two-lines cross indicator, by applying an MA over it. When the standard deviation is above the MA, there is considered to be enough volatility in the market for trends to form.
Blue background = There is ACTION in the market -- signals it should be safe to trade
Gray background = No ACTION - DO NOT TRADE!
Low Pass Channel [DW]This is an experimental study designed to attenuate higher frequency oscillations in price and volatility with minimal lag.
In this study, a single pole low pass filter is used. The low pass filter's cutoff period is determined either by a fixed user input, or by using an Instantaneous Frequency Measurement (IFM) algorithm.
Most radar warning, electronic countermeasures, and electronic intelligence systems employ IFM to identify threats, map the electronic battlefield, and implement deceptive countermeasures.
The IFM technique used for this study was devised by John Ehlers. It calculates In Phase and Quadrature (IQ) components using the Hilbert Transform and uses them to determine the dominant price cycle.
To generate the channel, the same filter approach is applied to true range then added to and subtracted from the price filter.
Custom bar colors are included for simple wave and trend indication.

Developing Range v1.0Developing Range v1.0
----------------------------
Azimuth Dynamics
Scalping tool for help finding potentially high probability reactive levels. I suggest using on a 5min chart.
GRAY BAND: yesterday's High-Low range
BLUE BAND: today's Developing Range. Mean of today's High-Low range so far and yesterday's High-Low range, this is calculated for each of today's bars
THIN BLUE LINE: the mean of today's range median and yesterday's range median.
Note: we do not use the DAILY bar via 'security()' to obtain today's high and low. This would essentially be forward looking, instead we use iteration to check from the current bar back to midnight, bar by bar. This then allows a developing range to be established as the day prints new highs and lows.
Inspired by volatility trading textbook.
