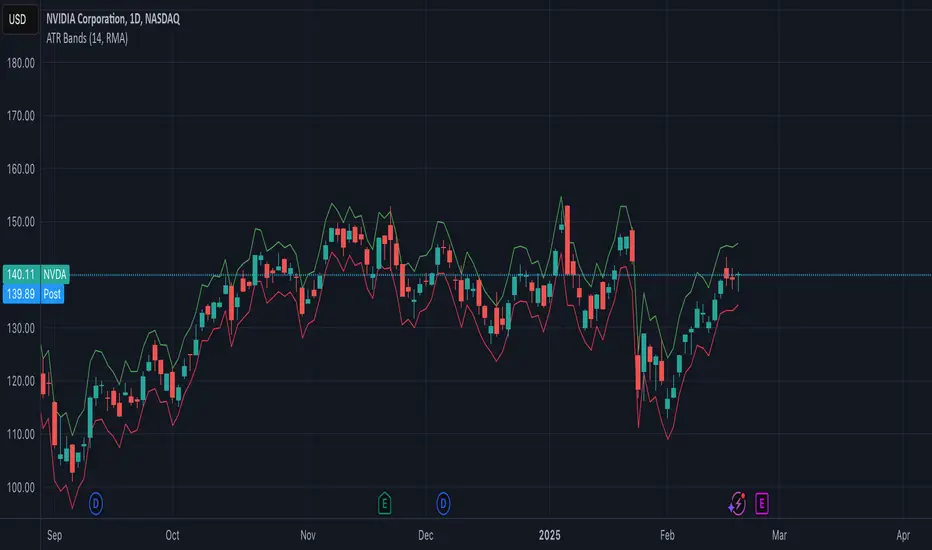
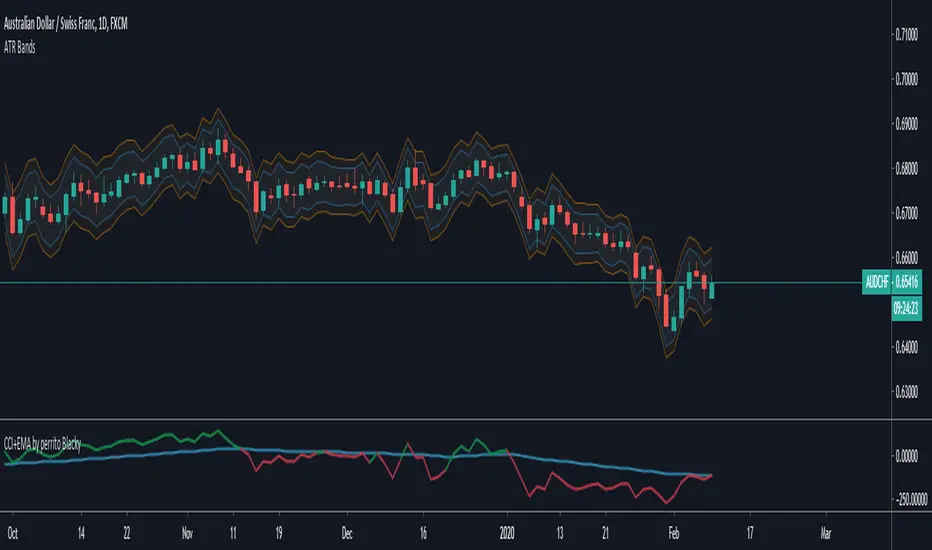
ATR BandsThe ATR Bands indicator is a volatility-based tool that plots dynamic support and resistance levels around the price using the Average True Range (ATR). It consists of two bands:
Upper Band: Calculated as current price + ATR, representing an upper volatility threshold.
Lower Band: Calculated as current price - ATR, serving as a lower volatility threshold.
Key Features:
✅ Measures Volatility: Expands and contracts based on market volatility.
✅ Dynamic Support & Resistance: Helps identify potential breakout or reversal zones.
✅ Customizable Smoothing: Supports multiple moving average methods (RMA, SMA, EMA, WMA) for ATR calculation.
How to Use:
Trend Confirmation: If the price consistently touches or exceeds the upper band, it may indicate strong bullish momentum.
Reversal Signals: A price approaching the lower band may suggest a potential reversal or increased selling pressure.
Volatility Assessment: Wide bands indicate high volatility, while narrow bands suggest consolidation.
This indicator is useful for traders looking to incorporate volatility-based strategies into their trading decisions
Поиск скриптов по запросу "atr"
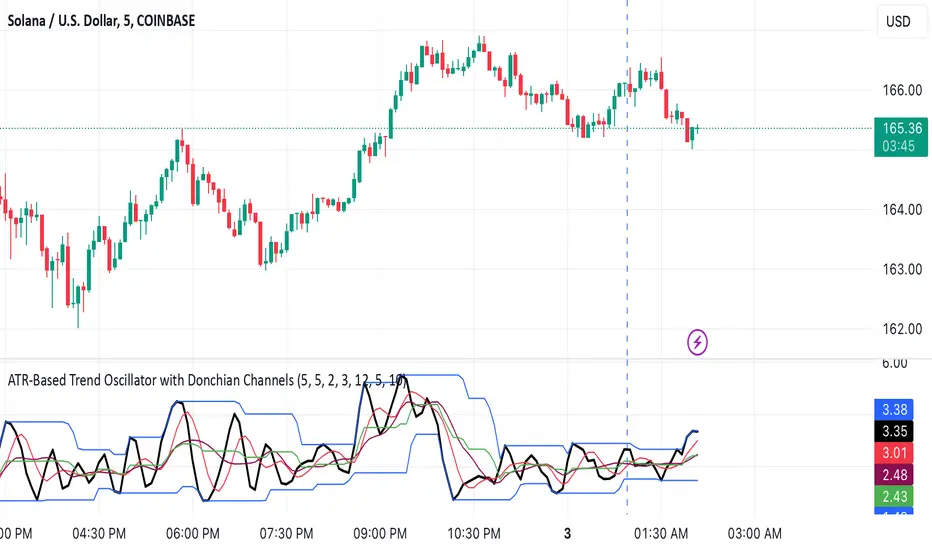
ATR-Based Trend Oscillator with Donchian ChannelsThis script, my Magnum Opus, combines the best elements of trend detection into a powerful ATR-based trend strength oscillator. It has been meticulously engineered to give traders a consistent edge in trend analysis across any asset, including highly volatile markets like crypto and forex. The oscillator normalizes trend strength as a percentage of ATR, smoothing out noise and allowing the oscillator to remain highly responsive while adapting to varying asset volatility.
Key Features:
ATR-Based Oscillator: Measures trend strength in relation to Average True Range, which enhances accuracy and consistency across different assets. By normalizing to ATR, the oscillator produces stable and reliable values that capture shifts in trend momentum effectively.
Dual Moving Averages for Smoothing: This script features two customizable moving averages to help confirm trend direction and strength, making it adaptable for short- and long-term analysis alike.
Donchian Channels for Strength Bounds: A Donchian Channel over the smoothed trend strength oscillator visually bounds strength levels, enabling traders to spot breakout points or reversals quickly.
Ideal for Multi-Asset Trading: The versatility of this indicator makes it a perfect choice across various asset classes, from stocks to forex and cryptocurrencies, maintaining consistency in signals and reliability.
Suggested Pairing: Use this oscillator alongside a directional indicator, such as the Vortex Indicator, to confirm trend direction. This pairing allows traders to understand not only the strength but also the direction of the trend for optimized entry and exit points.
Why This Indicator Will Elevate Your Trading: This trend strength oscillator has been refined to provide clarity and edge for any trader. By incorporating ATR-based normalization, it maintains accuracy in volatile and steady markets alike. The Donchian Channels add structure to trend strength, giving clear overbought and oversold signals, while the two moving averages ensure that lag is minimized without sacrificing accuracy.
Whether you're scalping or trend-trading, this oscillator will enhance your ability to detect and interpret trend strength, making it an essential tool in any trading arsenal.
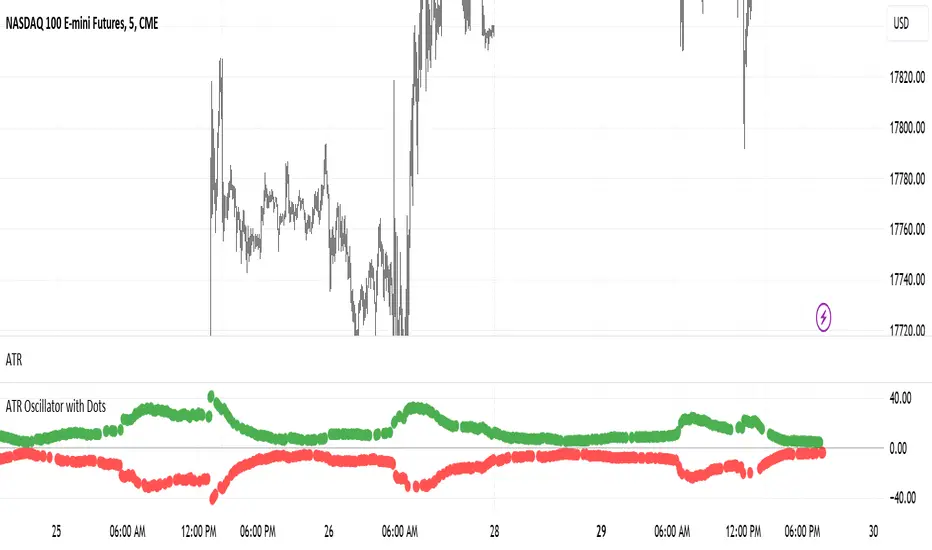
ATR Oscillator with DotsThe ATR Oscillator with Dots utilizes the Average True Range (ATR), a traditional measure that captures the extent of an asset's price movements within a given timeframe. Rather than depicting these values in a continuous line, the ATR Oscillator represents them as discrete dots, colored according to the price movement direction: green for upward movements when the current close is higher than the previous, and red for downward movements when the current close is lower.
In terms of functionality, the key feature of this oscillator is how it visualizes volatility through the spacing of the dots. During periods of high market volatility, the shifts between red and green dots tend to occur more frequently and with greater disparity in their positioning along the oscillator’s axis. This indicates sharp price changes and high trading activity. Conversely, periods of market consolidation are characterized by fewer color changes and a more clustered arrangement of dots, reflecting less price movement and lower volatility.
Traders can leverage the insights from the ATR Oscillator with Dots to better understand the market's behavior. For instance, a tight clustering of dots around the zero line suggests a consolidation phase, where the price is relatively stable and may be preparing for a breakout. On the other hand, widely spaced dots alternating between red and green signify strong price movements, offering opportunities for traders to capitalize on trends or prepare for potential reversals.
Imagine a scenario where a trader is monitoring a currency pair in a fluctuating forex market. An observed increase in the frequency and gap of alternating red and green dots would suggest a rise in volatility, possibly triggered by economic news or events. This could be an optimal time for the trader to seek entry or exit points, aligning their strategy with the increased activity. Conversely, a reduction in the frequency and gap of dot changes could signal an impending consolidation phase, prompting the trader to adopt a more cautious approach or explore range-bound trading strategies.
Therefore, the ATR Oscillator with Dots not only simplifies the interpretation of volatility and price momentum through visual cues but also enriches the trader’s strategy by highlighting periods of high activity and consolidation. This tool can be crucial for making informed decisions, particularly in fast-moving or uncertain market conditions, and can be effectively paired with other indicators to confirm trends and refine trading tactics.
Relative ATRATR is one of the main indicators we use to measure volatility. When the market starts to consolidate or does not rise, ATR will be at a relatively low position.
However, the classic ATR formula does not consider that when the price changes at a logarithmic level, the ATR value will also change significantly. Therefore, I divide the calculated ATR value by the closing price to get an amplitude ratio index.
The adjusted indicator can well reflect the level of volatility. For example, the volatility of BTC reached an unprecedented low in January this year, which means that there will be a significant outbreak after breaking through the consolidation range. The configuration of the breakthrough order will be an excellent choice.

ATR Trailing Stop v5 One of my favorite stops is the ATR Trailing Stop-loss. With the implementation of PineScript v5, a code update was needed in order to use this stop/exit-strategy with newer strategy scripts. A timeframe selector that was not featured on earlier versions is also included. This new version can be plugged into PineScript v5 strategies, and also has a simpler/cleaner code that makes the code logic easier to follow than prior versions.
For those that are unfamiliar with the ATR Trailing Stop exit strategy; it is a trailing stop that takes into account the volatility of the underlying asset by trailing the price series using a multiple of the Average True Range (ATR). In practice I’ve found that this exit can be more effective than traditional trailing stops, depending on the volatility of the asset you are trading. More detailed information can be found at www.stockopedia.com
How do I use it? Add it to your chart as an indicator to visualize where the ATR stop would be with your settings. Or, copy and add it to your v5 strategy with the addition of a ta.crossunder(close, ATRTrailingStop) or ta.crossover(close, ATRTrailingStop) function. Special thanks and credit to HPotter who coded an earlier version of this in pine!

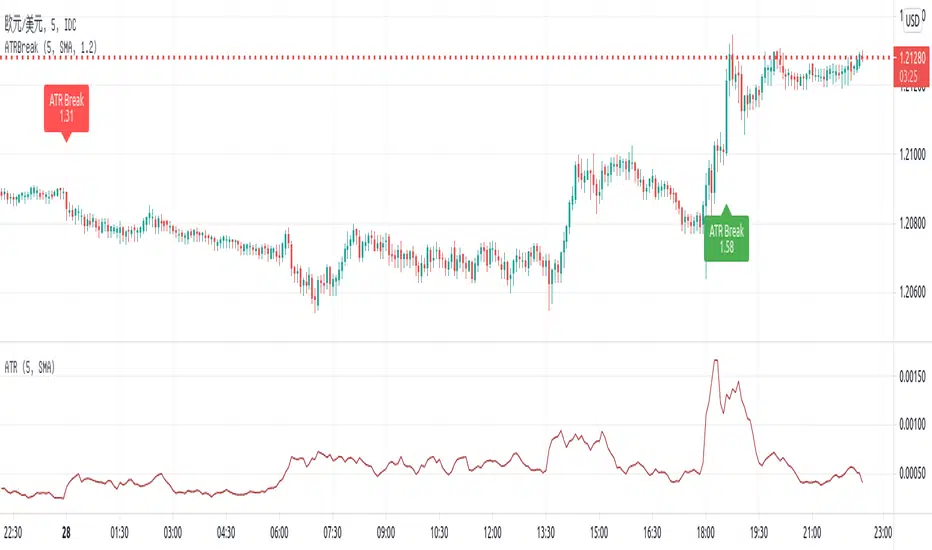
ATR Break on chartThis script is putting one of my old trading method, ATR Break, on chart.
It used to win many times in Dukascopy strategy contest a few years ago.
Pine script is quite easy to learn and very powerful. So I coded it to have a quick view for ATR break on chart.
The rule is simple:
- Current close - open / Previous ATR(5) > alertlevel (1.2), long signal
- Current open - close / Previous ATR(5) > alertlevel (1.2), short signal
The script will display label on the chart with the value of abs(close - open) / Previous ATR(5) to feel the strength.
I used to use the method on 5-min even 1-min chart. SL for 200 points and TP for 5-10 points
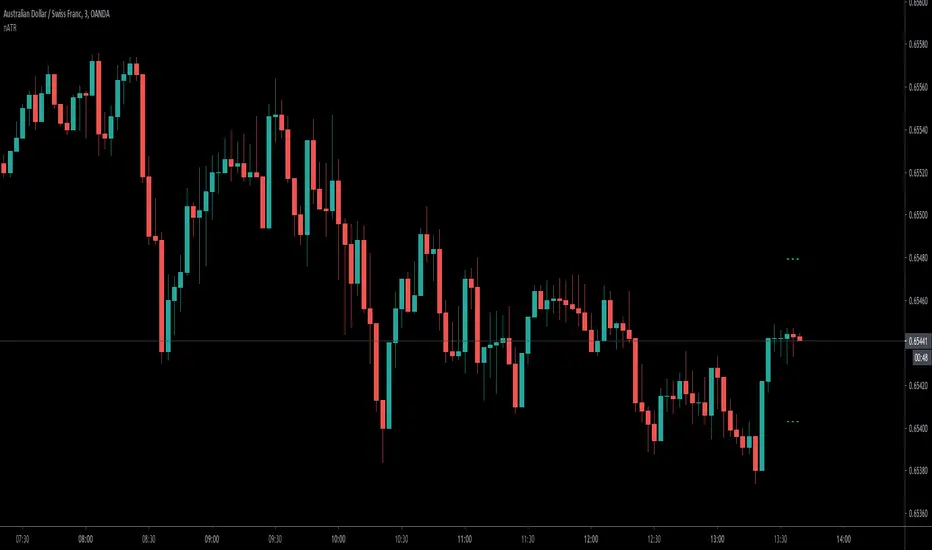
ATR draw on the candle easily setup SL&TPHi,Guys,
Build-in ATR need to read the pips then add on current price to setup safe SL.
But under stress of trading, calculation is not effective.
Input:
Length:Length of ATR
n:n*ATR=Risk
m:m*Risk=TP
the dash line means current price plus n*ATR and minus n*ATR for setup sell or buy stop loss.
If increase m more than 1,you can see the additional line outside the original line in order to setup TP with Reward:Risk more than 1.
Hope you guys enjoy it, and welcome to comment.
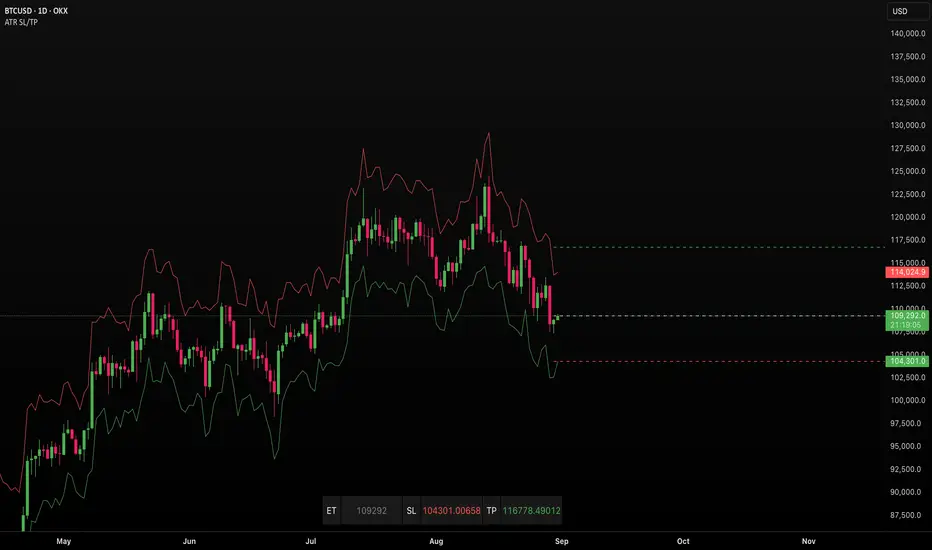
ATR SL/TPStop Loss Finder ATR
A Stop Loss Finder ATR indicator is a dynamic risk management tool leveraging the Average True Range (ATR) to identify and track optimal stop-loss levels based on current market volatility.
A stop hunt indicator is a technical tool designed to identify potential instances where large market participants, often referred to as "smart money," deliberately move the price to trigger a large number of stop-loss orders, creating a temporary price distortion before reversing the trend. These indicators aim to help traders detect these events to either avoid being stopped out or to enter trades in the direction of the anticipated reversal.
For example, a long wick below support with high volume may signal a bullish stop-hunt , indicating that the price has been driven down to trigger sell-stop orders before reversing upward. Conversely, a long wick above resistance with high volume may signal a bearish stop-hunt , suggesting the price was pushed up to trigger buy-stop orders before reversing downward. The presence of such wicks is often associated with candlestick patterns like hammers or shooting stars.
Unlike fixed stop-losses, this indicator adapts its distance from the current price using a customizable ATR multiplier, ensuring that stop-loss levels are neither too tight (prone to being triggered by normal market noise) nor too wide (exposing capital to excessive risk) . The core function calculates the true range—considering the current high-low range, gaps up, and gaps down—over a user-defined period (typically 14 bars), then applies a multiplier to generate a volatility-adjusted stop-loss distance . This approach allows the indicator to dynamically widen stops during high-volatility periods and tighten them during calm markets, providing a more responsive and context-aware exit strategy.
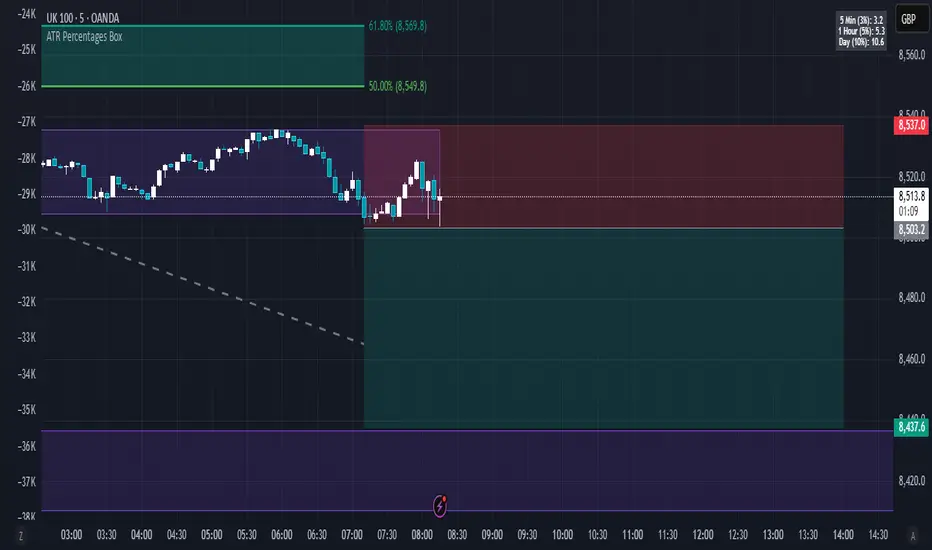
ATR Percentages BoxThis custom indicator provides a quick visual reference for volatility-based price ranges, directly on your TradingView charts. It calculates and displays three ranges derived from the Daily Average True Range (ATR) with a standard 14-period setting:
5 Min (3% ATR): Ideal for very short-term scalping and quick intraday moves.
1 Hour (5% ATR): Useful for hourly setups, short-term trades, and intraday volatility assessment.
Day (10% ATR): Perfect for daily volatility context, swing trades, or placing stops and targets.
The ranges are clearly shown in a compact box at the top-right corner, providing traders immediate insights into realistic price movements, helping to optimise entries, stops, and profit targets efficiently.
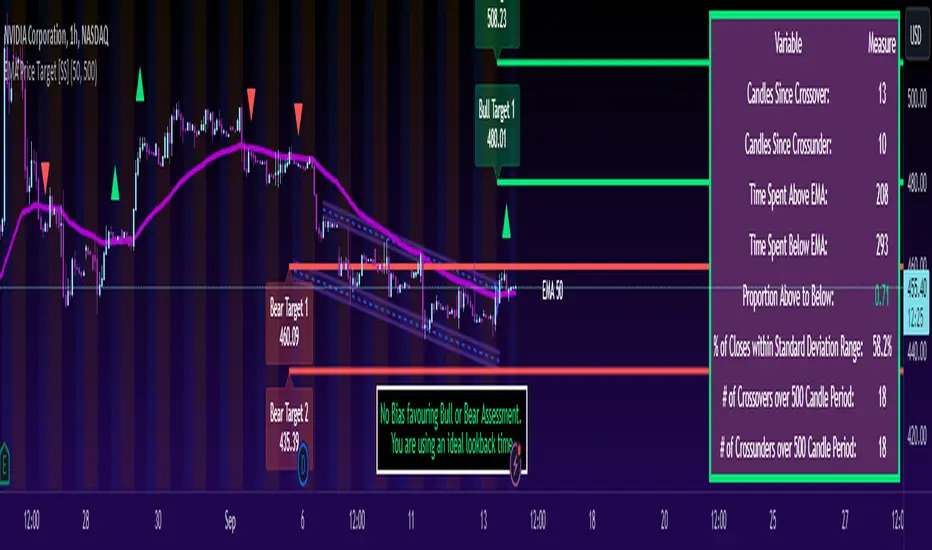
ATR Based EMA Price Targets [SS]As requested...
This is a spinoff of my EMA 9/21 cross indicator with price targets.
A few of you asked for a simple EMA crossover version and that is what this is.
I have, of course, added a bit of extra functionality to it, assuming you would want to transition from another EMA indicator to this one, I tried to leave it somewhat customizable so you can get the same type of functionality as any other EMA based indicator just with the added advantage of having an ATR based assessment added on. So lets get into the details:
What it does:
Same as my EMA 9/21, simply performs a basic ATR range analysis on a ticker, calculating the average move it does on a bullish or bearish cross.
How to use it:
So there are quite a few functions of this indicator. I am going to break them down one by one, from most basic to the more complex.
Plot functions:
EMA is Customizable: The EMA is customizable. If you want the 200, 100, 50, 31, 9, whatever you want, you just have to add the desired EMA timeframe in the settings menu.
Standard Deviation Bands are an option: If you like to have standard deviation bands added to your EMA's, you can select to show the standard deviation band. It will plot the standard deviation for the desired EMA timeframe (so if it is the EMA 200, it will plot the Standard Deviation on the EMA 200).
Plotting Crossovers: You can have the indicator plot green arrows for bullish crosses and red arrows for bearish crosses. I have smoothed out this function slightly by only having it signal a crossover when it breaks and holds. I pulled this over to the alert condition functions as well, so you are not constantly being alerted when it is bouncing over and below an EMA. Only once it chooses a direction, holds and moves up or down, will it alert to a true crossover.
Plotting labels: The indicator will default to plotting the price target labels and the EMA label. You can toggle these on and off in the EMA settings menu.
Trend Assessment Settings:
In addition to plotting the EMA itself and signaling the ATR ranges, the EMA will provide you will demographic information about the trend and price action behaviour around the EMA. You can see an example in the image below:
This will provide you with a breakdown of the statistics on the EMA over the designated lookback period, such as the number of crosses, the time above and below the EMA and the amount the EMA has remained within its standard deviation bands.
Where this is important is the proportion assessment. And what the proportion assessment is doing is its measuring the amount of time the ticker is spending either above or below the EMA.
Ideally, you should have relatively equal and uniform durations above and below. This would be a proportion of between 0.5 and 1.5 Above to Below. Now, you don't have to remember this because you can ask the indicator to do the assessment for you. It will be displayed at the bottom of your chart in a table that you can toggle on and off:
Example of a Uniform Assessment:
Example of a biased assessment:
Keep in mind, if you are using those very laggy EMAs (like the 50, 200, 100 etc.) on the daily timeframe, you aren't going to get uniformity in the data. This is because, stocks are technically already biased to the upside over time. Thus, when you are looking at the big picture, the bull bias thesis of the stock market is in play.
But for the smaller and moderate timeframes, owning to the randomness of price action, you can generally get uniformity in data representation by simply adjusting your lookback period.
To adjust your lookback period, you simply need to change the timeframe for the ATR lookback length. I suggest no less than 500 and probably no more than 1,500 candles, and work within this range. But you can use what the indicator indicates is appropriate.
Of course, all of these charts can be turned off and you are left with a clean looking EMA indicator:
And an example with the standard deviation bands toggled on:
And that, my friends, is the indicator.
Hopefully this is what you wanted, let me know if you have any suggestions.
Enjoy and safe trades!
ATR Stop Loss v4This indicator plots the current ATR value, and the Long and Short stop losses. Watch the indicator and move your stop loss to the Long or Short as necessary.
Unlike other ATR indicators this one allows the user to customize the table placement of the ATR calculations, and the colors of each row on the table, and the text. The ATR factors can also be edited.

ATR VisualizerAdvance Your Market Analysis with the True Range Indicator
The True Range Indicator is a sophisticated screener meticulously developed to bolster your trading execution by presenting an exceptional understanding of the market direction. The centerpiece of this instrument is a distinctive candle configuration depicting the Average True Range (ATR) and the Bear/Bull range. However, it traverses beyond the conventional channels to offer specific market settings to boost your trading decisions.
User-Defined Settings
Broadly, the indicator offers five dynamic settings:
Bear/Bull Range
The Bear/Bull Range outlines the ATR for each candle type - bearish and bullish - and then smartly opts for the pertinent one based on the prevalent market circumstances. This feature aids in comparing the range of bullish and bearish candlesticks, which deepens your understanding of the price action and volatility.
Bearish Range
The Bearish Range isolates and computes the ATR for bearish candles solely. Utilizing this option spots the bear-dominated periods and provides insights about potential market reversals or downward continuations.
Bullish Range
Opposite to the Bearish Range, the Bullish Range setting tabulates the ATR exclusively for bullish candles. It assists in tracking the periods when bulls control, enlightening traders about the possibility of upward continuations or trend reversals.
Average Range
The Average Range provides an unbiased measure of range without prioritizing either bull or bear trends. This model is ideal for traders looking for a holistic interpretation of market behavior, regardless of direction.
Cumulative Average Range
Equally significant is the Cumulative Average Range which calculates the aggregate moving average of the true ranges for an expressed period. This setting is extremely valuable when evaluating the long-term volatility and spotting potential breakouts.
Dual Candle Configuration
Going a step ahead, the True Range Indicator uniquely offers the possibility to incorporate more than one candle estimate on your screen. This ensures simultaneous analysis of multiple market dynamics, thereby enhancing your trading precision multifold.
Concluding Thoughts
In essence, the True Range Indicator is an indispensable companion for traders looking to not only leverage market volatility but also make educated predictions. Equipped with an array of insightful market settings and the ability to display dual candle estimates on-screen, you can customize the functionality to suit your unique trading style and magnify your market performance dramatically.

ATR Mean Reversion Strategy V1**Long Only Strategy**
When Price drops below the ATR band below it will enter a buy on the next candle open
SL at current price minus ATR* ATR multiplier
TP at Mean EMA or if higher than Mean EMA and current candle low is below previous candle low or if price is above ATR
NB: I would highly recommend a low fee broker (I use ICmarkets raw spread account) due to the fact that this is a decently high frequency trading strategy you will rack up a lot of commission, if you use and exchange like Bybit or Binance the strategy will not be profitable due to the high commissions.

ATR Trend Bands [Misu]█ This indicator shows an upper and lower band based on price action and ATR (Average True Range)
The average true range (ATR) is a market volatility indicator used in technical analysis.
█ Usages:
The purpose of this indicator is to identify changes in trends and price action.
It is mainly used to identify breaking points and trend reversals.
But it can also be used to show resistance or support levels.
█ Features:
> Buy & Sell Alerts
> Buy & Sell Labels
> Color Bars
> Show Bands
█ Parameters:
Length: Length is used to calculate ATR.
Atr Multiplier: A factor used to balance the impact of the ATR on the Trend Bands calculation.

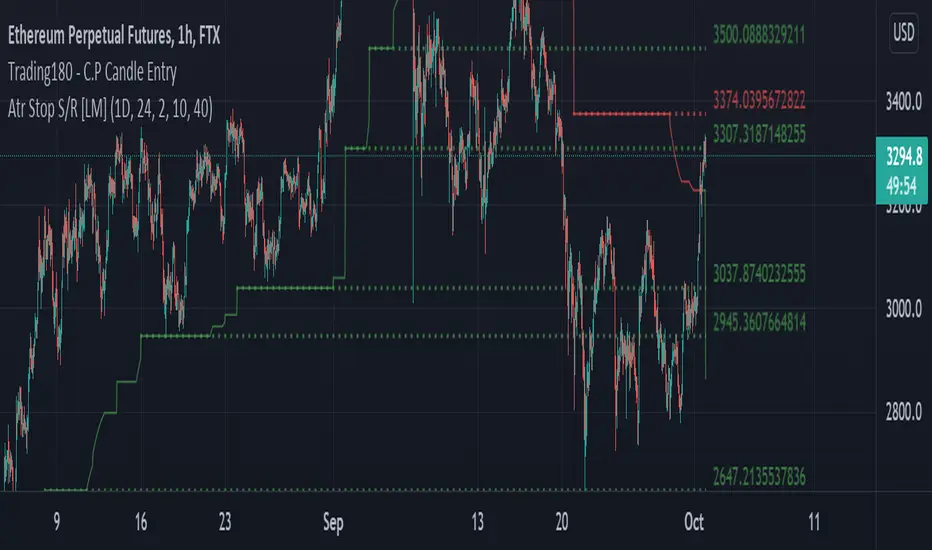
ATR Trailing Stops S/R [LM]Hello Traders,
I would like to introduce you ATR Trailing Stops S/R . The idea is to look for important levels that are identified by trailing stop line, where it usualy spents a lot of time without any move usualy turns out to be good level for bounces.
Script for atr trailing line is originaly taken from: script made by @dgmoon
It has various setting
Timeframe and atr settings
Show lines
Extend lines
Line count - how many lines will be rendered
Candle count - how many candles has to trailing line spend at the same level
Colors - controls color of plot and lines
I hope you will enjoy it, as I enjoyed to write it.
Lukas
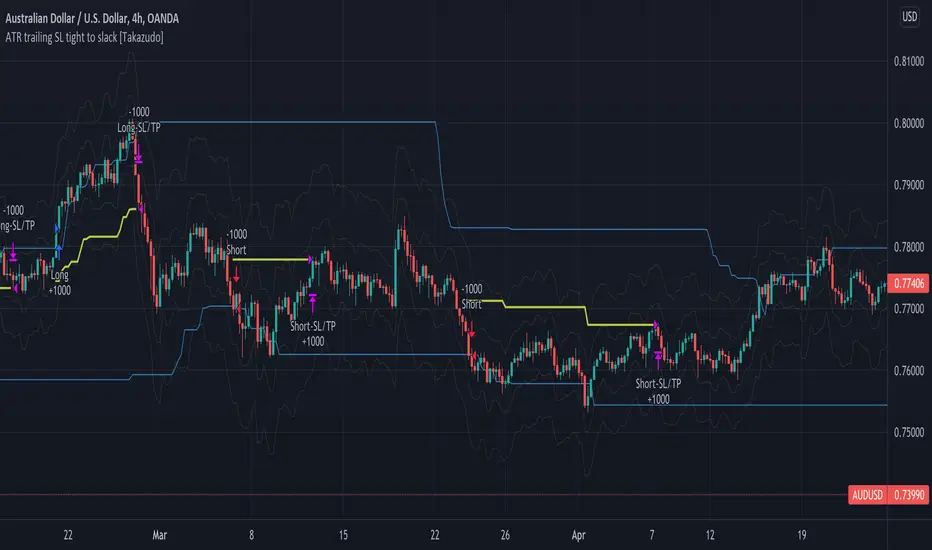
ATR trailing Stop Loss tight to slack [Takazudo]This is a demo of ATR based trailing Stop Loss.
This SL strategy uses 2 types of ATR based SL.
tight SL as initial (ATR * 1.5)
slack SL as trailing (ATR * 4)
When any entry singal occurs by the buy/sell conditions, this SL strategy uses the "tight SL" as the initial SL.
Then the SL will chase the price as trailing SL. However, this strategy uses the "slack SL" in this trailing phase.
So you can set the tight SL first.
Then SL will chase the price as the slack one.
Note: The entry strategy in this script is not intented to win. Check the result. Be careful. Just a module of my strategy.
ATR - ATR from Low, ATR from High LabelsChecks what the average true range is for the X amount of trading days. Then will also label the ATR from the low, and the ATR from the high of the current day.
A second label can be created dependent on current days RVOL %. If RVOL is not 0 or 1, then it will create the second label. Otherwise it will just leave it as the standard label.
The calculation for second label is RVOL * ATR.

ATR Percentage of PriceThis indicator takes the standard ATR and expresses it as a percentage of the OHLC4 price. This has the advantage of normalising the ATR value across the history of an asset. For example, an ATR of value 20 when the price is 2000 actually has a very different meaning when the price rises to 4000. The ATR may be the same value but actually the volatility it represents has halved.
I also add an SMA to the value and a histogram which shows the difference between the two. Positive values mean that volatility is expanding while negative values mean volatility is contracting.
ATR BandsThe NNFX way
This indicator makes it easy to see the ATR values of the chart.
The red lines are at 1.5 ATR
The blue lines are at 1 ATR
Credits to www.tradingview.com for the code he published. I've extracted only the ATR to create this indicator. Many thanks ❤
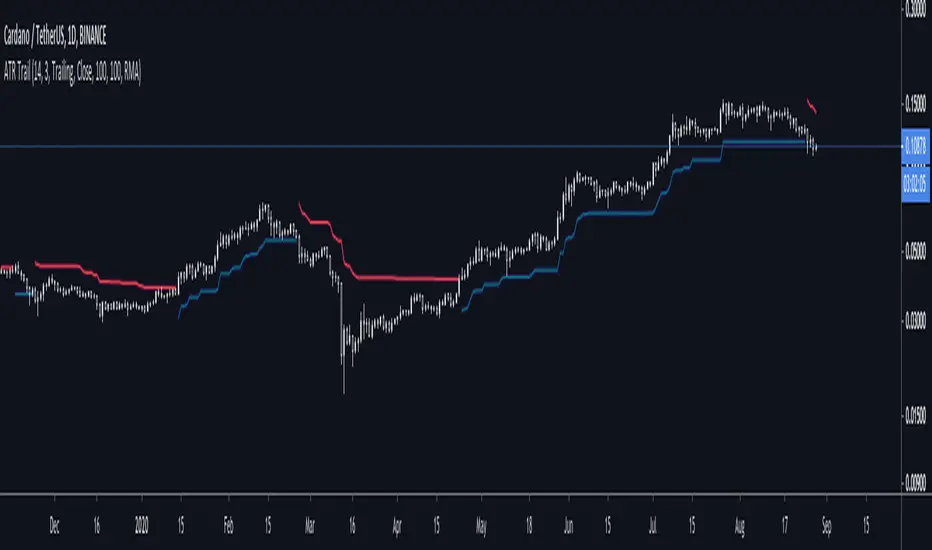
ATR + Trailing StopsSimple visualisation of Average True Range in Pinescript V4.
The script has two modes: Running and Trailing.
In Running mode, it continuously displays the ATR above and below the price. Specifically, it displays the High and Low price plus and minus the ATR times a user-supplied multiplier. This can be helpful for visualising volatility.
In Trailing mode, it displays the same ATR line, except the line trails until price crosses it. When price crosses it, it flips from long to short or vice-versa.
You could use trailing ATR as a stop loss. Adjust the multiplier and lookback period for your asset and preference.
ATR Squeeze Identifier + Last-Bar TR Stops1) Paints two lines based on previous bar's true range, has option for custom multiplier to make stop a factor of previous bar's TR. Used for quick identification of stop loss placement based on previous bar set-ups.
2) Identifies bar on close which has true range that is smaller than a period-chosen ATR criteria. Additionally, has an input for a raw "ATR Shave" which is used to narrow down bars with even smaller true range. Mostly used to identify potential entry zones where market is being squeezed, and expansion is likely to follow. Plots a character under the bar.
3) Identifies a close which includes and follows 5 consecutive closes which all exhibit smaller than average ATR. Includes customize-able ATR length and "ATR Shave" to narrow down tighter range's. Paints circle at bottom of chart. Mostly used to identify when market has been 'quiet' for some time and entries should be considered for likely expansion.

Daily ATR SL/TP Labels on ChartATR-Based Stop Loss & Take Profit Calculator
This script calculates 20% of the Average True Range (ATR) to determine optimal Stop Loss and Take Profit levels. Designed to assist traders in setting precise risk parameters when placing Buy/Sell orders based on daily market volatility.
Key Features:
Computes 20% of ATR value for proportional risk management
Provides dynamic SL/TP levels aligned to current market conditions
Optimised for Daily timeframe analysis to capture full trading day range
Recommended Usage:
Apply on Daily (1D) timeframe for most accurate results, as this captures the complete intraday price movement and provides reliable volatility measurements for position sizing and risk management decisions.

ATR Gauge - Audiophile StyleThe ATR Gauge - Audiophile Style indicator is a custom visualization tool. It's designed to give you a quick, retro-inspired snapshot of market volatility using the Average True Range (ATR) metric. Think of it as a dashboard widget styled like the VU meters on old-school audiophile equipment (e.g., vintage stereo amps from brands like McIntosh or Marantz)—simple, elegant, and functional. It sits in one of the corners of your chart and helps you gauge how "hot" or "cool" the current price action is compared to recent levels.
Why This Gauge?: Standard ATR plots as a line on your chart, but this turns it into a visual "meter" focused on the last 24 hours. It's like a speedometer for volatility—quick to read at a glance. Useful for day traders, scalpers, or anyone monitoring intraday risk without cluttering the main chart.
