Strategy - Plus / Connectable [Azullian]Discover the advanced capabilities of Strategy Plus, an essential component of the connectable indicator system designed for fast-paced strategy testing, visualization, and building within TradingView. This enhanced version of our foundational connectable strategy indicator seamlessly integrates with all connectable indicators . By utilizing the TradingView input source as a signal connector , it facilitates the linking of indicators to form a cohesive strategy. Each connectable indicator within the system sends signal weight to the next node, culminating in a comprehensive strategy that incorporates advanced customization options, sophisticated signal interpretation, and elaborate backtest labeling. Strategy Plus stands out by offering improved position management and extensive alert messaging capabilities, ensuring effective strategy refinement and backend integration.
█ DISTINCTIVE FEATURES
The Connectable Strategy Plus enhances risk mitigation within the connectable system through its advanced features and capabilities:
• Refined Signal Input Management: Tailor and precisely connect up to two signal filters with enhanced input flexibility, gain control, and strategic direction settings.
• Strategic Position Investment Control: Optimize positioning with versatile investment bases, custom investment percentages, and direction-specific investments for effective risk management.
• Advanced Exit Stop Loss Configuration: Implement custom stop loss tactics with diverse base modes and trailing options for tailored risk management.
• Strategic Exit Take Profit Settings: Apply precision-driven take profit strategies with various calculation modes and dynamic trailing functionality.
• Calibrated Entry Position Allocation: Optimize investment distribution for entry positions, including DCA and BRO trades, for strategic market response.
• Refined Order Setting Customization: Ensure exchange compliance with adjustable order settings, enhancing backtest accuracy and strategy reliability.
• Comprehensive Condition Settings: Define precise conditions for strategy execution, including date range filtering and order/loss limitations.
• Intuitive Visualization: Enhance strategy clarity with customizable visual elements and trade visualization features.
• Advanced Alert Configurations: Stay informed with comprehensive and customizable alerts for effective backend integration.
• Backend Integration With JSON Format: Leverage elaborate and structured data in JSON format for advanced analytics, enhancing decision-making and strategy optimization outside TradingView.
Let's review the separate parts of this indicator.
█ STRATEGY INPUTS
We've provided 2 inputs for connecting a signal filter or indicators or chains (1→, 2→) which are all set to 'Close' by default.
An input has several controls:
• Enable disable: Toggle the entire input on or off
• Input: Connect indicators or signal filter here, choose indicators with a compatible : Signal connector.
• G - Gain: Increase or reduce the strength of the incoming signal by a factor.
• SM - Signal Mode: Choose a trading direction compatible with the settings in your signal filter
• XM - Exit Mode: Determine when to allow to exit your open trade
○ Always: Doesn't take the restrictions into account, this ignores all the settings chosen in ML or MP
○ Restricted: Use both ML and MP conditions
○ Loss: Use the ML condition only, for example: Position will be exited and the exit signal will be allowed only when the loss exceeds the ML parameter
○ Profit: Use the MP condition only for example: Exits will only be allowed when the profit of the position exceeds the condition of the MP parameter
█ POSITION INVESTMENT
Determine the percentage of your trading budget you would like to use in each position based on the strategy's profit or loss.
• LINVB - Loss Investment Base: Choose which base to use to determine the investment percentage when the strategy is in a loss.
○ Equity: Use the equity as the base for percentage calculation.
○ Initial capital: Use the initial capital as the base for percentage calculation.
• LINV% - Loss Investment Percentage: Set a percentage of the chosen investment base as the investment for a new position.
○ For example, when 10% in loss, and a initial capital of $100, and the investment base is set to equity with a percentage of 50%, your investment will be 50% of $90, $45.
• PINVB - Profit Investment Base: Choose which base to use to determine the investment percentage when the strategy is in profit.
○ Equity: Use the equity as the base for percentage calculation.
○ Initial capital: Use the initial capital as the base for percentage calculation.
• PINV% - Profit Investment Percentage: Set a percentage of the chosen investment base as the investment for a new position.
○ For example, when 10% in profit, and an initial capital of $100, and the investment base is set to equity with a percentage of 100%, your investment will be 100% of $110, $110.
• XINVB - Custom Profit Investment Base: Choose which base to use to determine the investment percentage when the strategy is above a custom profit threshold (XT).
○ Equity: Use the equity as the base for percentage calculation.
○ Initial capital: Use the initial capital as the base for percentage calculation.
• XINV% - Custom Profit Investment Percentage: Set a percentage of the chosen investment base as the investment for a new position.
○ For example, when 100% in profit, exceeding the XT threshold of 50%, and an initial capital of $100, and the investment base is set to equity with a percentage of 50%, your investment will be 50% of $200, $100.
• XT% - Custom Profit Threshold: Determine how much profit triggers these custom profit investment settings.
• ELIB% - Entry Long Investment Base: Following previous settings, you can further restrict the investment according to the long trading direction.
○ For instance, if the previous calculation resulted in $45 to be used as an investment, and you've set the ELIB% to 50%, your long position will use 50% of $45, which is $22.5.
• ESIB% - Entry Short Investment Base: Following previous settings, you can further restrict the investment according to the short trading direction.
○ For example, if the previous calculation resulted in $45 to be used as an investment, and you've set the ESIB% to 50%, your short position will use 50% of $45, which is $22.5.
• RISK% - Risk Percentage:
○ Determine how much of the calculated position investment is at risk when the stop-loss is hit.
- For example, 1% of $45 represents a maximum loss of $0.45.
○ Risk percentage works together with the stop loss and the max leverage.
• MXLVG - Maximum Leverage:
○ Investigate the trading rules for your trading pair and use the maximum allowed amount of leverage.
○ To determine the number of contracts to be bought or sold, considering the stop loss and the specified risk percentage, the maximum leverage available will constrain the amount of leverage utilized to ensure that the maximum risk threshold is not exceeded. For instance, suppose the stop loss is set at 1%, and the risk percentage is defined as 10%. Initially, the calculated leverage to be used would be 10. However, if there is a maximum leverage cap set at 5, it would constrain the calculated leverage of 10 to adhere to the maximum limit of 5.
█ EXIT STOP LOSS
Determine the Stop Loss price based on your selected configuration.
As the stop loss is an integral part of the ordered contracts calculation used in conjunction with the Risk and Max leverage, you'll always need to provide a stop loss price.
• SLLB - Stop Loss Long Base: Choose a stop loss mode for calculating stop loss prices in long positions.
○ Risk: Determines the price using the Risk parameter (RISK%) and maximum leverage (MXLVG). In this case, SLLB% will not have any impact.
○ Price Entry + Offset: Calculates the stop loss price based on a offset percentage (SLLB%) from the entry price of the position.
○ Source: Computes the stop loss price based on an external indicator defined in SLLSRC.
- If this results in an invalid price, the calculation will revert to using the price entry + offset.
○ Source + Offset: Determines the stop loss price based on a positive or negative offset percentage (SLLB%) from an external indicator defined in SLLSRC.
- If this results in an invalid price, the calculation will fall back to using the price entry + offset.
• SLLB% - Stop Loss Long Base Percentage: Define an offset percentage that will be applied in the price entry + offset and source + offset stop loss modes.
• SLLSRC - Stop Loss Long Source: Connect an external indicator as the source for stop loss (only those providing price values eg: bollinger bands, moving averages...).
• SLLT - Stop Loss Long Trailing:
○ Fixed: The initial stop loss will be kept and no trailing stop loss will be applied.
○ Trail Stop: Takes into account all settings defined in SLLB and SLLB% and recalculates them with each candle.
- If a better stop loss is computed, it replaces the existing stop loss. In this mode SLLT% will be disregarded.
○ Trail Stop till BE: Similar to trailing stop mode, but it stops trailing when the stop loss reaches the break-even point.
○ Trail Stop from BE: Similar to trailing stop mode, but it starts trailing when the stop loss reaches the break-even point.
○ Trail Price: Computes the trailing stop loss price based on an offset percentage (SLLT%) from the closing price of the current candle.
- If a better stop loss price is calculated, it will be set as the new stop loss price.
○ Trail Price till BE: Similar to the Trail Price mode, but it stops trailing when the stop loss reaches the break-even point.
○ Trail Price from BE: Similar to Trail Price mode, but it starts trailing when the stop loss reaches the break-even point.
○ Trail Incr: Adapts the trailing stop loss price based on the offset percentage (SLLT%).
- Each price change in favor of your position will incrementally adapt the trailing stop loss with SLLT%.
○ Trail Incr till BE: Similar to the Trail Incr mode, but it stops trailing when the stop loss reaches the break-even point.
• SLLT% - Stop Loss Long Trailing Percentage: This percentage serves as an offset or increment depending on your chosen trailing mode.
• SLSB - Stop Loss Short Base: Functions similarly to SLLB but for short positions.
• SLSB% - Stop Loss Short Base Percentage: Functions similarly to SLLB% but for short positions.
• SLSSRC - Stop Loss Short Source: Functions similarly to SLLSRC but for short positions.
• SLST - Stop Loss Short Trailing: Functions similarly to SLLT but for short positions.
• SLST% - Stop Loss Short Trailing Percentage: Functions similarly to SLLT% but for short positions.
█ EXIT TAKE PROFIT
Determine the Take Profit price based on your selected configuration.
• TPLB - Take Profit Long Base: Choose a take profit mode for calculating take profit prices in long positions.
○ Reward: Determines the take profit price using the Risk parameter (RISK%) and the calculated Stop Loss price and the set reward percentage (TPLB%).
- For example: Risk 1%, Calculated Stop loss price: $90, Entry price: $100, Reward (TPLB%): 2%, will result in a take profit price on $120.
○ Price Entry + Offset: Calculates the take profit price based on a offset percentage (TPLB%) from the entry price of the position.
- For example: Entry price: $100, Offset (TPLB%): 2%, will result in a take profit price on $102.
○ Source: Computes the take profit price based on an external input from another indicator defined in TPLSRC.
- If this results in an invalid price, the calculation will revert to using the price entry + offset.
○ Source + Offset: Determines the take profit price based on a positive or negative offset percentage (TPLB%) from an external indicator inpuy defined in TPLSRC.
- If this results in an invalid price, the calculation will fall back to using the price entry + offset.
• TPLB% - Take Profit Long Base Percentage: Define an offset percentage that will be applied in the price entry + offset and source + offset take profit modes.
• TPLSRC - Take Profit Long Source: Choose to connect an external indicator as the source for take profit (of course only those which provide price values eg: bollinger bands, moving averages... but not oscillators).
• TPLT - Take Profit Long Trailing:
○ Fixed: The initial take profit will be kept and no trailing take profit will be applied.
○ Trail Profit: Takes into account all settings defined in TPLB and TPLB% and recalculates them with each candle.
- If an applicable take profit is computed, it replaces the existing take profit. In this mode TPLT% will be disregarded.
○ Trail Profit till BE: Similar to trailing profit mode, but it stops trailing when the take profit reaches the break-even point.
○ Trail Profit from BE: Similar to trailing profit mode, but it starts trailing when the take profit reaches the break-even point.
○ Trail Price: Computes the trailing take profit price based on an offset percentage (TPLT%) from the closing price of the current candle.
- If an applicable take profit price is calculated, it will be set as the new take profit price.
○ Trail Price till BE: Similar to the Trail Price mode, but it stops trailing when the take profit reaches the break-even point.
○ Trail Price from BE: Similar to Trail Price mode, but it starts trailing when the take profit reaches the break-even point.
○ Trail Incr: Adapts the trailing take profit price based on the offset percentage (TPLT%). Each price change against your position will incrementally adapt the trailing take profit with TPLT%.
○ Trail Incr till BE: Similar to the Trail Incr mode, but it stops trailing when the take profit reaches the break-even point.
• TPLT% - Take Profit Long Trailing Percentage: This percentage serves as an offset or increment depending on your chosen trailing mode.
• TPSB - Take Profit Short Base: Functions similarly to TPLB but for short positions.
• TPSB% - Take Profit Short Base Percentage: Functions similarly to TPLB% but for short positions.
• TPSSRC - Take Profit Short Source: Functions similarly to TPLSRC but for short positions.
• TPST - Take Profit Short Trailing: Functions similarly to TPLT but for short positions.
• TPST% - Take Profit Short Trailing Percentage: Functions similarly to TPLT% but for short positions.
█ ENTRY INVESTMENT DISTRIBUTION
Based on your position investment calculation you can distribute the position investment accross the initial opening trade of the position (SIG%) or the follow up Dollar Cost Averaging (DCA%) or Break Out (BRO%) trades.
For example: SIG%: 10%, DCA%: 45%, BRO%: 45% and the calculated Position Investment is $100, then the initial trade will receive $10, DCA will receive $45, and BRO will receive $45 to work with. Disable BRO and or DCA by setting them to 0%. Keep in mind that the sum of SIG, BRO and DCA may not exceed 100%.
• SIG% - Initial order investment percentage based on the signal: The percentage of the position investment distributed over normal trades.
• DCA% - Dollar Cost Averaging investment percentage: The percentage of the position investment distributed to DCA trades.
• BRO% - Break Out investment percentage: The percentage of the position investment distributed to BRO trades.
█ ENTRY DCA
DCA (Dollar-Cost Averaging) is a risk mitigation strategy where the allocated DCA% budget from the Entry Investment Distribution is distributed among x levels (DCA#) based on calculated prices (DPLM) and order sizes (DOSM), when prices move against your position.
• DCA# - Maximum DCA levels: Set the maximum number of DCA levels.
• DPLM - DCA Price Level Mode: Choose a price level mode that determines at which prices the additional purchases are distributed:
○ Linear: Entry prices are evenly spaced at regular intervals.
○ QuadIn: Entry prices are front-loaded, with more at the beginning and fewer later.
○ QuadOut: Entry prices are back-loaded, with fewer at the beginning and more later.
○ QuadInOut: Entry prices start front-loaded, then become back-loaded.
○ CubicIn: Similar to QuadIn but with a smoother front-loaded distribution.
○ CubicOut: Similar to QuadOut but with a smoother back-loaded distribution.
○ ExpoIn: Entry prices are exponentially increasing, starting small and growing.
○ ExpoOut: Entry prices are exponentially decreasing, starting large and reducing.
○ ExpoInOut: Entry prices start exponentially increasing, then decrease exponentially.
• DOSM - DCA Order Size Mode: Choose a DCA budget distribution mode for order sizes:
○ Linear: Order sizes are evenly spaced at regular intervals.
○ QuadIn: Order sizes are front-loaded, with larger orders at the beginning and smaller ones later.
○ QuadOut: Order sizes are back-loaded, with smaller orders at the beginning and larger ones later.
○ QuadInOut: Order sizes start front-loaded and transition to back-loaded.
○ CubicIn: Similar to QuadIn but with a smoother front-loaded distribution of order sizes.
○ CubicOut: Similar to QuadOut but with a smoother back-loaded distribution of order sizes.
○ ExpoIn: Order sizes exponentially increase, starting small and growing.
○ ExpoOut: Order sizes exponentially decrease, starting large and reducing.
○ ExpoInOut: Order sizes start exponentially increasing, then decrease exponentially.
For a visual representation of the price or order size distribution modes, refer to online easing curves.
█ ENTRY BRO
BRO (Break Out) is a risk mitigation strategy where the allocated BRO% budget from the Entry Investment Distribution is distributed among x levels (BRO#) based on calculated prices (BPLM) and order sizes (BOSM), when prices move in favor of your position.
• BRO# - Maximum BRO levels: Set the maximum number of BRO levels.
• BPLM - BRO Price Level Mode: Choose a price level mode that determines at which prices the additional purchases are distributed:
○ Distribution easing modes work similar as the DCA easing modes.
• BOSM - BRO Order Size Mode: Choose a BRO budget distribution mode for order sizes:
○ Distribution easing modes work similar as the DCA easing modes.
█ ORDER SETTINGS
Fine-tune accuracy to match your exchange's trading constraints, enhancing backtest precision with these settings, default settings are least restrictive for crypto trading pairs.
• MINP - Mininmum Position Notional Value: Exchange-defined minimum notional value for positions:
○ Calculated based on your exchange's rules and is the minimum total value your position must hold to meet their requirements It is calculated by multiplying Quantity with price and leverage.
○ It helps ensure your trades align with your exchange's standards.
• MAXP - Maximum Position Notional Value: Exchange-defined maximum notional value for positions:
○ Similar to MINP, this value is calculated based on your exchange's rules and represents the maximum total value allowed for your position.
• MINQ - Mininmum Order Quantity: Least permissible order quantity based on exchange rules:
○ This is the smallest quantity of an asset that your exchange allows you to trade in a single order.
• MAXQ - Maximum Order Quantity: Highest permissible order quantity according to exchange rules:
○ Opposite of MINQ, this is the largest quantity of an asset you can trade in a single order as defined by your exchange.
• DECP - Decimals in Order Price: Allowed decimal places in order prices as per exchange specifications:
○ This value specifies the number of decimal places you can use when specifying the price of an order.
• DECQ - Decimals in Order Quantity: Permitted decimal places in order quantities according to exchange specifications:
○ Similar to DECP, this value indicates the number of decimal places you can use when specifying the quantity of an asset in an order.
█ STRATEGY CONDITIONS
Specify when the strategy is permitted to execute trades.
• DATE: Enable the Date Range filter to restrict entries to a specific date range.
○ START: Set a start date and hour to commence trading.
○ END: Set an end date and hour to conclude trading within the defined range.
• IDO - Maximum Intraday Orders: Limit the number of orders the strategy can place within a single trading day. Upon reaching this limit, the strategy temporarily halts further entries for the day.
• DL% - Maximum Intraday Loss%: Set a threshold for the maximum allowable intraday loss as a percentage of equity. When exceeded, the strategy temporarily suspends trading for the day.
• CLD - Maximum Consecutive Loss Days: Define the maximum number of consecutive days the strategy can incur losses. Upon reaching this limit, the strategy halts trading and avoids new entries.
• DD% - Maximum Drawdown: Specify the maximum permissible drawdown as a percentage of equity. If this limit is met, the strategy halts trading and refrains from placing additional entries.
• TP% - Total Profit %: Establish a target for the total profit percentage the strategy aims to achieve. Once this target is attained, the strategy halts trading and refrains from initiating new entries.
• TL% - Total Loss %: Define a limit for the total loss percentage relative to the initial capital. If this limit is exceeded, the strategy discontinues trading and refrains from placing further entries.
■ VISUALS
• LINE: Activate a colored dashed diagonal line to visually connect the entry and exit points of positions.
• SLTP: Enable visualization of stop loss, take profit, and break-even levels.
• PNL: Enable Break-Even and Close Lines along with a colored area in between to visualize profit and loss.
• ☼: Brightness % : Adjust the opacity of the plotted trading visuals.
• P - Profit Color : Choose the color for profit-related elements.
• L - Loss Color: Choose the color for loss-related elements.
• B - Breakeven Color : Select the color for break-even points.
• EL - Long Color: Specify the color for long positions.
• ES - Short Color: Specify the color for short positions.
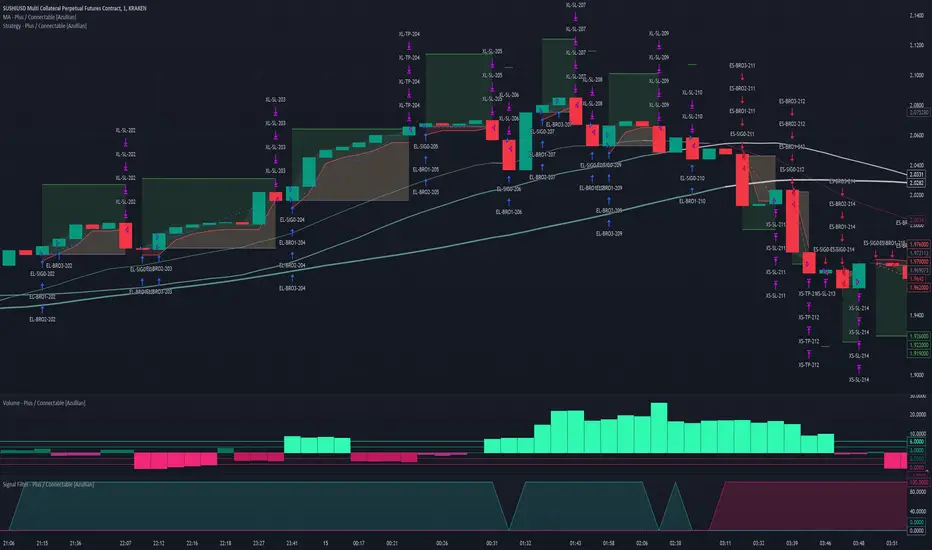
• TRADE LABELING: For better analysis we've labeled all entries and exits conform with the type of order your strategy has executed, some examples:
○ EL-SIG0-124: Enter Long - Signal 0 - Position 124
○ EL-BRO1-130: Enter Long - BRO1 - Position 130
○ EL-BRO2-130: Enter Long - BRO2 - Position 130
○ ES-DCA1-140: Enter Short - DCA1 - Position 140
○ XS-DCA2-140: Exit Short - DCA2 - Position 140
○ XL-TP-150: Exit Long - Take Profit - Position 150
○ XS-TP-154: Exit Short - Take Profit - Position 154
○ XL-SL-160: Exit Long - Stop Loss - Position 160
○ XS-SL-164: Exit Short - Stop Loss - Position 164
○ XS-CND-165: Exit Short - Strategy Condition - Max intraday loss - Position 165
■ ALERT SETTINGS
For developers and those who wish to integrate TradingView alerts into their backend systems, we offer comprehensive labeling options.
• ALID: A unique identifier you've assigned to your alert.
• NAME: A structured name you've given to this strategy.
• LAYOUT: The layout key of the strategy, allowing direct chart linking from your backend.
• SYMBOL: The symbol on which the strategy operates.
○ ONCE: You can choose to include this information only in the first message to reduce message size and repetition in follow-up messages. (max. 4096 characters)
• TICK: The ticker for the strategy.
• CHART: The chart parameter containing the timeframe.period and timeframe.multiplier.
○ ONCE: You can choose to include this information only in the first message to reduce message size and repetition in follow-up messages. (max. 4096 characters)
• BAR: Includes bar information in the alert message.
• STRATEGY: Adds strategy inputs to the alert message.
○ ONCE: You can choose to include this information only in the first message to reduce message size and repetition in follow-up messages. (max. 4096 characters)
• PERFORMANCE: Incorporates strategy performance data into the alert message.
• SIGNAL: Appends received signal weights (EL, XL, ES, XS) to the alert message.
• ORDERS: Includes order details in the alert message.
• TAGS: Adds up to 6 tags and their corresponding values to the alert message.
○ ONCE: You can choose to include this information only in the first message to reduce message size and repetition in follow-up messages. (max. 4096 characters)
Of course we can't neglect letting you in on how this juicy JSON would look (without the // comments):
{
"id": 20726, // Message Id
"t": "2023-11-01T10:35:00Z", // Message Time
"al": { // Alert
"id": "639bfa9a-5f01-4031-8880-7ec01e972055", // Alert Id
"n": "TEST04", // Name
"l": "ABC123" // Layout
},
"sym": { // Symbol
"typ": "crypto", // Type
"r": "DOGEUSD.PM", // Root
"pre": "KRAKEN", // Prefix
"tc": "DOGEUSD.PM", // Ticker
"bc": "DOGE", // BaseCurrency
"c": "USD", // Currency
"d": "DOGEUSD Multi Collateral Perpetual Futures Contract", // Description
"mtc": 0.000001, // MinTick
"pv": 1, // PointValue
"ct": "PF_DOGEUSD" // CustomTicker
},
"ch": { // Chart
"pd": "1", // Period
"mul": 1 // Multiplier
},
"bar": { // Bar
"id": 20725, // Index
"t": "2023-11-01T10:33:00Z", // Time
"o": 0.066799, // Open
"h": 0.066799, // High
"l": 0.066799, // Low
"c": 0.066799, // Close
"v": 2924 // Vol
},
"strat": { // Strategy
"n": "Strategy - Plus / Connectable ", // Name
"sig": { // Signal
"c1e": true, // Connector1Enabled
"c1s": 500500.500501, // Connector1Source
"c1g": 1, // Connector1Gain
"c2e": false, // Connector2Enabled
"c2s": 0.067043, // Connector2Source
"c2g": 1, // Connector2Gain
"sm": "Swing (EL, ES)", // SignalMode
"xm": "Always", // ExitMode
"mlp": 0.01, // ExitModeMinPercLoss
"mpp": 0.01 // ExitModeMinPercProfit
},
"inv": { // Investment
"lb": "Equity", // LossBase
"lp": 50, // LossPerc
"pb": "Equity", // ProfitBase
"pp": 100, // ProfitPerc
"pcb": "Equity", // ProfitCustomBase
"pcp": 100, // ProfitCustomPerc
"pct": 10000, // ProfitCustomThreshold
"elp": 100, // LongPerc
"esp": 100, // ShortPerc
"rsk": 1, // MaxRisk
"lvg": 10 // MaxLeverage
},
"sl": { // StopLoss
"lb": "Price Entry + Offset", // LongBase
"lp": 0.2, // LongPerc
"lsrc": 0.067043, // LongSource
"lt": "Trail Stop", // LongTrailMode
"ltp": 0.2, // LongTrailPerc
"sb": "Price Entry + Offset", // ShortBase
"sp": 0.2, // ShortPerc
"ssrc": 0.067043, // ShortSource
"st": "Trail Stop", // ShortTrailMode
"stp": 0.2 // ShortTrailPerc
},
"tp": { // TakeProfit
"lb": "Price Entry + Offset", // LongBase
"lp": 1, // LongPerc
"lsrc": 0.067043, // LongSource
"lt": "Fixed", // LongTrailMode
"ltp": 1, // LongTrailPerc
"sb": "Price Entry + Offset", // ShortBase
"sp": 1, // ShortPerc
"ssrc": 0.067043, // ShortSource
"st": "Fixed", // ShortTrailMode
"stp": 1 // ShortTrailPerc
},
"dis": { // Distribution
"sigp": 10, // SignalPerc
"dcap": 0, // DCAPerc
"brop": 90 // BROPerc
},
"dca": { // DCA
"lvl": 3, // Levels
"pl": "linear", // ModePriceLevel
"os": "linear" // ModeOrderSize
},
"bro": { // BRO
"lvl": 3, // Levels
"pl": "expoIn", // ModePriceLevel
"os": "cubicOut" // ModeOrderSize
},
"ord": { // OrderSettings
"pmin": 5, // PNVMin
"pmax": 30000000, // PNVMax
"qmin": 0, // QtyMin
"qmax": 1000000000, // QtyMax
"dp": 6, // DecPrice
"dq": 6 // DecQty
},
"cnd": { // Conditions
"de": true, // DateRangeEnabled
"start": "2023-11-01T10:30:00Z", // StartTime
"end": "2024-12-31T23:30:00Z", // EndTime
"idoe": false, // MaxIntradayOrdersEnabled
"ido": 100, // MaxIntradayOrders
"dle": false, // MaxIntradayLossEnabled
"dl": 10, // MaxIntradayLossPerc
"clde": false, // MaxConsLossDaysEnabled
"cld": false, // MaxConsLossDays
"dde": false, // MaxDrawdownEnabled
"dd": 100, // MaxDrawdownPerc
"mpe": false, // MaxProfitEnabled
"mp": 200, // MaxProfitPerc
"mle": false, // MaxLossEnabled
"ml": -50 // MaxLossPerc
}
},
"perf": { // Performance
"ic": 1000, // InitialCapital
"eq": 1000, // Equity
"np": 0, // NetProfit
"op": 0, // OpenProfit
"ct": 0, // ClosedTrades
"ot": 0, // OpenTrades
"p": "FLAT", // MarketPosition
"ps": 0, // MarketPositionSize
"pp": "FLAT", // PreviousMarketPosition
"pps": 0 // PreviousMarketPositionSize
},
"sig": { // Signal
"el": 0, // EL
"xl": 0, // XL
"es": 6, // ES
"xs": 0 // XS
},
"ord": ,
"tag":
}
█ USAGE OF CONNECTABLE INDICATORS
■ Connectable chaining mechanism
Connectable indicators can be connected directly to the signal monitor, signal filter or strategy , or they can be daisy chained to each other while the last indicator in the chain connects to the signal monitor, signal filter or strategy. When using a signal filter you can chain the filter to the strategy input to make your chain complete.
• Direct chaining: Connect an indicator directly to the signal monitor, signal filter or strategy through the provided inputs (→).
• Daisy chaining: Connect indicators using the indicator input (→). The first in a daisy chain should have a flow (⌥) set to 'Indicator only'. Subsequent indicators use 'Both' to pass the previous weight. The final indicator connects to the signal monitor, signal filter, or strategy.
■ Set up this indicator with signals and a signal filter
The indicator provides visual cues based on signal conditions. However, its weight system is best utilized when paired with a connectable signal filter, monitor, or strategy .
Let's connect the Strategy - Plus to a connectable signal filter and connectable indicators :
1. Load all relevant indicators
• Load MA - Plus / Connectable
• Load Signal filter - Plus / Connectable
• Load Strategy - Plus / Connectable
2. Signal Filter Plus: Connect the MA - Plus to the Signal Filter
• Open the signal filter settings
• Choose one of the five input dropdowns (1→, 2→, 3→, 4→, 5→) and choose : MA - Plus / Connectable: Signal Connector
• Toggle the enable box before the connected input to enable the incoming signal
3. Signal Filter: Update the filter settings if needed
• The default filter mode for the trading direction is SWING, and is compatible with the default settings in the strategy and indicators.
4. Signal Filter: Update the weight threshold settings if needed
• All connectable indicators load by default with a score of 6 for each direction (EL, XL, ES, XS)
• By default, weight threshold is 'ABOVE' Threshold 1 (TH1) and Threshold 2 (TH2), both set at 5. This allows each occurrence to score, as the default score is 1 point above the threshold.
5. Strategy Plus: Connect one of the strategy plus inputs to the signal filters signal connector in the strategy settings
• Select a strategy input → and select the Signal filter - Plus: Signal connector
6. Strateg Plus: Enable filter compatible directions
• As the default setting of the filter is SWING, we should also set the SM (Strategy mode) to SWING.
7. Strateg Plus: You're ready to start optimizing
• Dive into all parameters and start optimizing your backtesting results.
█ BENEFITS
• Adaptable Modular Design: Arrange indicators in diverse structures via direct or daisy chaining, allowing tailored configurations to align with your analysis approach.
• Streamlined Backtesting: Simplify the iterative process of testing and adjusting combinations, facilitating a smoother exploration of potential setups.
• Intuitive Interface: Navigate TradingView with added ease. Integrate desired indicators, adjust settings, and establish alerts without delving into complex code.
• Signal Weight Precision: Leverage granular weight allocation among signals, offering a deeper layer of customization in strategy formulation.
• Advanced Signal Filtering: Define entry and exit conditions with more clarity, granting an added layer of strategy precision.
• Clear Visual Feedback: Distinct visual signals and cues enhance the readability of charts, promoting informed decision-making.
• Standardized Defaults: Indicators are equipped with universally recognized preset settings, ensuring consistency in initial setups across different types like momentum or volatility.
• Reliability: Our indicators are meticulously developed to prevent repainting. We strictly adhere to TradingView's coding conventions, ensuring our code is both performant and clean.
█ COMPATIBLE INDICATORS
Each indicator that incorporates our open-source 'azLibConnector' library and adheres to our conventions can be effortlessly integrated and used as detailed above.
For clarity and recognition within the TradingView platform, we append the suffix ' / Connectable' to every compatible indicator.
█ COMMON MISTAKES, CLARIFICATIONS AND TIPS
• Removing an indicator from a chain: Deleting a linked indicator and confirming the "remove study tree" alert will also remove all underlying indicators in the object tree. Before removing one, disconnect the adjacent indicators and move it to the object stack's bottom.
• Point systems: The azLibConnector provides 500 points for each direction (EL: Enter long, XL: Exit long, ES: Enter short, XS: Exit short) Remember this cap when devising a point structure.
• Flow misconfiguration: In daisy chains the first indicator should always have a flow (⌥) setting of 'indicator only' while other indicator should have a flow (⌥) setting of 'both'.
• Hide attributes: As connectable indicators send through quite some information you'll notice all the arguments are taking up some screenwidth and cause some visual clutter. You can disable arguments in Chart Settings / Status line.
• Layout and abbreviations: To maintain a consistent structure, we use abbreviations for each input. While this may initially seem complex, you'll quickly become familiar with them. Each abbreviation is also explained in the inline tooltips.
• Inputs: Connecting a connectable indicator directly to the strategy delivers the raw signal without a weight threshold, meaning every signal will trigger a trade.
• Layout and Abbreviations: Abbreviations streamline structure and input identification. Although they may seem complex initially, inline tooltips provide explanations, facilitating quick acclimatization.
• Total Trade Limit Error & Date-Time Filter: For deep backtesting, be mindful of the total trade limit. Utilize the date-time filter to narrow the test scope and avoid TradingView order limits.
• Calculation Timeout: Encounter a timeout? Adjust any parameter slightly to restart the calculation process.
• Message Character Limit: To stay within message character limits, consider turning off certain features or setting some to 'once'.
• Direct Indicator-to-Strategy Connection: When connecting an indicator directly to a strategy without thresholds, the strategy will default to long if weights are equally assigned.
• Pyramid Enabling with DCA and BRO: Activate pyramid orders, enabling you to optimize your strategy during Dollar Cost Averaging and Break Out trades.
• Recalculate & Fill Orders Properties: Adjusting these default settings in strategy properties tab may lead to unexpected behavior when backtesting. Approach with caution.
• Optimized for Crypto: Our indicators have been optimized and tested primarily on cryptocurrency markets. Results in other markets may vary.
• Inline Tooltips Documentation: Detailed documentation and guidance are available via inline tooltips for immediate assistance.
• Strategy Settings Margin: Set margin to 1 to be able to apply leverage.
• Styling Panel: Explore the styling panel to disable labels or any other visual cues to reduce clutter on busy charts, enhancing visual clarity and personalization.
• Applying Leverage on Spot Markets: Ensure that maximum leverage on spot markets is configured to 1.
• Unrealistic Order Sizes: Verify that the order book can accommodate your backtested order sizes.
█ A NOTE OF GRATITUDE
Through years of exploring TradingView and Pine Script, we've drawn immense inspiration from the community's knowledge and innovation. Thank you for being a constant source of motivation and insight.
█ RISK DISCLAIMER
Azullian's content, tools, scripts, articles, and educational offerings are presented purely for educational and informational uses. Please be aware that past performance should not be considered a predictor of future results.
Поиск скриптов по запросу "backtest"
Strategy Development Environment [BerlinCode42]Happy Trade,
Intro
What is New
Algebraic/Boolean Equation
Instruction Set for The Algebraic/Boolean Equation
Example
Usage
Settings Menu
Declaration for Tradingview House Rules on Script Publishing
Disclaimer
Conclusion
1. Intro
This is a rich equipped fork of my previous "Backtest any Indicator v5". And serves as the fitting backtester and trade strategy creation tool for my upcoming ANN Indicators (artificial neural network).
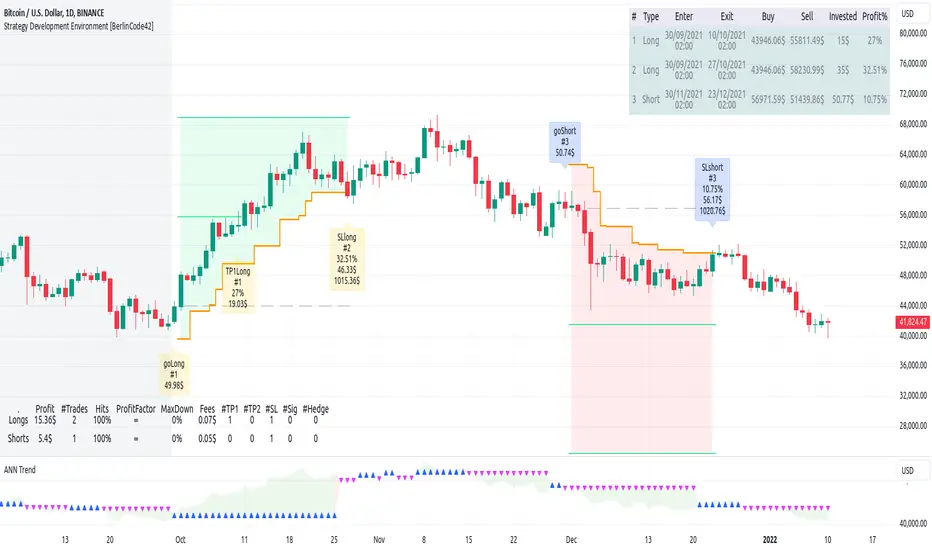
As the previous version this script has no trade signal generating code. The trade signals comes in by the five user settable input slots where the user plug-in external indicators. The final trade siganls go long etc are defined by a algebraic/boolean equation typed in as text in 4 terminals as shown in Image 0 . With this algebraic/boolean equations input the user can setup any trade logic as complex and fast and easy as never seen before here on TradingView.
Image 0
2. What is new
Input algebraic/boolean equations in text-form for go long, go short, exit long & exit short
Five input slots for external indicator signals
Equation tester
User settable signal delay for enter and exit trades
User selectable alternating trades filter
User settable exit long = enter short
Intrabar or trade only on bar closing
Time filter with duration input
User settable UTC Adjustment
Long and short trades possible
Two Take Profits with quantity setting
Trailing Stop
Webhook connection
3. Algebraic/Boolean Equation
This is where the magic happens. Unlike other backtesters that rely on drop-down menus to define trade signal equations—thus limiting the number of input signals and the complexity of logic—this script uses a string interpreter to solve equations. With this, you can develop your trade logic equations and add signals or conditions simply by writing them down in algebraic/boolean form.
The instruction set for this interpreter includes not only external input signals but also several internal values. These include BarTime, BarIndex, Open, High, Low, Close, True Range, Minimal Tick, Volume, and a signal that indicates whether there is an open trade (long, short, or none). You can also reference the values of past bars for all these inputs and, of course, use constant values in your equations. There is a sad limitation: Only one past bar value per equation is practicable. If you use more, errors can occur. It seems to be caused by the pipe line architecture of the parallel computing. In any attempt to solve this issue an older function call result was hand over.
The implemented functions cover a wide range of algebraic and boolean operations. A boolean "true" is represented by all values greater than zero, while "false" is represented by zero or values less than zero.
4. Instruction set for the Algebraic/Boolean Equation
There are functions that accept either two input values or one input value. The general form is (XandY) or (notX), where X and Y can be any input slot, predefined value, constant, or another sub-equation. Functions are always written in lowercase, while input slots and predefined values use uppercase letters.
Each sub-equation must be enclosed in parentheses, e.g., (A+B). Without proper use of parentheses, the interpreter cannot determine which function to calculate first. Negative constants must be expressed by subtracting from zero (e.g., (0-3.14)), so careful attention is required.
Here are some examples that demonstrate both incorrect and correct notations:
incorrect correct
(A+B*C) (A+(B*C))
(A+B+D+E) (A+(B+(D+E)))
(-20>A) ((0-20)>A)
(A*-B) (A*(0-B))
(AnotB) (Aand(notB))
ABS(a-b) (abs(A-B))
The correct usage ensures the interpreter calculates in the intended order.
And here comes the complete Instruction Set:
Addition: (A+B)
Subtraction: (A-B)
Multiplication: (A*B)
Division: (A/B)
Absolut value: (absA)
Power of: (A^B)
Natural Logarithm: (logA)
Lowest value of Low of last x bars: (lotx)
Highest value of High of last x bars: (hotx)
Modulo, Remainder of a Division: (A%B)
Round: (rndA)
round to ceil: (ceiA)
Round to floor: (floA)
Round to next minimal tick: (mitA)
EMA of A of last 3 bars: (e03A)
EMA of A of last 7 bars: (e07A)
EMA of A of last 10 bars: (e10A)
EMA of A of last 20 bars: (e20A)
EMA of A of last 50 bars: (e50A)
Smaller then: (AB)
Equal to: (A==B)
Unequal to: (A!=B)
And: (AandB)
Or: (AorB)
Exclusive Or: (AxorB)
Not: (notA)
Past bar value: (A ) ,whereby x can be 1,2,3,...,barIndex-1
Bar time: (T)
Bar index: (I)
Opening Price of Bar: (O)
Highest Price of Bar: (H)
Lowest Price of Bar: (L)
Closing Price of Bar: (C)
Min tick value for the current symbol: (K)
Trade Volume: (V)
True Range: (R)
Is Money invested: (M) ,Long position: M=1,
Short position: M=-1,
No position: M=0
Reminder: if you wanna replace A or B above don't forget the parentheses. So if you have (logA) and wanna replace A with D+F so the correct replacement would be (log(D+F)).
In the following there are some examples of popular bar patterns and useful filters:
Doji: ((abs(O-C))<(10*K))and((H-L)>(100*K))
green Hammer: (((H-C)<(5000*K))and(((O-L)/2)>(abs(O-C)))
Up trend: (C>(e10H))
Down trend: (C<(e10L))
cool down 7 bars: (( any buy condition )and((e07(absM))==0))
possible Pivot High: (H==(hot30))and((CC))
possible Pivot Low: (L==(lot30))and((C>H )or(O0)), goShort ((A>0)and((A )<0)), Enter Signal delay=0, Exit Signal delay=0, Alternate Trades=true
take profit 1 =0.4% (30%), take profit 2 =0.7%, trailing stop loss=0.2%, intrabar, start capital=1000$, qty=5%, fee=0.05%, no Session Filter
Image 1
6. Usage
First you need to attach some signals from external Indicators. In the example above we use the Stochastic RSI indicator from TradingView. Load the Stochastic RSI indicator to the chart. Then you go to the settings menu of this script, choose in the drop-down menu of Input A the signal .
In case you wanna use a signal which is not in the drop-down menu of Input A do the following:
1) You need to know the name of the boolean (or integer) variable of your indicator which hold the desired signal. Lets say that this boolean variable is called BUY. If this BUY variable is not plotted on the chart you simply add the following code line at the end of your pine script.
For boolean (true/false) BUY variables use this:
plot(BUY ? 1:0,'Your buy condition hold in that variable BUY',display = display.data_window)
And in case your script's BUY variable is an integer or float then use instate the following code line:
plot(BUY ,'Your buy condition hold in that variable BUY',display = display.data_window)
2) Probably the name of this BUY variable in your indicator is not BUY. Simply replace in the code line above the BUY with the name of your script's trade condition variable.
3) Do the same procedure for your SELL variable. Then save your changed Indicator script.
4) Then add the changed Indicator script from step before and this backtester script to the chart ...
5) and go to the settings of it. Choose under "Settings -> Input A " your Indicator. So in the example above choose .
The form is usually: ' : BUY'. Then you see something like Image 1
6) Decide about each trade logic for Go Long and Go Short . In this Example we use for GoLong if "Stoch RSI: K" is smaller then 20. The "Stoch RSI: K" we already loaded it in input A. So we set under Go Long (A<20) and set Enter Signal Delay to 0.
Now we setup Go Short if "Stoch RSI: K" is bigger then 80. So we set under Go Short A>80. Enter Signal Delay is already set.
7) For the Exit conditions you can choose (trailing) Stop loss or Take Profit or Exit by Indicator Signal. What ever comes first triggers the exit. If you like to use an EMA Indicator for the Exit by Indicator just load it in a free input slot B, D, E, F or use the inbuild EMA. For this example we use the inbuild EMA of the last 7 values of close. It is called by the following equation: (e07C). So to exit a long trade when the close price crossunder this EMA you have to type in Exit Long ((e07C)>C). For exit a short trade enter in Exit Short ((e07C)
TTP VWAP BandThis indicator offers 20 VWAP bands and on-chart statistic data about the bands.
Features
- Longs and shorts
- Cherry-pick up to 5 bands for backtesting
- Plots 20 bands
- Step scale to increase deviation percentage on each band
- Period and timeframe selectors
- Band crosses: how many times a band was crossed (also percentage)
- Band bounces: how many times each band was pinched and bounced back (also percentage)
How to use:
1) Set the chart to 15 or 5 minute timeframe for higher backtesting accuracy
2) Select the first band deviation % (MIN Long VWAP % and MIN Short VWAP %), use a small number like 0.3 or 1.0 since the rest of the 20 bands will increase that amount later.
3) Select a step scale or leave it in 1 if you prefer same distance between all bands. Notice that if you use a value below 1 the bands will get closer to each other.
4) Observe the statistics and pay attention to how many times each of the bands are being crossed in percentage. This will later help you make decisions on when to enter and where to potentially put an SL.
Connect with your preferred backtester:
You can backtest a single or multiple bands at once. For example you could use the 7th band to enter a base order and later use crosses of the 4th band to enter safety orders. Any combination is possible!
Let's assume you decide that you will be backtesting only 1 band at the time as your single entry condition for your backtester.
Let's also assume that you want to use the 2nd band for long entries then do follow these steps:
- Set "Band 1 backtesting" to 2 so that it prints 1 every time the price crosses below the 2nd band.
- Leave the other Band backtesting band settings with a 0 so they stay disabled
- Add your backtester to the same chart and select "band 1 long signal"
- This signal will contain 1 every time your conditions are met

Unicorn QuantDeeply customizable trading algorithm with instant backtesting. It emulates real trading and displays all the actions it takes on the chart. For example, it shows when to enter or partially close a position, move Stop-Loss to breakeven, etc. The user can replicate these actions in their trading terminal in real time. The algorithm uses up to three Take-Profit levels, and a Stop-Loss level that can move in a trade to protect the floating profit.
The script can send real-time alerts to the user’s Email and to the cell phone via notifications in the TradingView app.
The indicator is designed to be used on all timeframes, including lower ones for intraday trading and scalping.
HOW TO USE
Set the Stop-Loss and up to three Take-Profit levels. Choose the rules for moving the Stop-Loss level in a trade. Adjust the sensitivity of the trading signals. And check the backtest result in the Instant Backtesting dashboard. If the performance of the strategy satisfies you, proceed with the forward testing or live trading.
When using this script, please, keep in mind that past results do not necessarily reflect future results and there are many factors that influence trading results.
FEATURES
Trading Signals
The feature calculates Buy and Sell signals for trend or swing trading. The user can change the Sensitivity parameter to control the frequency of the signals. This allows them to be adjusted for different markets and timeframes.
Position Manager
To make the Position Manager setup as easy as possible, the algorithm calculates Stop-Loss and Take-Profit levels in Average True Range (ATR) units. They are self-adjusting for any market and timeframe, since they account for its average volatility .
You don't have to worry about what market you are trading - Forex, Stocks, Crypto, etc. With the self-adjusting Stop-Loss and Take-Profit, you can find settings that work for one market and use the same numerical values as a starting point for a completely different market.
Instant Backtesting
After changing any settings, you can immediately see the performance of the strategy on the Instant Backtesting panel. Two metrics are displayed there - the percentage of profitable trades and the total return. This information, as well as the historical trades shown on the chart, will help you quickly and easily evaluate the settings.
SETTINGS
TRADING SIGNALS
Sensitivity - controls the sensitivity of the trading signals algorithm. It determines the frequency of the trading signals. The higher the value of this parameter, the less trading signals you get and the longer trends the algorithm tries to catch. The lower the sensitivity value, the more signals you receive. This can be useful if you want to profit from small price movements.
POSITION MANAGER
SL - sets the Stop-Loss level measured in ATR units.
TP1, TP2, TP3 - set the Take-Profit levels measured in the ATR units.
Close % at TP1, Close % at TP2, Close % at TP3 - set portions of the open position (as a percentage of the initial order size) to close at each of the TP levels.
At TP1 move SL to, At TP2 move SL to - set the rules for moving the Stop-Loss level in an open trade to protect the floating profit.
Show Open Position Dashboard - turns on/off a dashboard that shows the current Stop-Loss and Take-Profit levels for the open position.
BACKTESTING
Use Starting Date - turns on/off the starting date for the strategy and backtests. When off, all available historical data is used.
Starting Date - sets the starting date for the strategy and backtests.
Show Instant Backtesting Dashboard - turns on/off a dashboard that shows the current strategy performance: the percentage of profitable trades and total return.
Leverage - sets the leverage that the strategy uses.

Flux Charts - PAT Automation💎 GENERAL OVERVIEW
The PAT Automation is a powerful and versatile tool designed to help traders rigorously test their trading strategies against historical market data. With an array of advanced settings, traders can fine-tune their strategies, assess performance, and identify key improvements before deploying in live trading environments. This backtester offers a wide range of configurable settings, explained within this write-up.
Features of the PAT Automation:
Step By Step : Configure your strategy step by step, which will allow you to have OR & AND logic in your strategies.
Highly Configurable : Offers multiple parameters for fine-tuning trade entry and exit conditions.
Multi-Timeframe Analysis : Allows traders to analyze multiple timeframes simultaneously for enhanced accuracy.
Provides advanced stop-loss, take-profit, and break-even settings.
Incorporates volume-based conditions, liquidity grabs , order blocks , market structures and fair value gaps for refined strategy execution.
🚩 UNIQUENESS
The PAT Automation stands out from conventional backtesting tools due to its unparalleled flexibility, precision, and advanced trading logic integration. Key factors that make it unique include:
✅ Comprehensive Strategy Customization – Unlike traditional backtesters that offer basic entry and exit conditions, PAT Automation provides a highly detailed parameter set, allowing traders to fine-tune their strategies with precision.
✅ Multi-Timeframe Price Action Features – This is the first-ever tool that allows traders to backtest price action with multi-timeframe features such as Fair Value Gaps (FVGs), Inversion Fair Value Gaps (IFVGs), Order Blocks & Breaker Blocks.
✅ Customizable Take-Profit Conditions – Offers various methods to set take-profit exits, including using core features from price action, and fixed exits like ATR, % change or price change, enabling traders to tailor their exit strategies to specific market behaviors.
✅ Customizable Stop-Loss Conditions – Provides several ways to set up stop losses, including using concepts from price action and trailing stops or fixed exits like ATR, % change or price change, allowing for dynamic risk management tailored to individual strategies.
✅ Integration of External Indicators – Allows the inclusion of other indicators or data sources from TradingView for creating strategy conditions, enabling traders to enhance their strategies with additional insights and data points.
By integrating these advanced features, PAT Automation ensures that traders can rigorously test and optimize their strategies with great accuracy and efficiency.
📌 HOW DOES IT WORK?
The first setting you will want to set it the pyramiding setting. This setting controls the number of simultaneous trades in the same direction allowed in the strategy. For example, if you set it to 1, only one trade can be active in any time, and the second trade will not be entered unless the first one is exited. If it is set to 2, the script will handle both of them at the same time. Note that you should enter the same value to this pyramiding setting, and the pyramiding setting in the "Properties" tab of the script for this to work.
For deep backtesting, you can set "Max Distance To Last Bar" to "Unlimited". If you encounter any memory issues, try decreasing this setting to a lower value.
You can enable and set a backtesting window that will limit the entries to between the start date & end date.
Then, you can enter your desired settings to Price Action features like FVGs, IFVGs, Order Blocks, Breaker Blocks, Liquidity Grabs, Market Structures, EQH & EQL and Volume Imbalances. You can also enable and set up to 3 timeframes, which you can use later on when customizing your strategies enter / exit conditions.
Entry Conditions
From the "Long Conditions" or the "Short Conditions" groups, you can set your position entry conditions. For settings like "initial capital" or "order size", you can open the "Properties" tab, where these are handled.
The PAT Automation can use the following conditions for entry conditions :
1. Order Block (OB)
Detection: Triggered when an Order Block forms or is detected
Retest: Triggered when price retests an Order Block. A retest is confirmed when a candle enters an Order Block and closes outside of it.
Retracement: Triggered when price touches an Order Block
Break: Triggered when an Order Block is invalidated by candle close or wick, depending on the user's input.
2. Breaker Block (BB)
Detection: Triggered when a Breaker Block forms or is detected
Retest: Triggered when price retests a Breaker Block. A retest is confirmed when a candle enters a Breaker Block and closes outside of it.
Retracement: Triggered when price touches a Breaker Block
Break: Triggered when a Breaker Block is invalidated by candle close or wick, depending on the user's input.
3. Fair Value Gap (FVG)
Detection: Triggered when an FVG forms or is detected
Retest: Triggered when price retests an FVG. A retest is confirmed when a candle enters an FVG and closes outside of it.
Retracement: Triggered when price touches an FVG
Break: Triggered when an FVG is invalidated by candle close or wick, depending on the user's input.
4. Inversion Fair Value Gap (IFVG)
Detection: Triggered when an IFVG forms or is detected
Retest: Triggered when price retests an IFVG. A retest is confirmed when a candle enters an IFVG and closes outside of it.
Retracement: Triggered when price touches an IFVG
Break: Triggered when an IFVG is invalidated by candle close or wick, depending on the user's input.
5. Break of Structure (BOS)
Detection: Triggered when a BOS forms or is detected
6. Change of Character (CHoCH)
Detection: Triggered when a CHoCH forms or is detected
7. Change of Character Plus (CHoCH+)
Detection: Triggered when a CHoCH+ forms or is detected
8. Volume Imbalance (VI)
Detection: Triggered when a Volume Imbalance forms or is detected
9. Equal High (EQH)
Detection: Triggered when an EQH is detected
10. Equal Low (EQL)
Detection: Triggered when an EQL is detected
11. Buyside Liquidity Grab
Detection: Triggered when a liquidity grab occurs at Buyside Liquidity (BSL).
12. Sellside Liquidity Grab
Detection: Triggered when a liquidity grab occurs at Sellside Liquidity (SSL).
🕒 TIMEFRAME CONDITIONS
The PAT Automation supports Multi-Timeframe (MTF) features, just like the Price Action Toolkit. When setting an entry condition, you can also choose the timeframe.
To set up MTF conditions, navigate to the 'Timeframes' section in the settings, select your desired timeframes, and enable them. You can choose up to three timeframes.
Once you've selected your timeframes, you can use them in your strategy. When setting long and short entry / exit conditions, you can choose from Timeframe 1, Timeframe 2, or Timeframe 3.
External Conditions
Users can use external indicators on the chart to set entry conditions.
The second dropdown in the external condition settings allows you to choose a conditional operator to compare external outputs. Available options include:
Less Than or Equal To: <=
Less Than: <
Equal To: =
Greater Than: >
Greater Than or Equal To: >=
The position entry conditions work like this ;
Each side has 5 Price Action conditions and 1 Source condition. Each condition can be enabled or disabled using the checkbox on the left side.
For Price Action Conditions, you can set a direction: "Any", "Bullish" or "Bearish".
Then a Price Action Feature, like "FVG" or "Order Block".
The last part of our constructed condition is the alert type, which you can select between "Detection", "Retest", "Retracement" or "Break".
Now you should have a constructed condition, which should look like "Bullish Order Block Retest".
You can select which timeframe should this condition work on from Timeframe 1, 2 or 3. If you select "Any Timeframe", the condition will work for all timeframes.
Lastly select the step of this condition from 1 to 6.
The Source Condition
The last condition on each side is a source condition that is different from the others. Using this condition, you can create your own logic using other indicators' outputs on your chart. For example, suppose that you have an EMA indicator in your chart. You can have the source condition to something like "EMA > high".
The Step System
Each condition has a step number, and conditions are in topological order based on them.
The conditions are executed step by step. This means the condition with step 2 cannot be executed before the condition with step 1 is executed.
Conditions with the same step numbers have "OR" logic. This means that if you have 2 conditions with step 3, the condition with step 4 can trigger after only one of the step 3 conditions is executed.
➕ OTHER ENTRY FEATURES
The PAT Automation allows traders to choose when to execute trades and when not to execute trades.
1. Only Take Trades
This setting lets users specify the time period when their strategy can open or execute trades.
2. Don't Take Trades
This setting lets users specify time periods when their strategy can't open or execute trades.
↩️ EXIT CONDITIONS
1. Exit on Opposite Signal
When enabled, a long position will close when short entry conditions are met, and a short position will close when long entry conditions are met.
2. Exit on Session End
When enabled, positions will be closed at the end of the trading session.
📈 TAKE PROFIT CONDITIONS
There are several methods available for setting take profit exits and conditions.
1. Entry Condition TP
Users can use entry conditions as triggers for take-profit exits. This setting can be found under the long and short exit conditions.
2. Fixed TP
Users can set a fixed TP for exits. This setting can be found under the long and short exit conditions. Users can choose between the following:
Price: This method triggers a TP exit when price reaches a specified level. For example, if you set the Price TP to 10 and buy NASDAQ:TSLA at $190, the trade will automatically exit when the price reaches $200 ($190 + $10).
Ticks: This method triggers a TP exit when price moves a specified number of ticks.
Percentage (%): This method triggers a TP exit when price moves a specified percentage.
ATR: This method triggers a TP exit based on a specified multiple of the Average True Range (ATR).
📉 STOP LOSS CONDITIONS
There are several methods available for setting stop-loss exits and conditions.
1. Entry Condition SL
Users can use entry conditions as triggers for stop-loss exits. This setting can be found under the long and short exit conditions.
2. Fixed SL
Users can set a fixed SL for exits. This setting can be found under the long and short exit conditions. Users can choose between the following:
Price: This method triggers a SL exit when price reaches a specified level. For example, if you set the Price SL to 10 and buy NASDAQ:TSLA at $200, the trade will automatically exit when the price reaches $190 ($200 - $10).
Ticks: This method triggers a SL exit when price moves a specified number of ticks.
Percentage (%): This method triggers a SL exit when price moves a specified percentage.
ATR: This method triggers a SL exit based on a specified multiple of the Average True Range (ATR).
3. Trailing Stop
An explanation & example for the trailing stop feature is present on the write-up within the next section.
Exit conditions have the same logic of constructing conditions like the entry ones. You can construct a Take-Profit Condition & a Stop-Loss Condition. Note that the Take-Profit condition will only work if the position is in profit, regardless of if it's triggered or not. The same applies for the Stop-Loss condition, meaning that it will only work if the position is in loss.
You can also set a Fixed TP & Fixed SL based on the price movement after the position is entered. You have options like "Price", "Ticks", "%", or "Average True Range". For example, you can set a Fixed TP like "5%", and the position will be entered once it moves 5% up in a long position.
Trailing Stop
For the Fixed SL, you also have a "Trailing" stop option, which you can set it's activation level as well. The Trailing stop activation level and it's value are expressed in ticks. Check this scenerio for an example :
We have a ticker with a tick value of $1. Our Trailing Stop is set to 10 ticks and activation level is set to 30 ticks.
We buy 1 contract when the price is $100.
When the price becomes $110, we are in $10 (10 ticks) profit and the trailing stop is now activated.
The current price our stop's on is $110 - $30 (30 ticks), which is the level of $80.
The trailing stop will only move if the price moves up the highest high the price has been after we entered the position.
Let's suppose that price moves up $40 right after our trailing stop is activated. The price will now be $150, and our trailing stop will sit on $150 - $30 (30 ticks) = $120.
If the price is down the $120 level, our stop loss will be triggered.
There is also a "Hard SL" option designed for a backup stop-loss when trailing stops are enabled. You can enable & set this option and if the price goes down before our trailing stop even activates, the position will be exited.
You can also move stop-loss to the break-even (entry price of the position) after a certain profit is achieved using the last setting of the exit conditions. Note that for this to work, you will need to have a Fixed SL set-up.
➕ OTHER EXIT FEATURES
1. Move Stop Loss to Breakeven
This setting allows the strategy to automatically move the SL to Breakeven (BE) when the position is in profit by a certain amount. Users can choose between the following:
Price: This method moves the SL to BE when price reaches a specified level.
Ticks: This method moves the SL to BE when price moves a specified number of ticks.
Percentage (%): This method moves the SL to BE when price moves a specified percentage.
ATR: This method moves the SL to BE when price moves a specified multiple of the Average True Range (ATR).
Example Entry Scenario
To give an example , check this scenario; out conditions are :
LONG CONDITIONS
Bullish Order Block Detection, Step 1
Bullish CHoCH Detection, Step 2
Bullish Volume Imbalance Detection, Step 2
Bullish IFVG Retest, Step 3
First, the strategy needs to detect a Bullish Order Block in order to start working.
After it's detected, now it's looking for either a CHoCH, or a Volume Imbalance to proceed to the next step, the reason for this is that they both have the same step number.
After one of them is detected, the strategy will consistently check all IFVGs for a retest. If the retest occurs, a long position will be entered.
⏰ ALERTS
This indicator uses TradingView's strategy alert system. All entries and exits will be sent as an alert if configured. It's possible to further customize these alerts to your liking. For more information check TradingView's strategy alert customization page: www.tradingview.com
⚙️ SETTINGS
1. Backtesting Settings
Pyramiding: Controls the number of simultaneous trades allowed in the strategy. This setting must have the same value that is entered on the script's properties tab on the settings pane.
Max Distance to Last Bar: Determines the depth of historical data used to prevent memory overload.
Enable Custom Backtesting Period: Restricts backtesting to a specific date range.
Start & End Time Configuration: Define precise start and end dates for historical analysis.
2. Fair Value Gaps Settings
Zone Invalidation: Select between "Wick" and "Close" invalidation.
Filtering: Choose between "Average Range" and "Volume Threshold".
FVG Sensitivity: Ranges from Extreme to Low to detect FVGs with varying strictness.
Allow Gaps: Enables analysis on tickers that have different open-close price gaps.
3. Inversion Fair Value Gaps Settings
Zone Invalidation: Choose between "Wick" and "Close".
4. Order Block Settings
Swing Length: Adjusts the minimum number of bars required for OB formation.
Zone Invalidation Method: Select between "Wick" and "Close".
5. Breaker Block Settings
Zone Invalidation: Set invalidation method as "Wick" or "Close".
6. Liquidity Grabs Settings
Pivot Length: Adjusts the number of bars used to detect liquidity grabs.
Wick-Body Ratio: Defines the proportion of wick-to-body size for liquidity grab detection.
7. Multi-Timeframe Analysis
Enable Up to Three Timeframes: Select and analyze trades across multiple timeframes.
8. Market Structures
Swing Length: Defines the number of bars required for structure shifts.
Includes BOS, CHoCH, CHoCH+ Detection.
9. Equal Highs & Lows
ATR Multiplier: Defines the sensitivity of equal highs/lows detection.
10. Volume Imbalances
Gap Size Sensitivity: Ranges from "Ultra" to "Low".
Disable Overnight Gaps: Filters out volume imbalances occurring due to overnight gaps.
11. Entry Conditions for Long & Short Trades
Multiple Conditions (1-6): Configure up to six independent conditions per trade direction.
Condition Types: Options include Detection, Retest, Retracement, and Break.
Timeframe Specification: Choose between "Any Timeframe", "Timeframe 1", "Timeframe 2", or "Timeframe 3".
Trade Execution Filters: Restrict trades within specific trading sessions.
12. Exit Conditions for Long & Short Trades
Exit on Opposite Signal: Automatically exit trades upon opposite trade conditions.
Exit on Session End: Closes all positions at the end of the trading session.
Multiple Take-Profit (TP) and Stop-Loss (SL) Configurations:
TP/SL based on % move, ATR, Ticks, or Fixed Price.
Hard SL option for additional risk control.
Move SL to BE (Break Even) after a certain profit threshold.

3Commas DCA Bot Strategy v1.0Introduction
The strategy attempts to implement a majority all of the settings found on the 3Commas DCA Bot setting page that can be implemented within a TradingView indicator. Specifically, it will implement the "Open new trade ASAP" and "Trading View Custom Signal" deal start conditions. In this way, you can leverage the power of TradingView's backtester to model your settings and analysis past performance as well as leverage TradingView's alert notification subsystem to send Deal Start and Close signals to 3Commas using almost any of the thousands of scripts found in the Public Library (see "What does it do and how does it do it?" section below for more information on how to do this using the RSI indicator as an example).
How is it original and useful?
This strategy is unique in that it's the only one (as of the initial publications) that can handle 28 out of 32 bot settings (88% coverage) that are found on the 3Commas bot settings page. In addition, because it is a TradingView script, you will benefit from the following:
Model your bot's configuration using the backtester on any timeframe and evaluate its performance using the chart's history.
View a table of detailed statistics pertaining to deals started and completed, win/loss rates, daily P&L, true max drawdown, and detailed statistics on bars in deal along with safety orders filled.
View a table of "Used amount for each step" as presented in 3Commas as well.
Ability to link to almost any TradingView chart indicator that provides a single data point for buy/sell signals.
Make use of the 3Commas TA Start Conditions indicator to emulate the 3Commas built-in indicators for further performance evaluation with the backtester.
How does it compare to other scripts in the Public Library?
This strategy offers a very detailed, comprehensive settings and maybe the only one (as of the initial publication) that can handle 28 out of the 32 bot settings that are found on the 3Commas bot settings page (that can be handled within TradingView, because some cannot be modeled due to chart and language constraints). Specifically, the following 3Commas bot settings and inputs are addressed with asterisks denoting specific limitation due to TradingView's platform architecture and/or constraints:
Main settings
✅ Name
❌ Exchange* (Not handled since it is inherited from chart)
⚠ Bot type* (Only Single-pair because you simply apply the indicator to as many pairs you desire in separate charts to simulate a Multi-pair setting)
Pairs
❌ Pairs* (Not handled since it is inheriting the symbol from the chart)
Strategy
✅ Strategy
❌ Profit currency* (Not handled since there is no equivalence in TradingView)
✅ Base order size / unit
✅ Safety order size / unit
✅ Start order type
Deal start condition
⚠ TradingView* (You can modify the "Technical Rating" indicator by TradingView to output a signal yourself like @TheTradingParrot has done in the TV signal for DCA backtest script)
⚠ QFL* (See Quickfingers Luc's Base Breaking Strategy v2.5 - 3Commas Edition for an alternative)
❌ Manually/API* (Not handled since there is no equivalence in TradingView)
✅ Trading View custom signal
✅ Open new trade asap
Take profit
✅ Take profit (%)
✅ Take profit type
✅ Trailing
⚠ Trailing deviation* (modified to handle TradingView's broker emulator properly)
Stop loss
✅ Stop Loss (%)
✅ Stop Loss action
⚠ Stop Loss timeout* (modified to use "bars" as the unit of measure)
Safety orders
✅ Max safety trades count (a total of 100 safety orders are supported!)
⚠ Max active safety trades count* (Not handled since there is no equivalence in TradingView)
✅ Price deviation to open safety orders (% from initial order)
✅ Safety order volume scale
✅ Safety order step scale
Advanced settings
✅ Don't start deal(s) if the daily volume is less than
✅ Minimum price to open deal
✅ Maximum price to open deal
⚠ Deal start delay (QFL and standard TV signals only)* (modified to use "bars" as the unit of measure)
✅ Cooldown between deals
✅ Open deals & stop
Close deal after timeout
⚠ The time after which, deal will be closed automatically* (modified to use "bars" as the unit of measure)
In addition to the above inputs, the script will also support the same output data points that are found on the bot settings page, which are:
Assistant
✅ Balance
✅ Max amount for bot usage (Based on current rate)
✅ Max safety order price deviation
✅ % of available balance to be used by the bot
Table (Used amount for each step)
✅ Order No.
✅ Deviation %
✅ Order Size (Base currency)
✅ Order Volume (Quote currency)
✅ Price
✅ Average price
✅ Required price
✅ Required change
✅ Total Size (Base currency)
✅ Total Volume (Quote currency)
What does it do and how does it do it?
When applied to the chart for the first time, the default settings will work to execute the "Open new trade asap" deal start condition using a take profit of 4%, a base order size of 1.335% of equity (initial capital + net profit), a safety order size of 2.003% of equity (initial capital + net profit), a safety order volume scale of 1.5, a safety order step scale of 1.21, and a max safety trades count of 8. With these settings, as you scroll through the chart's history you should see price action crossing the DCA layers (denoted with blue triangles), and a green take-profit price line will render (with green triangle denoting the crossings). Lastly, in the upper-right corner of the chart the table of DCA statistics will render showing you all the gathered data that took place since the chart's starting history until the current time.
Using the "TV Custom Signal" section will allow you to "link" other chart indicators to supply "Start" and "Close" signals for the script. For example, here's how you can use the standard RSI indicator to generate an entry signal:
1) Add the stock RSI indicator and configure it to your desire.
2) Select the "RSI" indicator in the "Chart/Indicator Data Point" input.
3) Select "Chart/Indicator Data Point" in the "Start Deal When" input.
4) Select "Less Than" in the "Is" input.
5) Select "Custom Value(s)" in the "The Value Of" input.
6) Enter "25" in the "Custom Value 1 (Single or Lower Bound)" input.
7) Select "Trading View Custom Signal" in the "Open new trade" input (in the DEAL START CONDITION section).
8) Lastly, check the checkbox with a horizontal straight line above the "Start Deal When" input.
This means that the indicator will start a deal when the "RSI indicator" is "Less Than" the value of "25".
Strategy Results
The default settings are designed to ensure that the indicator will render chart elements when first loaded as well as to allow the backtester to gather order executions and display performance summary. The chart above is is using $10,000 initial capital, a commission rate of 0.1% for both entries and exits, and a 1 tick slippage setting. It is also using 3.22581% of the equity for the Base Order Size, 6.45161% of equity for the first Safety Order Size. The Maximum Safety Trade Count is 4 with a Safety Order Volume Scale of 2, a Safety Order Step Scale of 1.53, Price Deviation To Option Safety Orders at 5.3, and a take profit of 4.5% with Trailing turned on at a deviation of 1.5%. All other settings are defaults.
It is recommended that the indicator be "tuned" for your specific market in order to best implement the strategy and obtain better desirable results. You do so by using the backtester and statistics table and observe the output values and learn how the indicator is performing in the chart history. Using this information, you can adjust the settings accordingly until you find the settings acceptable to your trading goals and risk tolerance.
Always keep in mind that past performance may not be indicative of future results. Settings that seem favorable for one market may be found to be disastrous in another. Therefore, do take the time needed to understand how the settings will behave with the given chart symbol.
Enjoy! 😊👍
How to obtain access to the script?
You have two choices:
Use the "Website" link below to obtain access to this indicator, or
Send us a private message (PM) in TradingView itself.

Great Expectations [LucF]Great Expectations helps traders answer the question: What is possible? It is a powerful question, yet exploration of the unknown always entails risk. A more complete set of questions better suited to traders could be:
What opportunity exists from any given point on a chart?
What portion of this opportunity can be realistically captured?
What risk will be incurred in trying to do so, and how long will it take?
Great Expectations is the result of an exploration of these questions. It is a trade simulator that generates visual and quantitative information to help strategy modelers visually identify and analyse areas of optimal expectation on charts, whether they are designing automated or discretionary strategies.
WARNING: Great Expectations is NOT an indicator that helps determine the current state of a market. It works by looking at points in the past from which the future is already known. It uses one definition of repainting extensively (i.e. it goes back in the past to print information that could not have been know at the time). Repainting understood that way is in fact almost all the indicator does! —albeit for what I hope is a noble cause. The indicator is of no use whatsoever in analyzing markets in real-time. If you do not understand what it does, please stay away!
This is an indicator—not a strategy that uses TradingView’s backtesting engine. It works by simulating trades, not unlike a backtest, but with the crucial difference that it assumes a trade (either long or short) is entered on all bars in the historic sample. It walks forward from each bar and determines possible outcomes, gathering individual trade statistics that in turn generate precious global statistics from all outcomes tested on the chart.
Great Expectations provides numbers summarizing trade results on all simulations run from the chart. Those numbers cannot be compared to backtest-produced numbers since all non-filtered bars are examined, even if an entry was taken on the bar immediately preceding the current one, which never happens in a backtest. This peculiarity does NOT invalidate Great Expectations calculations; it just entails that results be considered under a different light. Provided they are evaluated within the indicator’s context, they can be useful—sometimes even more than backtesting results, e.g. in evaluating the impact of parameter-fitting or variations in entry, exit or filtering strats.
Traders and strategy modelers are creatures of hope often suffering from blurred vision; my hope is that Great Expectations will help them appraise the validity of their setup and strat intuitions in a realistic fashion, preventing confirmation bias from obstructing perspective—and great expectations from turning into financial great deceptions.
USE CASES
You’ve identified what looks like a promising setup on other indicators. You load Great Expectations on the chart and evaluate if its high-expectation areas match locations where your setup’s conditions occur. Unless today is your lucky day, chances are the indicator will help you realize your setup is not as promising as you had hoped.
You want to get a rough estimate of the optimal trade duration for a chart and you don’t mind using the entry and exit strategies provided with the indicator. You use the trade length readouts of the indicator.
You’re experimenting with a new stop strategy and want to know how long it will keep you in trades, on average. You integrate your stop strategy in the indicator’s code and look at the average trade length it produces and the TST ratio to evaluate its performance.
You have put together your own entry and exit criteria and are looking for a filter that will help you improve backtesting results. You visually ascertain the suitability of your filter by looking at its results on the charts with great Expectations, to see if your filter is choosing its areas correctly.
You have a strategy that shows backtested trades on your chart. Great Expectations can help you evaluate how well your strategy is benefitting from high-opportunity areas while avoiding poor expectation spots.
You want more complete statistics on your set of strategies than what backtesting will provide. You use Great Expectations, knowing that it tests all bars in the sample that correspond to your criteria, as opposed to backtesting results which are limited to a subset of all possible entries.
You want to fool your friends into thinking you’ve designed the holy grail of indicators, something that identifies optimal opportunities on any chart; you show them the P&L cloud.
FEATURES
For one trade
At any given point on the chart, assuming a trade is entered there, Great Expectations shows you information specific to that trade simulation both on the chart and in the Data Window.
The chart can display:
the P & L Cloud which shows whether the trade ended profitably or not, and by how much,
the Opportunity & Risk Cloud which the maximum opportunity and risk the simulation encountered. When superimposed over the P & L cloud, you will see what I call the managed opportunity and risk, i.e the portion of maximum opportunity that was captured and the portion of the maximum risk that was incurred,
the target and if it was reached,
a background that uses a gradient to show different levels of trade length, P&L or how frequently the target was reached during simulation.
The Data Window displays more than 40 values on individual trades and global results. For any given trade you will know:
Entry/Exit levels, including slippage impact,
It’s outcome and duration,
P/L achieved,
The fraction of the maximum opportunity/risk managed by the trade.
For all trades
After going through all the possible trades on the chart, the indicator will provide you with a rare view of all outcomes expressed with the P&L cloud, which allows us to instantly see the most/least profitable areas of a chart using trade data as support, while also showing its relationship with the opportunity/risk encountered during the simulation. The difference between the two clouds is the managed opportunity and risk.
The Data Window will present you with numbers which we will go through later. Some of them are: average stop size, P/L, win rate, % opportunity managed, trade lengths for different types of trade outcomes and the TST (Target:Stop Travel) ratio.
Let’s see Great Expectations in action… and remember to open your Data Window!
INPUTS
Trade direction : You must first choose if you wish to look at long or short trades. Because of the way the indicator works and the amount of visual information on the chart, it is only practical to look at one type of trades at a time. The default is Longs.
Maximum trade Length (MaxL) : This is the maximum walk forward distance the simulator will go in analyzing outcomes from any given point in the past. It also determines the size of the dead zone among the chart’s last bars. A red background line identifies the beginning of the dead zone for which not enough bars have elapsed to analyze outcomes for the maximum trade length defined. If an ATR-based entry stop is used, that length is added to the wait time before beginning simulations, so that the first entry starts with a clean ATR value. On a sample of around 16000 bars, my tests show that the indicator runs into server errors at lengths of around 290, i.e. having completed ~4,6M simulation loop iterations. That is way too high a length anyways; 100 will usually be amply enough to ring out all the possibilities out of a simulation, and on shorter time frames, 30 can be enough. While making it unduly small will prevent simulations of expressing the market’s potential, the less you use, the faster the indicator will run. The default is 40.
Unrealized P&L base at End of Trade (EOT) : When a simulation ends and the trade is still open, we calculate unrealized P&L from an exit order executed from either the last in-trade stop on the previous bar, or the close of the last bar. You can readily see the impact of this selection on the chart, with the P&L cloud. The default is on the close.
Display : The check box besides the title does nothing.
Show target : Shows a green line displaying the trade’s target expressed as a multiple of X, i.e. the amplitude of the entry stop. I call this value “X” and use it as a unit to express profit and loss on a trade (some call it “R”). The line is highlighted for trades where the close reached the target during the trade, whether the trade ended in profit or loss. This is also where you specify the multiple of X you wish to use in calculating targets. The multiple is used even if targets are not displayed.
Show P&L Cloud : The cloud allows traders to see right away the profitable areas of the chart. The only line printed with the cloud is the “end of trade line” (EOT). The EOT line is the only way one can see the level where a trade ended on the chart (in the Data Window you can see it as the “Exit Fill” value). The EOT level for the trade determines if the trade ended in a profit or a loss. Its value represents one of the following:
- fill from order executed at close of bar where stop is breached during trade (which produces “Realized P/L”),
- simulation of a fill pseudo-fill at the user-defined EOT level (last close or stop level) if the trade runs its course through MaxL bars without getting stopped (producing Unrealized P/L).
The EOT line and the cloud fill print in green when the trade’s outcome is profitable and in red when it is not. If the trade was closed after breaching the stop, the line appears brighter.
Show Opportunity&Risk Cloud : Displays the maximum opportunity/risk that was present during the trade, i.e. the maximum and minimum prices reached.
Background Color Scheme : Allows you to choose between 3 different color schemes for the background gradients, to accommodate different types of chart background/candles. Select “None” if you don’t want a background.
Background source : Determines what value will be used to generate the different intensities of the gradient. You can choose trade length (brighter is shorter), Trade P&L (brighter is higher) or the number of times the target was reached during simulation (brighter is higher). The default is Trade Length.
Entry strat : The check box besides the title does nothing. The default strat is All bars, meaning a trade will be simulated from all bars not excluded by the filters where a MaxL bars future exists. For fun, I’ve included a pseudo-random entry strat (an indirect way of changing the seed is to vary the starting date of the simulation).
Show Filter State : Displays areas where the combination of filters you have selected are allowing entries. Filtering occurs as per your selection(s), whether the state is displayed or not. The effect of multiple selections is additive. The filters are:
1. Bar direction: Longs will only be entered if close>open and vice versa.
2. Rising Volume: Applies to both long and shorts.
3. Rising/falling MA of the length you choose over the number of bars you choose.
4. Custom indicator: You can feed your own filtering signal through this from another indicator. It must produce a signal of 1 to allow long entries and 0 to allow shorts.
Show Entry Stops :
1. Multiple of user-defined length ATR.
2. Fixed percentage.
3. Fixed value.
All entry stops are calculated using the entry fill price as a reference. The fill price is calculated from the current bar’s open, to which slippage is added if configured. This simulates the case where the strategy issued the entry signal on the previous bar for it to be executed at the next bar’s open.
The entry stop remains active until the in-trade stop becomes the more aggressive of the two stops. From then on, the entry stop will be ignored, unless a bar close breaches the in-trade stop, in which case the stop will be reset with a new entry stop and the process repeats.
Show In-trade stops : Displays in bright red the selected in-trade stop (be sure to read the note in this section about them).
1. ATR multiple: added/subtracted from the average of the two previous bars minimum/maximum of open/close.
2. A trailing stop with a deviation expressed as a multiple of entry stop (X).
3. A fixed percentage trailing stop.
Trailing stops deviations are measured from the highest/lowest high/low reached during the trade.
Note: There is a twist with the in-trade stops. It’s that for any given bar, its in-trade stop can hold multiple values, as each successive pass of the advancing simulation loops goes over it from a different entry points. What is printed is the stop from the loop that ended on that bar, which may have nothing to do with other instances of the trade’s in-trade stop for the same bar when visited from other starting points in previous simulations. There is just no practical way to print all stop values that were used for any given bar. While the printed entry stops are the actual ones used on each bar, the in-trade stops shown are merely the last instance used among many.
Include Slippage : if checked, slippage will be added/subtracted from order price to yield the fill price. Slippage is in percentage. If you choose to include slippage in the simulations, remember to adjust it by considering the liquidity of the markets and the time frame you’ll be analyzing.
Include Fees : if checked, fees will be subtracted/added to both realized an unrealized trade profits/losses. Fees are in percentage. The default fees work well for crypto markets but will need adjusting for others—especially in Forex. Remember to modify them accordingly as they can have a major impact on results. Both fees and slippage are included to remind us of their importance, even if the global numbers produced by the indicator are not representative of a real trading scenario composed of sequential trades.
Date Range filtering : the usual. Just note that the checkbox has to be selected for date filtering to activate.
DATA WINDOW
Most of the information produced by this indicator is made available in the Data Window, which you bring up by using the icon below the Watchlist and Alerts buttons at the right of the TV UI. Here’s what’s there.
Some of the information presented in the Data Window is standard trade data; other values are not so standard; e. g. the notions of managed opportunity and risk and Target:Stop Travel ratio. The interplay between all the values provided by Great Expectations is inherently complex, even for a static set of entry/filter/exit strats. During the constant updating which the habitual process of progressive refinement in building strategies that is the lot of strategy modelers entails, another level of complexity is no doubt added to the analysis of this indicator’s values. While I don’t want to sound like Wolfram presenting A New Kind of Science , I do believe that if you are a serious strategy modeler and spend the time required to get used to using all the information this indicator makes available, you may find it useful.
Trade Information
Entry Order : This is the open of the bar where simulation starts. We suppose that an entry signal was generated at the previous bar.
Entry Fill (including slip.) : The actual entry price, including slippage. This is the base price from which other values will be calculated.
Exit Order : When a stop is breached, an exit order is executed from the close of the bar that breached the stop. While there is no “In-trade stop” value included in the Data Window (other than the End of trade Stop previously discussed), this “Exit Order” value is how we can know the level where the trade was stopped during the simulation. The “Trade Length” value will then show the bar where the stop was breached.
Exit Fill (including slip.) : When the exit order is simulated, slippage is added to the order level to create the fill.
Chart: Target : This is the target calculated at the beginning of the simulation. This value also appear on the chart in teal. It is controlled by the multiple of X defined under the “Show Target” checkbox in the Inputs.
Chart: Entry Stop : This value also appears on the chart (the red dots under points where a trade was simulated). Its value is controlled by the Entry Strat chosen in the Inputs.
X (% Fill, including Fees) and X (currency) : This is the stop’s amplitude (Entry Fill – Entry Stop) + Fees. It represents the risk incurred upon entry and will be used to express P&L. We will show R expressed in both a percentage of the Entry Fill level (this value), and currency (the next value). This value represents the risk in the risk:reward ratio and is considered to be a unit of 1 so that RR can be expressed as a single value (i.e. “2” actually meaning “1:2”).
Trade Length : If trade was stopped, it’s the number of bars elapsed until then. The trade is then considered “Closed”. If the trade ends without being stopped (there is no profit-taking strat implemented, so the stop is the only exit strat), then the trade is “Open”, the length is MaxL and it will show in orange. Otherwise the value will print in green/red to reflect if the trade is winning/losing.
P&L (X) : The P&L of the trade, expressed as a multiple of X, which takes into account fees paid at entry and exit. Given our default target setting at 2 units of “X”, a trade that closes at its target will have produced a P&L of +2.0, i.e. twice the value of X (not counting fees paid at exit ). A trade that gets stopped late 50% further that the entry stop’s level will produce a P&L of -1.5X.
P&L (currency, including Fees) : same value as above, but expressed in currency.
Target first reached at bar : If price closed above the target during the trade (even if it occurs after the trade was stopped), this will show when. This value will be used in calculating our TST ratio.
Times Stop/Target reached in sim. : Includes all occurrences during the complete simulation loop.
Opportunity (X) : The highest/lowest price reached during a simulation, i.e. the maximum opportunity encountered, whether the trade was previously stopped or not, expressed as a multiple of X.
Risk (X) : The lowest/highest price reached during a simulation, i.e. the maximum risk encountered, whether the trade was previously stopped or not, expressed as a multiple of X.
Risk:Opportunity : The greater this ratio, the greater Opportunity is, compared to Risk.
Managed Opportunity (%) : The portion of Opportunity that was captured by the highest/low stop position, even if it occurred after a previous stop closed the trade.
Managed Risk (%) : The portion of risk that was protected by the lowest/highest stop position, even if it occurred after a previous stop closed the trade. When this value is greater than 100%, it means the trade’s stop is protecting more than the maximum risk, which is frequent. You will, however, never see close to those values for the Managed Opportunity value, since the stop would have to be higher than the Maximum opportunity. It is much easier to alleviate the risk than it is to lock in profits.
Managed Risk:Opportunity : The ratio of the two preceding values.
Managed Opp. vs. Risk : The Managed Opportunity minus the Managed Risk. When it is negative, which is most often is, it means your strat is protecting a greater portion of the risk than it captures opportunity.
Global Numbers
Win Rate(%) : Percentage of winning trades over all entries. Open trades are considered winning if their last stop/close (as per user selection) locks in profits.
Avg X%, Avg X (currency) : Averages of previously described values:.
Avg Profitability/Trade (APPT) : This measures expectation using: Average Profitability Per Trade = (Probability of Win × Average Win) − (Probability of Loss × Average Loss) . It quantifies the average expectation/trade, which RR alone can’t do, as the probabilities of each outcome (win/lose) must also be used to calculate expectancy. The APPT combine the RR with the win rate to yield the true expectancy of a strategy. In my usual way of expressing risk with X, APPT is the equivalent of the average P&L per trade expressed in X. An APPT of -1.5 means that we lose on average 1.5X/trade.
Equity (X), Equity (currency) : The cumulative result of all trade outcomes, expressed as a multiple of X. Multiplied by the Average X in currency, this yields the Equity in currency.
Risk:Opportunity, Managed Risk:Opportunity, Managed Opp. vs. Risk : The global values of the ones previously described.
Avg Trade Length (TL) : One of the most important values derived by going through all the simulations. Again, it is composed of either the length of stopped trades, or MaxL when the trade isn’t stopped (open). This value can help systems modelers shape the characteristics of the components they use to build their strategies.
Avg Closed Win TL and Avg Closed Lose TL : The average lengths of winning/losing trades that were stopped.
Target reached? Avg bars to Stop and Target reached? Avg bars to Target : For the trades where the target was reached at some point in the simulation, the number of bars to the first point where the stop was breached and where the target was reached, respectively. These two values are used to calculate the next value.
TST (Target:Stop Travel Ratio) : This tracks the ratio between the two preceding values (Bars to first stop/Bars to first target), but only for trades where the target was reached somewhere in the loop. A ratio of 2 means targets are reached twice as fast as stops.
The next values of this section are counts or percentages and are self-explanatory.
Chart Plots
Contains chart plots of values already describes.
NOTES
Optimization/Overfitting: There is a fine line between optimizing and overfitting. Tools like this indicator can lead unsuspecting modelers down a path of overfitting that often turns strategies into over-specialized beasts that do not perform elegantly when confronted to the real-world. Proven testing strategies like walk forward analysis will go a long way in helping modelers alleviate this risk.
Input tuning: Because the results generated by the indicator will vary with the parameters used in the active entry, filtering and exit strats, it’s important to realize that although it may be fun at first, just slapping the default settings on a chart and time frame will not yield optimal nor reliable results. While using ATR as often as possible (as I do in this indicator) is a good way to make strat parametrization adaptable, it is not a foolproof solution.
There is no data for the last MaxL bars of the chart, since not enough trade future has elapsed to run a simulation from MaxL bars back.
Modifying the code: I have tried to structure the code modularly, even if that entails a larger code base, so that you can adapt it to your needs. I’ve included a few token components in each of the placeholders designed for entry strategies, filters, entry stops and in-trade stops. This will hopefully make it easier to add your own. In the same spirit, I have also commented liberally.
You will find in the code many instances of standard trade management tasks that can be lifted to code TV strategies where, as I do in mine, you manage everything yourself and don’t rely on built-in Pine strategy functions to act on your trades.
Enjoy!
THANKS
To @scarf who showed me how plotchar() could be used to plot values without ruining scale.
To @glaz for the suggestion to include a Chandelier stop strat; I will.
To @simpelyfe for the idea of using an indicator input for the filters (if some day TV lets us use more than one, it will be useful in other modules of the indicator).
To @RicardoSantos for the random generator used in the random entry strat.
To all scripters publishing open source on TradingView; their code is the best way to learn.
To my trading buddies Irving and Bruno; who showed me way back how pro traders get it done.

Multi Channel GRID & DCA LTF [trade_lexx]Multi Channel GRID & DCA LTF
Usage Guide
Part 1: The concept and general possibilities of the "Multi Channel GRID & DCA LTF" strategy
Introduction
Welcome to the guide to "Multi Channel GRID & DCA LTF", a powerful and versatile automated trading strategy for the TradingView platform. This tool was developed for traders who are looking for flexibility, control and a high degree of adaptability to various market conditions.
The strategy is based on a hybrid approach that combines two popular and time-tested techniques.:
1. GRID (grid trading): The classic method of averaging a position is by placing a grid of limit orders.
2. DCA (Dollar Cost averaging): Smart position averaging based on signals from external indicators.
However, "Multi Channel GRID & DCA LTF" goes far beyond the simple combination of these two techniques. The strategy includes a number of unique and innovative features, such as cascading MultiGRID grids for dealing with extreme volatility, Channel Mode range trading mode for profiting from sideways movement, and Low Time Frame analysis (LTF) to achieve surgical accuracy in backtesting. Deep customization options for risk management, capital, take profits, and stop losses allow you to configure a strategy for almost any trading style, asset, and timeframe.
The basic idea: How does it work?
Let's take a detailed look at each of the key concepts embedded in the logic of the strategy.
1. GRID — Automatic placement of buy and sell orders at certain price intervals.
This is a fundamental mode of operation. Its main goal is to systematically improve the average entry price for a position if the market is going against you.
* The principle of operation: After opening the base (first) order (`BO`), the strategy automatically places a series of pending limit orders (here they are called "safety orders" or "SO") at certain price intervals. For a long position, orders are placed below the entry price, and for a short position, orders are placed higher.
* Target: When the price moves against an open position, it consistently hits and executes safety orders. Each such execution adds additional volume to the position at a more favorable price, thereby shifting the overall average entry price (`position_avg_price') closer to the current market price. This means that a much smaller corrective movement will be required to gain ground.
* Flexibility: You have full control over the geometry of the grid: the number of safety orders, the percentage distance between them (`SO Step`), and you can even set a coefficient that will increase this step for each subsequent order (`SO Multiplier`), creating an expanding grid.
2. DCA (Signal Averaging) — Smart Averaging
This mode adds an additional layer of analysis to the averaging process. Instead of just buying/selling at the set price levels, the strategy waits for a confirmation signal.
* Working principle: You can connect any external indicator (for example, RSI, CCI, or even your own complex signal system) to the strategy, which outputs numerical values. As standard, 1 is used for a long signal, and -1 is used for a short signal. The strategy will place the next averaging order only at the moment when it receives the appropriate signal.
* Goal: To average a position not just during a fall (or a rise for a short), but at the moments that your main trading system considers the most favorable for this. This allows you to avoid "catching falling knives" and enter only if there are good reasons.
3. Hybrid Mode (GRID+DCA) is the best of the previous two modes
This mode is designed for maximum filtering and control. It requires two conditions to be fulfilled simultaneously.
* Working principle: The safety order will be executed only if the price has reached the calculated grid level and a confirmation signal has been received from your external indicator. If a confirmation signal is received from an external indicator, the next calculated grid level activates the limit order.
* Goal: To create the most reliable averaging system that protects against premature entries and requires double confirmation (both by price and indicator) before increasing the position size.
4. MultiGRID — Adaptation to extreme volatility
This is one of the most powerful and unique features of a strategy designed to survive and make a profit in the face of strong, protracted trends or "black swans".
* The problem it solves: The usual grid of orders has a limited depth. If the price goes beyond the last safety order, the strategy loses the opportunity to average and becomes vulnerable.
* The principle of operation: The MultiGRID function allows you to create "cascades" — several grids following one another. When all the orders of the first grid are executed, the strategy does not stop. Instead, she can activate the second, third (and so on) a grid of orders. The new grid can be activated by one of two triggers:
1. Offset: The new grid is activated when the price passes another set percentage deviation from the last executed order.
2. Signal: The new grid is activated when a signal is received from an external indicator.
* Goal: To significantly expand the working range of the strategy. This allows it to adapt to strong market movements that would "break" the usual grid, and continue to effectively average a position at a much greater depth of decline or growth.
5. Channel Mode — Trading in the range
This feature turns a standard averaging strategy into a machine for "farming" profits within a price channel that is formed during a sideways market movement.
* The problem it solves: In the standard grid strategy, after partially closing a take profit position, the volume of this part "leaves" the trade until the deal is fully closed. You are missing the opportunity to reuse this capital.
* Operating principle: When Channel Mode is enabled, the following happens. Suppose the price went against you, executed several safety orders, and then turned around and reached one of the partial take profits. At this point, the strategy is:
1. Fixes the profit, as it should be.
2. Instantly places a new limit order to buy (or sell for a short) at exactly the same price level where the last triggered safety order was executed. The volume of this order is equal to the volume of the part that was just closed for take profit.
3. If the price goes down again and executes this "repeat" order, the strategy immediately sets a corresponding take profit for it at the level where the previous profit was taken.
* Goal: To create a continuous buy-sell cycle within the local range (channel). The lower limit of the channel is the price of the last averaging, and the upper limit is the price of a partial take profit. This allows you to repeatedly profit from sideways price fluctuations, without waiting for the full closure of the main, large transaction.
6. LTF (Lower Timeframe Analysis) — Surgical precision of backtesting
This feature is critically important for obtaining reliable results during historical testing (backtesting) of grid strategies.
* The problem it solves: The standard testing mechanism in TradingView has a serious limitation. Working, for example, on a 4-hour chart, he sees only 4 candle points: Open, High, Low and Close. He does not know in what order the price moved within these 4 hours. He could have touched High first and then Low, or vice versa. For grid strategies, this is fatal — the engine can show that a take profit has been executed, although in reality the price first went down, collected the entire grid of orders and only then turned around.
* How it works: When you turn on the LTF mode, the strategy for each candle on your main chart (for example, 4H) requests and analyzes all candles from the lower timeframe you specified (for example, 1-minute). Then it virtually trades the entire price path for these minute candles, executing orders, take profits and stop losses in the sequence in which they would occur in reality. It works in the single take profit mode of the Grid strategy.
* Goal: To provide the most realistic and reliable backtest that reflects the real dynamics of the market. This allows you to avoid false expectations and accurately assess the potential performance of the strategy.
// ------------------------
Part 2: Detailed description of the strategy settings
This section is your main guide to all the switches and options available in the strategy. Understanding each setting is the key to unlocking the full potential of this powerful tool.
1. 🛡️ Risk Management 🛡️
This group contains fundamental parameters that determine the basic logic of risk management and the geometry of grid orders.
* Strategy type: Determines the direction of transactions.
* Long: The strategy will only open long positions (buy).
* Short: The strategy will only open short positions (sell).
* Both: The strategy will work both ways, opening long or short depending on the incoming signal.
* SO Count: Sets the maximum number of Safety (averaging) Orders (SO) that the strategy will place within the same grid. If you have MultiGRID enabled, this number applies to each individual grid.
* SO Step (%): This is the base percentage deviation from the entry price at which the first safety order will be placed. For example, at a value of 0.5, the first SO in a long trade will be placed 0.5% lower than the opening price of the base order.
* SO Multiplier: A coefficient that exponentially increases the step for each subsequent safety order. This allows you to create an expanding grid where averaging orders are placed further and further apart, which is effective with strong and accelerating price movements.
* *The step formula for the nth order*: Step(N) = (SO Step) * (SO Multiplier ^(N-1)).
* If the value is 1, all steps will be the same.
* With a value of 1.6, the step of the second SO will be 1.6 times larger than the first, the step of the third will be 1.6 times larger than the second, and so on.
* 1️⃣ TP/SL: These are simplified settings for quick configuration. They allow you to turn on/off the main take profit and stop loss and set basic percentage values for them. More detailed settings for these parameters can be found in the relevant sections below.
// ------------------------
2. 💰 Money Management 💰
Everything related to position size, leverage, and capital is configured here.
* Volume BO (Base Order): Determines the size of the trade's opening order.
* Volume BO: A fixed amount in the quote currency (for example, in USDT).
* USDT (check mark): Manages the information in the comments to the orders. If enabled, the volume of orders in USDT will be displayed in the comments. This is convenient for visual analysis and for sending the amount of USDT by the placeholder {{strategy.order.comment}} via webhooks when connecting the strategy to the exchange or trading terminals.
* or % of deposit: The amount calculated as a percentage of the available capital of the strategy. The check mark to the right of this field enables this mode. Important: using a percentage activates the effect of compounding (compound interest), as the amount of each new transaction will be automatically recalculated based on the current capital (initial capital + profit/loss). If enabled, the percentage of orders will be displayed in the comments. This is convenient for visual analysis and for sending percentages on the placeholder {{strategy.order.comment}} via webhooks when connecting the strategy to the stock exchange, trading terminals, or creating Copy trading.
* Martingale: The coefficient applied to the volume of orders. It increases the size of each subsequent insurance order compared to the base one.
* Volume formula for the nth SO: Volume SO (N) = (Volume BO) * (Martingale^N).
* With a value of 1.2, the volume of the first SO will be 1.2 times greater than the base, the second — 1.44 times (`1.2 * 1.2`) and so on.
* Leverage: Specify the size of your leverage. This parameter is used exclusively for calculating and displaying the approximate liquidation price. It does not affect the size of positions, but it helps to visually assess the risks.
* Liquidation: Enables or disables the calculation and display of the liquidation line on the chart.
* Margin type: Allows you to select a method for calculating the liquidation price, simulating the logic of exchanges:
* Isolated: The liquidation price is calculated based on the size and leverage of the current open position only.
* Cross: The calculation simulates using the entire available balance to maintain a position. In the strategy, the liquidation price is calculated as the level at which the loss on the current transaction is equal to the current capital.
* Commission (%): Specify the percentage of your exchange's commission per transaction. The correct value of this parameter is crucial for obtaining realistic backtest results.
// ------------------------
3. 🕸️ Grid Management 🕸️
This group is responsible for the logic of safety orders and advanced mechanics such as Channel Mode and MultiGRID.
* SO Type: Defines the logic of placing averaging orders.
* GRID: Classic grid. All safety orders are placed in advance as limit orders.
* DCA: Signal averaging. The strategy is waiting for a signal from an external indicator to place a market averaging order.
* GRID+DCA: Hybrid. The strategy waits for a signal, and if it arrives, places a limit order at the appropriate price level of the grid or executes a market order if the signal has arrived below the limit order level.
* Signal for SO: A data source (indicator) that will be used for signals in DCA and GRID+DCA modes.
* ↔️ Channel Mode: When this option is enabled, the strategy tries to trade in a sideways range. After partially closing a take profit position, it immediately places a limit order for re-entry at the price of the last triggered safety order. This creates a buy-sell cycle within the local channel.
* Best Price Only: This filter adds an additional condition for averaging in DCA and MultiGRID modes (when it operates on a signal). The next averaging order or a new grid will be activated only if the current price is more favorable (lower for long, higher for short) than the price of the previous entry.
* 🧩 MultiGRID ⮕ Enables cascading grid mode.
* Grid Count: The total number of grids that can be activated sequentially.
* Offset: Percentage deviation from the price of the last order of the previous grid. When this margin is reached, the following grid of orders is activated (this mode does not require a signal).
* Or signal: Allows you to use the signal from an external indicator as a trigger to activate the next grid. The checkmark on the right turns on this mode.
// ------------------------
4. 🎯 Entry and Stop 🎯
This group of settings allows you to fine-tune the conditions for starting a new trade and all aspects related to protective stop orders, including the complex mechanics of trailing and managing SL after partial take profits.
* 🎯 Signal: A data source (indicator) that will be used to determine when to enter a trade. The strategy expects a value of 1 for the start of a long trade and -1 for a short trade.
* Min Bars: Sets the minimum number of candles that must pass from the moment of opening the previous trade to the moment of opening the next one. A value of 0 disables this filter. This is a useful tool to prevent overly frequent entries in a "noisy" market.
* Non-stop: If this option is enabled, the strategy ignores the Entry Signal and opens a new trade immediately after closing the previous one (taking into account the Min Bars filter, if it is set). This turns the strategy into a constantly working mechanism that is always on the market.
* 🛑 SL Type: Defines the base price from which the stop loss percentage will be calculated. The stop loss in the first section must be enabled for this block of settings to work.
* From the entry point: SL is always calculated from the opening price of the very first base order. It remains static throughout the entire transaction unless it is moved by other functions.
* From breakeven line: SL is dynamically recalculated and shifted each time a safety order is executed. It always follows the average price of the position, being at a given percentage distance from it.
* From last executed SO: SL is recalculated from the price of the last executed order, whether it is a base or a safety order.
* From last SO: SL is calculated from the price of the most recent possible safety order in the grid. This is usually the most remote and conservative type of SL.
* Trailing SL Type: Defines the algorithm by which the stop loss will move after its activation.
* Standard: Classic trailing. After activation, SL will follow the price at a fixed distance.
* ATR: SL will follow the price at a distance equal to the value of the ATR indicator multiplied by the specified multiplier.
* External Source: SL will follow any selected line of the third-party indicator.
* Period and Multiplier: Common parameters for all types of trailing.
* Source: The source of the line for the trailing SL of the third-party indicator.
* Trailing SL after entry: The mode of activation of the trailing SL after entering the transaction
* SL management after TP (sections 1️⃣, 2️⃣, 3️⃣): These three blocks allow you to create a complex stop loss management logic as profits are recorded.
For each take profit level (TP1, TP2, TP3), you can configure:
* SL BE / SL TP1 / SL TP2: When the corresponding TP is reached, the stop loss will be moved to the breakeven point (for TP1), to the TP1 price level (for TP2) or to the TP2 price level (for TP3).
* Trailing SL: When the corresponding TP is reached, the trailing stop loss is activated according to the settings above.
* By ↔️ Signal: A very powerful option. If it is enabled, the above action (SL transfer or trailing activation) will occur when the opposite trading signal is received from an external indicator. This allows you to protect profits or reduce losses if the market turns sharply, even before reaching the target.
* SL Delay ⮕ Allows you to delay the activation of the stop loss.
* Number of Bars: The Stop loss will be physically placed on the market only after the specified number of candles has passed since entering the trade. This can help to avoid "taking out" the stop with a random short movement (squiz) immediately after opening a position.
* SL Block: Unique defensive mechanics for trading both ways (`Strategy Type: Both`).
* Number of SL: If the strategy receives the specified number of stop losses in a row in one direction (for example, 2 stops long), it temporarily blocks the opportunity to open new trades in that direction.
* Lock Reset mode:
* By direction: The lock is lifted if a profitable trade is closed in the allowed direction or if a stop loss is triggered in the opposite direction.
* First profit: The lock is lifted after closing any profitable transaction, regardless of its direction.
// ------------------------
5. ✅ Take Profit ✅
This group of settings provides comprehensive control over profit taking, from a simple take profit to a complex system of partial closures and trailing.
* ✅ TP Type: Defines the base price for calculating the percentage deviation of the take profit.
* From entry point: TP is calculated from the base order price.
* From breakeven line: TP dynamically follows the average position price.
* From last executed SO: TP is calculated from the price of the last executed order.
* Filters for closing on signal
* Only ➕: If TP is triggered by a signal, the deal will be closed only if it is in the black relative to the average price.
* Or >TP: If TP is triggered by a signal, the trade will be closed only if the closing price is better than (or equal to) the estimated price of this TP.
* TP type of trailing: Yes, take profit has a trailing too! It works differently than the SL trailing.
* Standard / ATR: After the price touches the "virtual" TP level, the trailing is activated. He does not place a stop order, but begins to move away from the price, dynamically moving the limit order to close further and further in the profitable direction, allowing him to collect the maximum from the impulse movement.
* External Source: TP will follow any selected line of the third-party indicator.
* Period and Multiplier: Parameters for calculating the trailing margin TP.
* Source: The source of the line for the trailing TP of the third-party indicator.
* TP level settings (sections 1️⃣, 2️⃣, 3️⃣, 4️⃣): The strategy supports up to four independent take profit levels, which allows for a flexible system of partial commits.
For each level, you can set:
* TP: Enable the level and set its percentage deviation from the base price.
* Size: What percentage of the current position will be closed when this level is reached. For the last active TP, this parameter is ignored, and 100% of the remaining position is closed.
* Trailing TP: Enable the above-described trailing mechanism for this particular level.
* Signal: Enable closing based on the signal from the external indicator for this level.
* Or take: If both the closing on the signal and the limit order are enabled, then whatever comes first will work.
* After SO: Activate this TP level only after the specified number of safety orders has been executed. This allows you to set closer targets for riskier (deeply averaged) positions.
// ------------------------
6. 🔬 GRID and MultiGrid Analysis on Lower TFs (LTF) 🔬
This group activates one of the most important functions for accurate testing of grid strategies.
* Enable LTF Calculation ⮕ The main switch of the analysis mode on the lower timeframes.
* Timeframe selection: A drop-down list where you can select a timeframe for detailed analysis. For example, if your main schedule is 1 hour, you can select 1 minute here. The strategy will emulate the trading of minute candles within each hour candle.
❗️Important: As mentioned in the first part, the use of this mode is critically necessary to obtain realistic backtest results, especially for strategies with a dense grid of orders. Without it, the results may be overly optimistic and not reflect the real dynamics of the market. It should be remembered that TradingView imposes a limit on the number of intra-bars (minor TF bars) that can be requested. This is usually about 100,000 bars.
// ------------------------
7. 🕘 Backtest Date Range 🕘
This group allows you to focus testing on a specific historical period.
* Limit Date Range: Enables date filtering.
* Start time: The date and time when the strategy will start analyzing and opening deals.
* End time: The date and time after which the strategy will stop opening new deals and complete testing.
// ------------------------
8. 🎨 Visualization 🎨
All the options responsible for the appearance and information content of the chart are collected here.
* Show PnL labels: Enables/disables the display of text labels with the result (profit/loss) after closing each trade.
* Statistics Table: Enables/disables the main dashboard with detailed statistics on the results of the backtest.
* Strategy Settings Table: Enables/disables an additional panel that summarizes all the key parameters of the current configuration.
* Monthly Profit Table: Enables/disables a table with a breakdown of percentage returns by month and year.
* Table settings: For each of the three tables, you can individually adjust the Text size and Table Position on the screen to position them as conveniently as possible.
* Decimal places: Defines how many decimal places will be displayed in numeric values in tables and on labels.
// ------------------------
9. ✉️ Webhook Settings ✉️
This group is intended for traders who want to automate trading on strategy signals using third-party services and exchanges (for example, 3Commas, WunderTrading, Cryptorobotics, Cryptohopper, Bitsgap, Binance, ByBit, OKX, Pionex, Bitget or proprietary solutions).
For each key event in the strategy, there is a separate switch and a text field:
* Webhook for Open: Enable and set a message for the webhook that will be sent when the base order is opened.
* Webhook for Averaging: A message sent when executing any insurance order.
* Webhook for Take Profit: A message sent when closing on take profit (including partial ones).
* Webhook for Stop-Loss: A message sent when a stop loss is closed.
You can insert a JSON code or any other message format that your service requires for automation into the text fields. The strategy supports special placeholders (for example, `{{strategy.order.alert_message}}`), which allow you to dynamically insert the necessary data into the message, such as the amount of USDT or the percentage of the deposit for entry, averaging and take profit orders.

Protervus Trading ToolkitHi Traders! Welcome to Protervus Trading Toolkit (PTT) , a comprehensive set of tools to help you building, backtesting, and even automating your strategy.
Important : the data and screenshots I publish are solely for presentation and explanation purposes and must not be intended as recommendations or guarantees. Please consider eventual backtesting results seen here as almost-random. My goal is not to provide ready-made strategies, signals, or infallible methods, but rather indicators and tools to help you focus on your own research and build a reliable trading plan based on discipline.
BUILD, BACKTEST, AUTOMATE
The first step is to link a chained indicator which will send Entry signals and, optionally, Exit signals: to integrate your own triggers with this toolkit, check out my tutorial and use this code as a template.
Then, in the Trading Settings you can set the Trading Mode (Full - Long and Short, Long only, or Short only) as well as Starting Capital, Drawdown Limit, Risk per Trade, Fees, and the date range in which trading will be enabled and backtested.
Go further by tweaking your strategy with built-in Take Profit and Stop Loss conditions, and keep it under control thanks to the Statistics Panel.
Trades will be shown on the chart, including TP\SL levels (according to the ones you enable) and per-trade statistics:
Tip: point the cursor over TP or SL icon to open the tooltip, showing additional details about the trade.
BUILT-IN CONDITIONS
Note: all conditions already account for fees.
Take Profit \ Stop Loss percentage
Take Profit or Stop at Loss when a fixed percentage is reached.
Limit \ Hard Stop: the trade will be considered closed when that specific price is reached - otherwise, the candle closing price will be used.
Trailing Take Profit
Trail the price and close the trade in profit when it reverses for the chosen percentage.
Engage and Disengage: activate trailing when the price is above the entry price for the chosen percentage, and de-activate it if price goes past the disengage percentage.
Safety TP: close the trade at Break-Even if the price sharply reverses from engaged area to BE level. A specific Alert is available in order to create a separate trigger with immediate effect.
Note: using TP Safety with an Engage % of zero might result in many early exits, so it is recommended to add some margin to Engage % to avoid that.
Exit \ Stop on Opposite Signal
Close the trade when another, contrary signal is received (e.g. close a Long position when a signal to go Short is received).
Exit \ Stop after X candles
Close the trade after X candles, as soon as the condition is met (e.g. for Take Profit condition, it will close the trade after X candles as soon as the trade is in profit).
Bind to TP \ SL: only validate the condition if the current PnL is above (TakeProfit cond.) or below (Stop Loss cond.) the specified percentage.
ATR Stop
Classic ATR Stop Loss.
Trailing ATR
Chase the price by the defined ratio and close the position when the candle closes past the ATR line.
Bind to TP \ SL: only validate the condition if the current PnL is above (TakeProfit cond.) or below (Stop Loss cond.) the specified percentage.
External Signal (sent from your indicator)
Close the position basing on your own triggers, defined in the chained indicator.
- Bind to TP \ SL: only validate the condition if the current PnL is above (TakeProfit cond.) or below (Stop Loss cond.) the specified percentage.
PANEL CUSTOMIZATION AND ADDITIONAL OPTIONS
A strategy name can be assigned in the settings and will show it at the top of the Statistics Panel, so you can better identify and label your tests and live instances.
The panel can be customized in terms of colors, text size and height. It can be also "split" in modular panels that will appear at the bottom of the chart.
It is also possible to show \ hide prices and live data labels as well as position and Break-Even levels. In some cases you will need to limit the display of those plots in order to avoid PineScript calculation issues.
If you limited the plots but you are checking very old trades, you can enable the Legacy position tracker to see basic markers for positions (position is active, and profit \ loss marker).
In the case you will be sending webhook alerts to a trading bot , "Position Alert Failover" will come in aid to prevent situations where the initial trade closing alert is either not sent or missed: it will keep sending the position closing signal for X candles.
PLUGINS
Thanks to the modular nature of PTT, plugins will eventually be available to provide additional features and extend functionalities even further. Make sure to keep an eye on updates.
CREATING ALERTS
To create alerts you must first select the PTT indicator from the "Condition" drop-down menu, then the whole list of available alerts will appear. When creating alerts, please make sure to set "Once Per Bar Close" for the normal conditions, and "Once Per Bar" for safety conditions (Limit and Hard Stop simulation, Trailing TP Safety Trigger).
Besides positions opening and closing alerts, you also have the option to add extra alerts for when a position is open or not open (e.g. Active Long position, No Long Position) - that might come handy when dealing with trading bots and automation tools. Also, as mentioned earlier, you have the chance to create a special alert as failover in order to repeat the closing alert.
TIPS AND RECOMMENDATIONS
Set Visual Order > Bring to front for PTT to avoid other indicators or candles covering up labels.
If you receive errors like "Referencing too many candles" or "Too many drawings", use the " Limit to last candles " function in the Settings panel to lower the number of candles.
If the Statistics Panel or labels are not appearing, and no errors are shown (red circled exclamation mark next to indicator's name), try changing any value in the settings to trigger a new calculation.
The Lowest Point in Trades refers to the maximum movement against your position. However, if the price never goes negative against the Entry level, it will be calculated from the Break-Even level.
Differently from TradingView's Strategy Tester, PTT calculates DrawDown from the Equity line (the starting balance).
Remember that Backtests only show past results, and although very useful to understand if your strategy makes sense, the market can completely change at any moment and ruin your dreams: make sure to avoid over-fitting (using very specific values) in your settings and to prefer more generic values in order to factor broader market situations.
After many successful backtests of your newly created strategy, let it run live without actually trading it for some time (paper trading), and see if it remains valid.
You can use multiple Conditions as safeguard. For example, main Stop condition can be Trailing ATR and secondary Stop condition can be Stop Loss % with Hard Stop, so you will be protected in case of sudden big price moves.
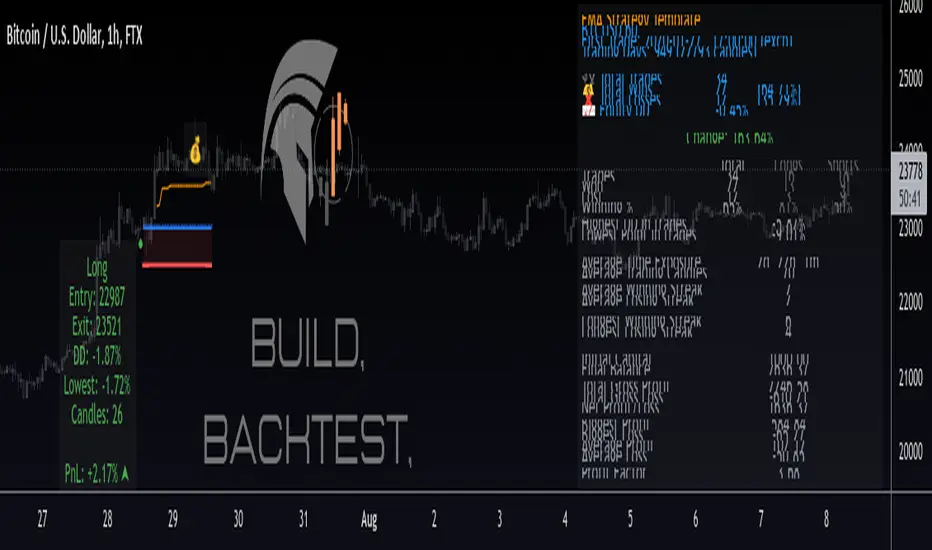
Flux Charts - S&D Automation💎 GENERAL OVERVIEW
The MTF Supply & Demand Zones (S&D) Automation is a powerful and versatile tool designed to help traders rigorously test their trading strategies against historical market data. With various advanced settings, traders can fine-tune their strategies, assess performance, and identify key improvements before deploying in live trading environments. This tool offers a wide range of configurable settings, explained within this write-up.
Features of the new S&D Automation:
Step By Step : Configure your strategy step by step, which will allow you to have OR & AND logic in your strategies.
Highly Configurable : Offers multiple parameters for fine-tuning trade entry and exit conditions.
Multi-Timeframe Analysis : Allows traders to analyze multiple timeframes simultaneously for enhanced accuracy.
Provides advanced stop-loss, take-profit, and break-even settings.
Incorporates Supply & Demand Zone conditions, with settings like Sensitivity, Zone Invalidation, Minimum Zone Width & Minimum Zone Length settings for refined strategy execution.
🚩 UNIQUENESS
The S&D Automation stands out from conventional backtesting tools due to its unparalleled flexibility, precision, and advanced trading logic integration. Key factors that make it unique include:
✅ Comprehensive Strategy Customization – Unlike traditional backtesters that offer basic entry and exit conditions, S&D Automation provides a highly detailed parameter set, allowing traders to fine-tune their strategies with precision.
✅ Multi-Timeframe Supply & Demand Zones – This is the first-ever tool that allows traders to backtest Supply & Demand zones on multiple timeframes.
✅ Customizable Take-Profit Conditions – Offers various methods to set take-profit exits, including using core features from Supply & Demand Zones, and fixed exits like ATR, % change or price change, enabling traders to tailor their exit strategies to specific market behaviors.
✅ Customizable Stop-Loss Conditions – Provides several ways to set up stop losses, including using concepts from Supply & Demand Zones and trailing stops or fixed exits like ATR, % change or price change, allowing for dynamic risk management tailored to individual strategies.
✅ Integration of External Indicators – Allows the inclusion of other indicators or data sources from TradingView for creating strategy conditions, enabling traders to enhance their strategies with additional insights and data points.
By integrating these advanced features, S&D Automation ensures that traders can rigorously test and optimize their strategies with great accuracy and efficiency.
📌 HOW DOES IT WORK ?
The first setting you will want to set it the pyramiding setting. This setting controls the number of simultaneous trades in the same direction allowed in the strategy. For example, if you set it to 1, only one trade can be active in any time, and the second trade will not be entered unless the first one is exited. If it is set to 2, the script will handle both of them at the same time. Note that you should enter the same value to this pyramiding setting, and the pyramiding setting in the "Properties" tab of the script for this to work.
You can enable and set a backtesting window that will limit the entries to between the start date & end date.
Then, you can enter your desired settings for Supply & Demand Zones. You can also enable and set up to 3 timeframes, which you can use later on when customizing your strategies enter / exit conditions.
Entry Conditions
From the "Long Conditions" or the "Short Conditions" groups, you can set your position entry conditions. For settings like "initial capital" or "order size", you can open the "Properties" tab, where these are handled.
The S&D Automation can use the following conditions for entry conditions :
1. Demand Zone
Detection: Triggered when a Demand Zone forms or is detected
Retest: Triggered when price retests a Demand Zone. A retest is confirmed when a candle enters a Demand Zone and closes outside of it.
2nd Retest: Triggered when price retests a Demand Zone for the second time. A retest is confirmed when a candle enters a Demand Zone and closes outside of it.
3rd Retest: Triggered when price retests a Demand Zone for the third time. A retest is confirmed when a candle enters a Demand Zone and closes outside of it.
Retracement: Triggered when price touches a Demand Zone
Break: Triggered when a Demand Zone is invalidated by candle close or wick, depending on the user's input.
2. Supply Zone
Detection: Triggered when a Supply Zone forms or is detected
Retest: Triggered when price retests a Supply Zone. A retest is confirmed when a candle enters a Supply Zone and closes outside of it.
2nd Retest: Triggered when price retests a Supply Zone for the second time. A retest is confirmed when a candle enters a Supply Zone and closes outside of it.
3rd Retest: Triggered when price retests a Supply Zone for the third time. A retest is confirmed when a candle enters a Supply Zone and closes outside of it.
Retracement: Triggered when price touches a Supply Zone
Break: Triggered when a Supply Zone is invalidated by candle close or wick, depending on the user's input.
3. Any Zone
Detection: Triggered when any Supply or Demand Zone forms or is detected
Retest: Triggered when price retests any Supply or Demand Zone. A retest is confirmed when a candle enters any Supply or Demand Zone and closes outside of it.
2nd Retest: Triggered when price retests any Supply or Demand Zone for the second time. A retest is confirmed when a candle enters any Supply or Demand Zone and closes outside of it.
3rd Retest: Triggered when price retests any Supply or Demand Zone for the third time. A retest is confirmed when a candle enters any Supply or Demand Zone and closes outside of it.
Retracement: Triggered when price touches any Supply or Demand Zone
Break: Triggered when any Supply or Demand Zone is invalidated by candle close or wick, depending on the user's input.
🕒 TIMEFRAME CONDITIONS
The S&D Automation supports Multi-Timeframe (MTF) features, just like the Supply & Demand indicator. When setting an entry condition, you can also choose the timeframe.
To set up MTF conditions, navigate to the 'Timeframes' section in the settings, select your desired timeframes, and enable them. You can choose up to three timeframes.
Once you've selected your timeframes, you can use them in your strategy. When setting long and short entry/exit conditions, you can choose from Timeframe 1, Timeframe 2, or Timeframe 3.
External Conditions
Users can use external indicators on the chart to set entry conditions.
The second dropdown in the external condition settings allows you to choose a conditional operator to compare external outputs. Available options include:
Less Than or Equal To: <=
Less Than: <
Equal To: =
Greater Than: >
Greater Than or Equal To: >=
The position entry conditions work like this ;
Each side has 5 S&D Zone conditions and 1 Source condition. Each condition can be enabled or disabled using the checkbox on the left side of them.
The next selection is the alert type, which you can select between "Detection", "Retest", "Retracement" or "Break".
You can select which timeframe this condition should work on from Timeframe 1, 2, or 3. If you select "Any Timeframe", the condition will work for all timeframes.
Lastly select the step of this condition from 1 to 6.
The Source Condition
The last condition on each side is a source condition that is different from the others. Using this condition, you can create your own logic using other indicators' outputs on your chart. For example, suppose that you have an EMA indicator in your chart. You can have the source condition to something like "EMA > high".
The Step System
Each condition has a step number, and conditions are in topological order based on them.
The conditions are executed step by step. This means the condition with step 2 cannot be executed before the condition with step 1 is executed.
Conditions with the same step numbers have "OR" logic. This means that if you have 2 conditions with step 3, the condition with step 4 can trigger after only one of the step 3 conditions is executed.
➕ OTHER ENTRY FEATURES
The S&D Automation allows traders to choose when to execute trades and when not to execute trades.
1. Only Take Trades
This setting lets users specify the time period when their strategy can open or execute trades.
2. Don't Take Trades
This setting lets users specify time periods when their strategy can't open or execute trades.
↩️ EXIT CONDITIONS
1. Exit on Opposite Signal
When enabled, a long position will close when short entry conditions are met, and a short position will close when long entry conditions are met.
2. Exit on Session End
When enabled, positions will be closed at the end of the trading session.
📈 TAKE PROFIT CONDITIONS
There are several methods available for setting take profit exits and conditions.
1. Entry Condition TP
Users can use entry conditions as triggers for take-profit exits. This setting can be found under the long and short exit conditions.
2. Fixed TP
Users can set a fixed TP for exits. This setting can be found under the long and short exit conditions. Users can choose between the following:
Price: This method triggers a TP exit when price reaches a specified level. For example, if you set the Price TP to 10 and buy NASDAQ:TSLA at $190, the trade will automatically exit when the price reaches $200 ($190 + $10).
Ticks: This method triggers a TP exit when price moves a specified number of ticks.
Percentage (%): This method triggers a TP exit when price moves a specified percentage.
ATR: This method triggers a TP exit based on a specified multiple of the Average True Range (ATR).
📉 STOP LOSS CONDITIONS
There are several methods available for setting stop-loss exits and conditions.
1. Entry Condition SL
Users can use entry conditions as triggers for stop-loss exits. This setting can be found under the long and short exit conditions.
2. Fixed SL
Users can set a fixed SL for exits. This setting can be found under the long and short exit conditions. Users can choose between the following:
Price: This method triggers a SL exit when price reaches a specified level. For example, if you set the Price SL to 10 and buy NASDAQ:TSLA at $200, the trade will automatically exit when the price reaches $190 ($200 - $10).
Ticks: This method triggers a SL exit when price moves a specified number of ticks.
Percentage (%): This method triggers a SL exit when price moves a specified percentage.
ATR: This method triggers a SL exit based on a specified multiple of the Average True Range (ATR).
3. Trailing Stop
An explanation & example for the trailing stop feature is present on the write-up within the next section.
Exit conditions have the same logic of constructing conditions like the entry ones. You can construct a Take-Profit Condition & a Stop-Loss Condition. Note that the Take-Profit condition will only work if the position is in profit, regardless of if it's triggered or not. The same applies for the Stop-Loss condition, meaning that it will only work if the position is in loss.
You can also set a Fixed TP & Fixed SL based on the price movement after the position is entered. You have options like "Price", "Ticks", "%", or "Average True Range". For example, you can set a Fixed TP like "5%", and the position will be entered once it moves 5% up in a long position.
Trailing Stop
For the Fixed SL, you also have a "Trailing" stop option, for which you can set its activation level as well. The Trailing stop activation level and its value are expressed in ticks. Check this scenario for an example :
We have a ticker with a tick value of $1. Our Trailing Stop is set to 10 ticks, and the activation level is set to 30 ticks.
We buy 1 contract when the price is $100.
When the price becomes $110, we are in $10 (10 ticks) profit and the trailing stop is now activated.
The current price our stop's on is $110 - $30 (30 ticks), which is the level of $80.
The trailing stop will only move if the price moves up the highest high the price has been after we entered the position.
Let's suppose that price moves up $40 right after our trailing stop is activated. The price will now be $150, and our trailing stop will sit on $150 - $30 (30 ticks) = $120.
If the price is down the $120 level, our stop loss will be triggered.
There is also a "Hard SL" option designed for a backup stop-loss when trailing stops are enabled. You can enable & set this option and if the price goes down before our trailing stop even activates, the position will be exited.
You can also move stop-loss to the break-even (entry price of the position) after a certain profit is achieved using the last setting of the exit conditions. Note that for this to work, you must have a Fixed SL set-up.
➕ OTHER EXIT FEATURES
1. Move Stop Loss to Breakeven
This setting allows the strategy to automatically move the SL to Breakeven (BE) when the position is in profit by a certain amount. Users can choose between the following:
Price: This method moves the SL to BE when price reaches a specified level.
Ticks: This method moves the SL to BE when price moves a specified number of ticks.
Percentage (%): This method moves the SL to BE when price moves a specified percentage.
ATR: This method moves the SL to BE when price moves a specified multiple of the Average True Range (ATR).
Example Entry Scenario
To give an example , check this scenario; out conditions are :
LONG CONDITIONS
Demand Zone Detection, Step 1
Supply Zone Retest, Step 2
Demand Zone Break, Step 2
open > close, Step 3
First, the strategy needs to detect a Demand Zone Detection in order to start working.
After it's detected, now it's looking for either a Supply Zone Retest, or a Demand Zone Break to proceed to the next step, the reason for this is that they both have the same step number.
After one of them is detected, the strategy will consistently check candlesticks for the condition open > close. If a bullish candlestick occurs, a long position will be entered.
⏰ ALERTS
This indicator uses TradingView's strategy alert system. All entries and exits will be sent as an alert if configured. It's possible to further customize these alerts to your liking. For more information check TradingView's strategy alert customization page : www.tradingview.com
⚙️ SETTINGS
1. Backtesting Settings
Pyramiding: Controls the number of simultaneous trades allowed in the strategy. This setting must have the same value that is entered on the script's properties tab on the settings pane.
Enable Custom Backtesting Period: Restricts backtesting to a specific date range.
Start & End Time Configuration: Define precise start and end dates for historical analysis.
2. General Configuration
Detection Method: There are two detection methods you can choose from for identifying Supply & Demand Zones. Both methods aim to identify key areas where price is likely to react, but they do so using different approaches. Traders can choose the method that aligns with their trading style and time horizon.
Sensitivity: The Sensitivity setting allows traders to adjust how aggressively the script identifies supply and demand zones when using the Momentum Detection Method. This setting directly impacts the threshold for detecting zones when using the momentum detection method.
Zone Invalidation: The Zone Invalidation setting determines how supply and demand zones are invalidated.
Wick -> A zone is invalidated if a candle’s wick goes below a demand zone or above a supply zone.
Close -> A zone is invalidated if a candle closes below a demand zone or above a supply zone.
Zone Visibility Range: The Zone Visibility Range setting controls how far from the current price supply and demand zones are displayed on the chart. It helps traders focus on relevant zones while avoiding clutter from distant or less impactful areas.
Minimum Zone Width: The Minimum Zone Width setting defines the smallest size a supply or demand zone must have to be displayed on the chart. It uses the Average True Range (ATR) as a reference to ensure zones are proportionate to current market volatility.
Minimum Zone Length: The Minimum Zone Length setting determines the minimum number of bars a supply or demand zone must span to be displayed on the chart. This setting helps filter out short-lived or insignificant zones, ensuring only meaningful areas of supply or demand are highlighted.
3. Multi-Timeframe Analysis
Enable Up to Three Timeframes: Select and analyze trades across multiple timeframes.
4. Entry Conditions for Long & Short Trades
Multiple Conditions (1-6): Configure up to six independent conditions per trade direction.
Condition Types: Options include Detection, Retest, 2nd Retest, 3rd Retest, Retracement, and Break.
Timeframe Specification: Choose between "Any Timeframe", "Timeframe 1", "Timeframe 2", or "Timeframe 3".
Trade Execution Filters: Restrict trades within specific trading sessions.
5. Exit Conditions for Long & Short Trades
Exit on Opposite Signal: Automatically exit trades upon opposite trade conditions.
Exit on Session End: Closes all positions at the end of the trading session.
Multiple Take-Profit (TP) and Stop-Loss (SL) Configurations:
TP/SL based on % move, ATR, Ticks, or Fixed Price.
Hard SL option for additional risk control.
Move SL to BE (Break Even) after a certain profit threshold.

RunRox - Backtesting System (ASMC)Introducing RunRox - Backtesting System (ASMC), a specially designed backtesting system built on the robust structure of our Advanced SMC indicator. This innovative tool evaluates various Smart Money Concept (SMC) trading setups and serves as an automatic optimizer, displaying which entry and exit points have historically shown the best results. With cutting-edge technology, RunRox - Backtesting System (ASMC) provides you with effective strategies, maximizing your trading potential and taking your trading to the next level
🟠 HOW OUR BACKTESTING SYSTEM WORKS
Our backtesting system for the Advanced SMC (ASMC) indicator is meticulously designed to provide traders with a thorough analysis of their Smart Money Concept (SMC) strategies. Here’s an overview of how it works:
🔸 Advanced SMC Structure
Our ASMC indicator is built upon an enhanced SMC structure that integrates the Institutional Distribution Model (IDM), precise retracements, and five types of order blocks (CHoCH OB, IDM OB, Local OB, BOS OB, Extreme OB). These components allow for a detailed understanding of market dynamics and the identification of key trading opportunities.
🔸 Data Integration and Analysis
1. Historical Data Testing:
Our system tests various entry and exit points using historical market data.
The ASMC indicator is used to simulate trades based on predefined SMC setups, evaluating their effectiveness over a specified time period.
Traders can select different parameters such as entry points, stop-loss, and take-profit levels to see how these setups would have performed historically.
2. Entry and Exit Events:
The backtester can simulate trades based on 12 different entry events, 14 target events, and 14 stop-loss events, providing a comprehensive testing framework.
It allows for testing with multiple combinations of entry and exit strategies, ensuring a robust evaluation of trading setups.
3. Order Block Sensitivity:
The system uses the sensitivity settings from the ASMC indicator to determine the most relevant order blocks and fair value gaps (FVGs) for entry and exit points.
It distinguishes between different types of order blocks, helping traders identify strong institutional zones versus local zones.
🔸 Optimization Capabilities
1. Auto-Optimizer:
The backtester includes an auto-optimizer feature that evaluates various setups to find those with the best historical performance.
It automatically adjusts parameters to identify the most effective strategies for both trend-following and counter-trend trading.
2. Stop Loss and Take Profit Optimization:
It optimizes stop-loss and take-profit levels by testing different settings and identifying those that provided the best historical results.
This helps traders refine their risk management and maximize potential returns.
3. Trailing Stop Optimization:
The system also optimizes trailing stops, ensuring that traders can maximize their profits by adjusting their stops dynamically as the market moves.
🔸 Comprehensive Reporting
1. Performance Metrics:
The backtesting system provides detailed reports, including key performance metrics such as Net Profit, Win Rate, Profit Factor, and Max Drawdown.
These metrics help traders understand the historical performance of their strategies and make data-driven decisions.
2. Flexible Settings:
Traders can adjust initial balance, commission rates, and risk per trade settings to simulate real-world trading conditions.
The system supports testing with different leverage settings, allowing for realistic assessments even with tight stop-loss levels.
🔸 Conclusion
The RunRox Backtesting System (ASMC) is a powerful tool for traders seeking to validate and optimize their SMC strategies. By leveraging historical data and sophisticated optimization algorithms, it provides insights into the most effective setups, enhancing trading performance and decision-making.
🟠 HERE ARE THE AVAILABLE FEATURES
Historical backtesting for any setup – Select any entry point, exit point, and various stop-loss options to see the results of your setup on historical data.
Auto-optimizer for finding the best setups – The indicator displays settings that have shown the best results historically, providing valuable insights.
Auto-optimizer for counter-trend setups – Discover entry and exit points for counter-trend trading based on historical performance.
Auto-optimizer for stop-loss – The indicator shows stop-loss points that have been most effective historically.
Auto-optimizer for take-profit – The indicator identifies take-profit points that have performed well in historical trading data.
Auto-optimizer for trailing stop – The indicator presents trailing stop settings that have shown the best historical results.
And much more within our indicator, all of which we will cover in this post. Next, we will showcase the possible entry points, targets, and stop-loss options available for testing your strategies
🟠 ENTRY SETTINGS
12 Event Triggers for Trade Entry
Extr. ChoCh OB
Extr. ChoCh FVG
ChoCh
ChoCh OB
ChoCh FVG
IDM OB
IDM FVG
BoS FVG
BoS OB
BoS
Extr. BoS FVG
Extr. BoS OB
3 Trade Direction Options
Long Only: Enter long positions only
Short Only: Enter short positions only
Long and Short: Enter both long and short positions based on trend
3 Levels for Order Block/FVG Entries
Beginning: Enter the trade at the first touch of the Order Block/FVG
Middle: Enter the trade when the middle of the Order Block/FVG is reached
End: Enter the trade upon full filling of the Order Block/FVG
*Three levels work only for Order Blocks and FVG. For trade entries based on BOS or CHoCH, these settings do not apply as these parameters are not available for these types of entries
You can choose any combination of trade entries imaginable.
🟠 TARGET SETTINGS
14 Target Events, Including Fixed % and Fixed RR (Risk/Reward):
Fixed - % change in price
Fixed RR - Risk Reward per trade
Extr. ChoCh OB
Extr. ChoCh FVG
ChoCh
ChoCh OB
ChoCh FVG
IDM OB
IDM FVG
BoS FVG
BoS OB
BoS
Extr. BoS FVG
Extr. BoS OB
3 Levels of Order Block/FVG for Target
Beginning: Close the trade at the first touch of your target.
Middle: Close the trade at the midpoint of your chosen target.
End: Close the trade when your target is fully filled.
Customizable Parameters
Easily set your Fixed % and Fixed RR targets with a user-friendly input field. This field works only for the Fixed and Fixed RR entry parameters. When selecting a different entry point, this field is ignored
Choose any combination of target events to suit your trading strategy.
🟠 STOPLOSS SETTINGS
14 Possible StopLoss Events Including Entry Orderblock/FVG
Fixed - Fix the loss on the trade when the price moves by N%
Entry Block
Extr. ChoCh OB
Extr. ChoCh FVG
ChoCh
ChoCh OB
ChoCh FVG
IDM OB
IDM FVG
BoS FVG
BoS OB
BoS
Extr. BoS FVG
Extr. BoS OB
3 Levels for Order Blocks/FVG Exits
Beginning: Exit the trade at the first touch of the order block/FVG.
Middle: Exit the trade at the middle of the order block/FVG.
End: Exit the trade at the full completion of the order block/FVG.
Dedicated Field for Setting Fixed % Value
Set a fixed % value in a dedicated field for the Fixed parameter. This field works only for the Fixed parameter. When selecting other exit parameters, this field is ignored.
🟠 ADDITIONAL SETTINGS
Trailing Stop, %
Set a Trailing Stop as a percentage of your trade to potentially increase profit based on historical data.
Move SL to Breakeven, bars
Move your StopLoss to breakeven after exiting the entry zone for a specified number of bars. This can enhance your potential WinRate based on historical performance.
Skip trade if RR less than
This feature allows you to skip trades where the potential Risk-to-Reward ratio is less than the number set in this field.
🟠 EXAMPLE OF MANUAL SETUP
For example, let me show you how it works on the chart. You select entry parameters, stop loss parameters, and take profit parameters for your trades, and the strategy automatically tests this setup on historical data, allowing you to see the results of this strategy.
In the screenshot above, the parameters were as follows:
Trade Entry: CHoCH OB (Beginning)
Stop Loss: Entry Block
Take Profit: Break of BOS
The indicator will automatically test all possible trades on the chart and display the results for this setup.
🟠 AUTO OPTIMIZATION SETTINGS
In the screenshot above, you can see the optimization table displaying various entry points, exits, and stop-loss settings, along with their historical performance results and other parameters. This feature allows you to identify trading setups that have shown the best historical outcomes.
This functionality will enhance your trading approach, providing you with valuable insights based on historical data. You’ll be aware of the Smart Money Concept settings that have historically worked best for any specific chart and timeframe.
Our indicator includes various optimization options designed to help you find the most effective settings based on historical data. There are 5 optimization modes, each offering unique benefits for every trader
Trend Entry - Optimization of the best settings for trend-following trades. The strategy will enter trades only in the direction of the trend. If the trend is upward, it will look for long entry points and vice versa.
Counter Trend Entry - Finding setups against the trend. If the trend is upward, the script will search for short entry points. This is the opposite of trend entry optimization.
Stop Loss - Identifying stop-loss points that showed the best historical performance for the specific setup you have configured. This helps in finding effective exit points to minimize losses.
Take Profit - Determining targets for the configured setup based on historical performance, helping to identify potentially profitable take profit levels.
Trailing Stop - Finding optimal percentages for the trailing stop function based on historical data, which can potentially increase the profit of your trades.
Ability to set parameters for auto-optimization within a specified range. For example, if you choose FixRR TP from 1 to 10, the indicator will automatically test all possible Risk Reward Take Profit variations from 1 to 10 and display the results for each parameter individually.
Ability to set initial deposit parameters, position commissions, and risk per trade as a fixed percentage or fixed amount. Additionally, you can set the maximum leverage for a trade.
There are times when the stop loss is very close to the entry point, and adhering to the risk per trade values set in the settings may not allow for such a loss in any situation. That’s why we added the ability to set the maximum possible leverage, allowing you to test your trading strategy even with very tight stop losses.
Duplicated Smart Money Structure settings from our Advanced SMC indicator that you can adjust to match your trading style flexibly. All these settings will be taken into account during the optimization process or when manually calculating settings.
Additionally, you can test your strategy based on higher timeframe order blocks. For example, you can test a strategy on a 1-minute chart while displaying order blocks from a 15-minute timeframe. The auto-optimizer will consider all these parameters, including higher timeframe order blocks, and will enter trades based on these order blocks.
Highly flexible dashboard and results optimization settings allow you to display the tables you need and sort results by six different criteria: Profit Factor, Profit, Winrate, Max Drawdown, Wins, and Trades. This enables you to find the exact setup you desire, based on these comprehensive data points.
🟠 ALERT CUSTOMIZATION
With this indicator, you can set up buy and sell alerts based on the test results, allowing you to create a comprehensive trading strategy. This feature enables you to receive real-time signals, making it a powerful tool for implementing your trading strategies.
🟠 STRATEGY PROPERTIES
For backtesting, we used realistic initial data for entering trades, such as:
Starting balance: $1000
Commission: 0.01%
Risk per trade: 1%
To ensure realistic data, we used the above settings. We offer two methods for calculating your order size, and in our case, we used a 1% risk per trade. Here’s what it means:
Risk per trade: This is the maximum loss from your deposit if the trade goes against you. The trade volume can change depending on your stop-loss distance from the entry point. Here’s the formula we use to calculate the possible volume for a single trade:
1. quantity = percentage_risk * balance / loss_per_1_contract (incl. fee)
Then, we calculate the maximum allowed volume based on the specified maximum leverage:
2. max_quantity = maxLeverage * balance / entry_price
3. If quantity < max_quantity, meaning the leverage is less than the maximum allowed, we keep quantity. If quantity > max_quantity, we use max_quantity (the maximum allowed volume according to the set leverage).
This way, depending on the stop-loss distance, the position size can vary and be up to 100% of your deposit, but the loss in each trade will not exceed the set percentage, which in our case is 1% for this backtest. This is a standard risk calculation method based on your stop-loss distance.
🔸 Statistical Significance of Trade Data
In our strategy, you may notice there weren’t enough trades to form statistically significant data. This is inherent to the Smart Money Concept (SMC) strategy, where the focus is not on the number of trades but rather on the risk-to-reward ratio per trade. In SMC strategies, it’s crucial to avoid taking numerous uncertain setups and instead perform a comprehensive analysis of the market situation.
Therefore, our strategy results show fewer than 100 trades. It’s important to understand that this small sample size isn’t statistically significant and shouldn’t be relied upon for strategy analysis. Backtesting with a small number of trades should not be used to draw conclusions about the effectiveness of a strategy.
🔸 Versatile Use Cases
The methods of using this indicator are numerous, ranging from identifying potentially the best-performing order blocks on the chart to creating a comprehensive trading strategy based on the data provided by our indicator. We believe that every trader will find a valuable application for this tool, enhancing their entry and exit points in trades.
Disclaimer
Past performance is not indicative of future results. The results shown by this indicator do not guarantee similar outcomes in the future. Use this tool as part of a comprehensive trading strategy, considering all market conditions and risks.
How to access
For access to this indicator, please read the author’s instructions below this post
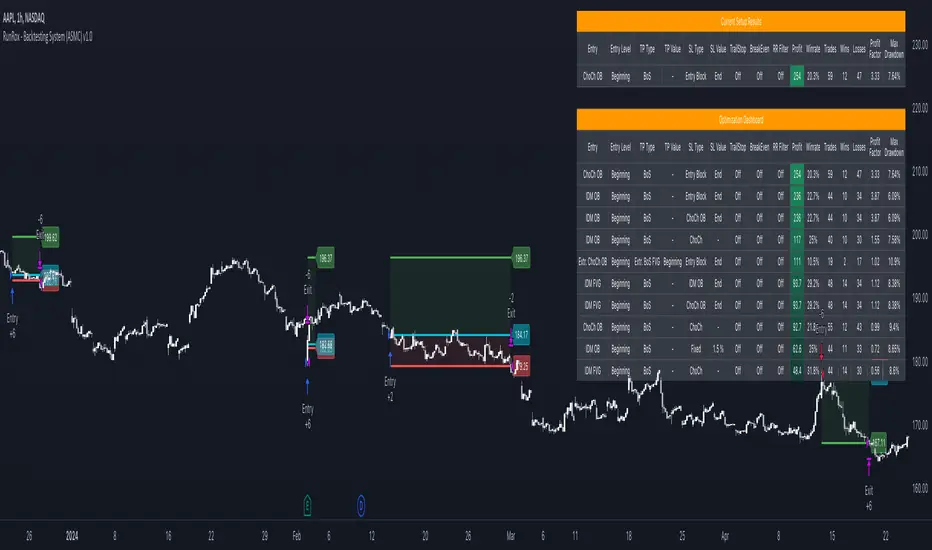
[Hercules] Backtest FrameworkLevel: 5
Background
Backtesting of technical indicators and strategies is the most common way to understand a quantitative strategy. However, the complicated configuration and adaptation work of backtesting many quantitative tools makes many traders who do not understand the code daunted. Moreover, although I have written a lot of strategies,
However, I am still not very satisfied with the backtest configuration and writing efficiency. Therefore, I have been thinking about how to build a backtesting framework that can quickly and easily evaluate the backtesting performance of any indicator with a "long/short entry" indicator, that is, a "simple backtesting tool for dummies". The performance requirements should be stable, and the operation should be simple and convenient. It is best to "copy", "paste", and "a few mouse clicks" to complete the quick backtest and evaluation of a new indicator.
Luckily, I recently realized that TradingView provides an "Indicator on Indicator" feature, which is the perfect foundation for doing "hot swap" backtesting. My basic idea is to use a two-layer design. The first layer is the technical indicator signal source that needs to be embedded, which is only used to provide buy and sell signals of custom strategies; the second layer is the trading system, which is used to receive the output signals of the first layer, and filter the signals according to the agreed specifications. , Take Profit, Stop Loss, draw buy and sell signals and cost lines, define and send custom buy and sell alert messages to mobile phones, social software or trading interfaces. In general, this two-layer design is a flexible combination of "fixed and flexiable", which can meet the needs of most traders to quickly evaluate the performance of a certain technical indicator. The first layer here is flexible. Users can insert their own strategy codes according to my template, and they can draw buy and sell signals and output them to the second layer. The second layer is fixed, and the overall framework is solidified to ensure the stability and unity of the trading system. It is convenient to compare different or similar strategies under the same conditions. Finally, all trading signals are drawn on the chart, and the output strategy returns. test report.
The main function:
The first layer: "{Hercules/Sextan} Your Indicator Source", the script provides a template for personalized strategy input, and the signal and definition interfaces ensure full compatibility with the second layer. Backtesting is performed stably in the backtesting framework of the layer. The first layer of this script is also relatively simple: enter your script in the highlighted custom script area, and after ensuring the final buy and sell signals long = bool condition, short = bool condition, the design of the first layer is considered complete. Input it into the PINE script editor of TradingView, save it and add it to the chart, you can see the pulse sequence in yellow (buy) and purple (sell) on the sub-picture, corresponding to the main picture, you can subjectively judge that the quality of the trading point of the strategy is good Bad.
The second layer: "{Hercules} Backtest Framework". This script is the standardized trading system strategy execution and alarm, used to generate the final report of the strategy backtest and some key indicators that I have customized that I find useful, such as: winning rate , Odds, Winning Surface, Kelly Ratio, Take Profit and Stop Loss Thresholds, Trading Frequency, etc. are evaluated according to the Kelly formula. To use the second layer, first load it into the TrainingView chart, no markers will appear on the chart, since you have not specified any strategy source signals, click on the gear-shaped setting next to the "{Hercules} BTFW" header button, you can open the backtest settings, the first item is to select your custom strategy source. Because we have added the strategy source to the chart in the previous step, you can easily find an option "{Hercules/Sextan} Your Indicator Source: Signal" at the bottom of the list, this is the strategy source input we need, select and confirm , you can see various markers on the main graph, and quickly generate a backtesting profit graph and a list of backtesting reports. You can generate files and download the backtesting reports locally. You can also click the gear on the backtest chart interface to customize some conditions of the backtest, including: initial capital amount, currency type, percentage of each order placed, amount of pyramid additions, commission fees, slippage, etc. configuration. Note: The configuration in the interface dialog overrides the same configuration implemented by the code in the backtest script.
How to output charts:
The first layer: "{Hercules/Sextan} Your Indicator Source", the output of this script is the pulse value of yellow and purple, yellow +1 means buy, purple -1 means sell.
The second layer: Hercules Backtest Framework". The output of this script is a bit complicated. After all, it is the entire trading system with a lot of information:
1. Blue and red arrows. The blue upward arrow indicates long position, the red downward arrow indicates short position, and the horizontal bar at the end of the purple arrow indicates take profit or stop loss exit.
2. Red and green lines. This is the holding cost line of the strategy, green represents the cost of holding a long position, and red represents the cost of holding a short position. The cost line is a continuous solid line and the price action is relatively close.
3. Green and yellow long take profit and stop loss area and green and yellow long take profit and stop loss fork. Once a long position is held, there is a conditional order for take profit and stop loss. The green horizontal line is the long take profit ratio line, and the yellow is the long stop loss ratio line; the green cross indicates the long take profit price, and the yellow cross indicates the long position. Stop loss price. It's worth noting that the prongs and wires don't necessarily go together. Because of the optimization of the algorithm, for a strong market, the take profit will occur after breaking the take profit line, and the profit will not be taken until the price falls.
4. The purple and red short take profit and stop loss area and the purple red short stop loss fork. Once a short position is held, there will be a take profit and stop loss conditional order, the red is the short take profit ratio line, and the purple is the short stop loss ratio line; the red cross indicates the short take profit price, and the purple cross indicates the short stop loss price.
5. In addition to the above signs, there are also text and numbers indicating the profit and loss values of long and short positions. "L" means long; "S" means short; "XL" means close long; "XS" means close short.
TradingView Strategy Tester Panel:
The overview graph is an intuitive graph that plots the blue (gain) and red (loss) curves of all backtest periods together, and notes: the absolute value and percentage of net profit, the number of all closed positions, the winning percentage, the profit factor, The maximum trading loss, the absolute value and ratio of the average trading profit and loss, and the average number of K-lines held in all trades.
Another is the performance summary. This is to display all long and short statistical indicators of backtesting in the form of a list, such as: net profit, gross profit, Sharpe ratio, maximum position, commission, times of profit and loss, etc.
Finally, the transaction list is a table indexed by the transaction serial number, showing the signal direction, date and time, price, profit and loss, accumulated profit and loss, maximum transaction profit, transaction loss and other values.
Remarks
Finally, I will explain that this is just the beginning of this model. I will continue to optimize the trading system of the second layer. Various optimization feedback and suggestions are welcome. For valuable feedback, I am willing to provide some L4/L5 technical indicators as rewards for free subscription rights.
Subscription
To encourage more people use this framework and avoid some abuse this one, I would like to set
100 Tradingview Coins per Monthly Subscription.
100X10 Tradingview Coins per Yearly Subscription.

[Sextan] T-Step LSMA MTF BacktestLevel: 1
NOTE: This is a request by @scantor516 to backtest T-Step LSMA by alexgrover with my Sextan framework. You can backtest many of my indicators in minutes now! Of course,you can define your own indicator in the highlighted area in compliance with the uniform format, which guarantee when you use "Indicator on Indicator" function, it would not produce any error.
Courtesy of alexgrover for his T-Step LSMA
Background
Backtesting of technical indicators and strategies is the most common way to understand a quantitative strategy. However, the complicated configuration and adaptation work of backtesting many quantitative tools makes many traders who do not understand the code daunted. Moreover, although I have written a lot of strategies, I am still not very satisfied with the backtest configuration and writing efficiency. Therefore, I have been thinking about how to build a backtesting framework that can quickly and easily evaluate the backtesting performance of any indicator with a "long/short entry" indicator, that is, a "simple backtesting tool for dummies". The performance requirements should be stable, and the operation should be simple and convenient. It is best to "copy", "paste", and "a few mouse clicks" to complete the quick backtest and evaluation of a new indicator.
Luckily, I recently realized that TradingView provides an "Indicator on Indicator" feature, which is the perfect foundation for doing "hot swap" backtesting. My basic idea is to use a two-layer design. The first layer is the technical indicator signal source that needs to be embedded, which is only used to provide buy and sell signals of custom strategies; the second layer is the trading system, which is used to receive the output signals of the first layer, and filter the signals according to the agreed specifications. , Take Profit, Stop Loss, draw buy and sell signals and cost lines, define and send custom buy and sell alert messages to mobile phones, social software or trading interfaces. In general, this two-layer design is a flexible combination of "death and alive", which can meet the needs of most traders to quickly evaluate the performance of a certain technical indicator. The first layer here is flexible. Users can insert their own strategy codes according to my template, and they can draw buy and sell signals and output them to the second layer. The second layer is fixed, and the overall framework is solidified to ensure the stability and unity of the trading system. It is convenient to compare different or similar strategies under the same conditions. Finally, all trading signals are drawn on the chart, and the output strategy returns. test report.
The main function:
The first layer: "{Sextan} Your Indicator Source", the script provides a template for personalized strategy input, and the signal and definition interfaces ensure full compatibility with the second layer. Backtesting is performed stably in the backtesting framework of the layer. The first layer of this script is also relatively simple: enter your script in the highlighted custom script area, and after ensuring the final buy and sell signals long = bool condition, short = bool condition, the design of the first layer is considered complete. Input it into the PINE script editor of TradingView, save it and add it to the chart, you can see the pulse sequence in yellow (buy) and purple (sell) on the sub-picture, corresponding to the main picture, you can subjectively judge that the quality of the trading point of the strategy is good Bad.
The second layer: "{Sextan} PINEv4 Sextans Backtest Framework". This script is the standardized trading system strategy execution and alarm, used to generate the final report of the strategy backtest and some key indicators that I have customized that I find useful, such as: winning rate , Odds, Winning Surface, Kelly Ratio, Take Profit and Stop Loss Thresholds, Trading Frequency, etc. are evaluated according to the Kelly formula. To use the second layer, first load it into the TrainingView chart, no markers will appear on the chart, since you have not specified any strategy source signals, click on the gear-shaped setting next to the "{Sextan} PINEv4 Sextans BTFW" header button, you can open the backtest settings, the first item is to select your custom strategy source. Because we have added the strategy source to the chart in the previous step, you can easily find an option "{Sextan} Your Indicator Source: Signal" at the bottom of the list, this is the strategy source input we need, select and confirm , you can see various markers on the main graph, and quickly generate a backtesting profit graph and a list of backtesting reports. You can generate files and download the backtesting reports locally. You can also click the gear on the backtest chart interface to customize some conditions of the backtest, including: initial capital amount, currency type, percentage of each order placed, amount of pyramid additions, commission fees, slippage, etc. configuration. Note: The configuration in the interface dialog overrides the same configuration implemented by the code in the backtest script.
How to output charts:
The first layer: "{Sextan} Your Indicator Source", the output of this script is the pulse value of yellow and purple, yellow +1 means buy, purple -1 means sell.
The second layer: PINEv4 Sextans Backtest Framework". The output of this script is a bit complicated. After all, it is the entire trading system with a lot of information:
1. Blue and red arrows. The blue upward arrow indicates long position, the red downward arrow indicates short position, and the horizontal bar at the end of the purple arrow indicates take profit or stop loss exit.
2. Red and green lines. This is the holding cost line of the strategy, green represents the cost of holding a long position, and red represents the cost of holding a short position. The cost line is a continuous solid line and the price action is relatively close.
3. Green and yellow long take profit and stop loss area and green and yellow long take profit and stop loss fork. Once a long position is held, there is a conditional order for take profit and stop loss. The green horizontal line is the long take profit ratio line, and the yellow is the long stop loss ratio line; the green cross indicates the long take profit price, and the yellow cross indicates the long position. Stop loss price. It's worth noting that the prongs and wires don't necessarily go together. Because of the optimization of the algorithm, for a strong market, the take profit will occur after breaking the take profit line, and the profit will not be taken until the price falls.
4. The purple and red short take profit and stop loss area and the purple red short stop loss fork. Once a short position is held, there will be a take profit and stop loss conditional order, the red is the short take profit ratio line, and the purple is the short stop loss ratio line; the red cross indicates the short take profit price, and the purple cross indicates the short stop loss price.
5. In addition to the above signs, there are also text and numbers indicating the profit and loss values of long and short positions. "L" means long; "S" means short; "XL" means close long; "XS" means close short.
TradingView Strategy Tester Panel:
The overview graph is an intuitive graph that plots the blue (gain) and red (loss) curves of all backtest periods together, and notes: the absolute value and percentage of net profit, the number of all closed positions, the winning percentage, the profit factor, The maximum trading loss, the absolute value and ratio of the average trading profit and loss, and the average number of K-lines held in all trades.
Another is the performance summary. This is to display all long and short statistical indicators of backtesting in the form of a list, such as: net profit, gross profit, Sharpe ratio, maximum position, commission, times of profit and loss, etc.
Finally, the transaction list is a table indexed by the transaction serial number, showing the signal direction, date and time, price, profit and loss, accumulated profit and loss, maximum transaction profit, transaction loss and other values.
Remarks
Finally, I will explain that this is just the beginning of this model. I will continue to optimize the trading system of the second layer. Various optimization feedback and suggestions are welcome. For valuable feedback, I am willing to provide some L4/L5 technical indicators as rewards for free subscription rights.

[Sextan] %R Trend Exhaustion BacktestLevel: 1
NOTE: This is a request by @upslidedown to backtest %R Trend Exhaustion by upslidedown with my Sextan framework. You can backtest many of my indicators in minutes now! Of course,you can define your own indicator in the highlighted area in compliance with the uniform format, which guarantee when you use "Indicator on Indicator" function, it would not produce any error.
Courtesy of upslidedown for his %R Trend Exhaustionindicator
Background
Backtesting of technical indicators and strategies is the most common way to understand a quantitative strategy. However, the complicated configuration and adaptation work of backtesting many quantitative tools makes many traders who do not understand the code daunted. Moreover, although I have written a lot of strategies, I am still not very satisfied with the backtest configuration and writing efficiency. Therefore, I have been thinking about how to build a backtesting framework that can quickly and easily evaluate the backtesting performance of any indicator with a "long/short entry" indicator, that is, a "simple backtesting tool for dummies". The performance requirements should be stable, and the operation should be simple and convenient. It is best to "copy", "paste", and "a few mouse clicks" to complete the quick backtest and evaluation of a new indicator.
Luckily, I recently realized that TradingView provides an "Indicator on Indicator" feature, which is the perfect foundation for doing "hot swap" backtesting. My basic idea is to use a two-layer design. The first layer is the technical indicator signal source that needs to be embedded, which is only used to provide buy and sell signals of custom strategies; the second layer is the trading system, which is used to receive the output signals of the first layer, and filter the signals according to the agreed specifications. , Take Profit, Stop Loss, draw buy and sell signals and cost lines, define and send custom buy and sell alert messages to mobile phones, social software or trading interfaces. In general, this two-layer design is a flexible combination of "death and alive", which can meet the needs of most traders to quickly evaluate the performance of a certain technical indicator. The first layer here is flexible. Users can insert their own strategy codes according to my template, and they can draw buy and sell signals and output them to the second layer. The second layer is fixed, and the overall framework is solidified to ensure the stability and unity of the trading system. It is convenient to compare different or similar strategies under the same conditions. Finally, all trading signals are drawn on the chart, and the output strategy returns. test report.
The main function:
The first layer: "{Sextan} Your Indicator Source", the script provides a template for personalized strategy input, and the signal and definition interfaces ensure full compatibility with the second layer. Backtesting is performed stably in the backtesting framework of the layer. The first layer of this script is also relatively simple: enter your script in the highlighted custom script area, and after ensuring the final buy and sell signals long = bool condition, short = bool condition, the design of the first layer is considered complete. Input it into the PINE script editor of TradingView, save it and add it to the chart, you can see the pulse sequence in yellow (buy) and purple (sell) on the sub-picture, corresponding to the main picture, you can subjectively judge that the quality of the trading point of the strategy is good Bad.
The second layer: "{Sextan} PINEv4 Sextans Backtest Framework". This script is the standardized trading system strategy execution and alarm, used to generate the final report of the strategy backtest and some key indicators that I have customized that I find useful, such as: winning rate , Odds, Winning Surface, Kelly Ratio, Take Profit and Stop Loss Thresholds, Trading Frequency, etc. are evaluated according to the Kelly formula. To use the second layer, first load it into the TrainingView chart, no markers will appear on the chart, since you have not specified any strategy source signals, click on the gear-shaped setting next to the "{Sextan} PINEv4 Sextans BTFW" header button, you can open the backtest settings, the first item is to select your custom strategy source. Because we have added the strategy source to the chart in the previous step, you can easily find an option "{Sextan} Your Indicator Source: Signal" at the bottom of the list, this is the strategy source input we need, select and confirm , you can see various markers on the main graph, and quickly generate a backtesting profit graph and a list of backtesting reports. You can generate files and download the backtesting reports locally. You can also click the gear on the backtest chart interface to customize some conditions of the backtest, including: initial capital amount, currency type, percentage of each order placed, amount of pyramid additions, commission fees, slippage, etc. configuration. Note: The configuration in the interface dialog overrides the same configuration implemented by the code in the backtest script.
How to output charts:
The first layer: "{Sextan} Your Indicator Source", the output of this script is the pulse value of yellow and purple, yellow +1 means buy, purple -1 means sell.
The second layer: PINEv4 Sextans Backtest Framework". The output of this script is a bit complicated. After all, it is the entire trading system with a lot of information:
1. Blue and red arrows. The blue upward arrow indicates long position, the red downward arrow indicates short position, and the horizontal bar at the end of the purple arrow indicates take profit or stop loss exit.
2. Red and green lines. This is the holding cost line of the strategy, green represents the cost of holding a long position, and red represents the cost of holding a short position. The cost line is a continuous solid line and the price action is relatively close.
3. Green and yellow long take profit and stop loss area and green and yellow long take profit and stop loss fork. Once a long position is held, there is a conditional order for take profit and stop loss. The green horizontal line is the long take profit ratio line, and the yellow is the long stop loss ratio line; the green cross indicates the long take profit price, and the yellow cross indicates the long position. Stop loss price. It's worth noting that the prongs and wires don't necessarily go together. Because of the optimization of the algorithm, for a strong market, the take profit will occur after breaking the take profit line, and the profit will not be taken until the price falls.
4. The purple and red short take profit and stop loss area and the purple red short stop loss fork. Once a short position is held, there will be a take profit and stop loss conditional order, the red is the short take profit ratio line, and the purple is the short stop loss ratio line; the red cross indicates the short take profit price, and the purple cross indicates the short stop loss price.
5. In addition to the above signs, there are also text and numbers indicating the profit and loss values of long and short positions. "L" means long; "S" means short; "XL" means close long; "XS" means close short.
TradingView Strategy Tester Panel:
The overview graph is an intuitive graph that plots the blue (gain) and red (loss) curves of all backtest periods together, and notes: the absolute value and percentage of net profit, the number of all closed positions, the winning percentage, the profit factor, The maximum trading loss, the absolute value and ratio of the average trading profit and loss, and the average number of K-lines held in all trades.
Another is the performance summary. This is to display all long and short statistical indicators of backtesting in the form of a list, such as: net profit, gross profit, Sharpe ratio, maximum position, commission, times of profit and loss, etc.
Finally, the transaction list is a table indexed by the transaction serial number, showing the signal direction, date and time, price, profit and loss, accumulated profit and loss, maximum transaction profit, transaction loss and other values.
Remarks
Finally, I will explain that this is just the beginning of this model. I will continue to optimize the trading system of the second layer. Various optimization feedback and suggestions are welcome. For valuable feedback, I am willing to provide some L4/L5 technical indicators as rewards for free subscription rights.

[Sextan] B-Xtrender BacktestLevel: 1
NOTE: This is a request by @scantor516 to backtest B-Xtrender @PuppyTherapy by QuantTherapy with my Sextan framework. You can backtest many of my indicators in minutes now! Of course,you can define your own indicator in the highlighted area in compliance with the uniform format, which guarantee when you use "Indicator on Indicator" function, it would not produce any error.
Courtesy of QuantTherapy for his B-Xtrender @PuppyTherapy
Background
Backtesting of technical indicators and strategies is the most common way to understand a quantitative strategy. However, the complicated configuration and adaptation work of backtesting many quantitative tools makes many traders who do not understand the code daunted. Moreover, although I have written a lot of strategies, I am still not very satisfied with the backtest configuration and writing efficiency. Therefore, I have been thinking about how to build a backtesting framework that can quickly and easily evaluate the backtesting performance of any indicator with a "long/short entry" indicator, that is, a "simple backtesting tool for dummies". The performance requirements should be stable, and the operation should be simple and convenient. It is best to "copy", "paste", and "a few mouse clicks" to complete the quick backtest and evaluation of a new indicator.
Luckily, I recently realized that TradingView provides an "Indicator on Indicator" feature, which is the perfect foundation for doing "hot swap" backtesting. My basic idea is to use a two-layer design. The first layer is the technical indicator signal source that needs to be embedded, which is only used to provide buy and sell signals of custom strategies; the second layer is the trading system, which is used to receive the output signals of the first layer, and filter the signals according to the agreed specifications. , Take Profit, Stop Loss, draw buy and sell signals and cost lines, define and send custom buy and sell alert messages to mobile phones, social software or trading interfaces. In general, this two-layer design is a flexible combination of "death and alive", which can meet the needs of most traders to quickly evaluate the performance of a certain technical indicator. The first layer here is flexible. Users can insert their own strategy codes according to my template, and they can draw buy and sell signals and output them to the second layer. The second layer is fixed, and the overall framework is solidified to ensure the stability and unity of the trading system. It is convenient to compare different or similar strategies under the same conditions. Finally, all trading signals are drawn on the chart, and the output strategy returns. test report.
The main function:
The first layer: "{Sextan} Your Indicator Source", the script provides a template for personalized strategy input, and the signal and definition interfaces ensure full compatibility with the second layer. Backtesting is performed stably in the backtesting framework of the layer. The first layer of this script is also relatively simple: enter your script in the highlighted custom script area, and after ensuring the final buy and sell signals long = bool condition, short = bool condition, the design of the first layer is considered complete. Input it into the PINE script editor of TradingView, save it and add it to the chart, you can see the pulse sequence in yellow (buy) and purple (sell) on the sub-picture, corresponding to the main picture, you can subjectively judge that the quality of the trading point of the strategy is good Bad.
The second layer: "{Sextan} PINEv4 Sextans Backtest Framework". This script is the standardized trading system strategy execution and alarm, used to generate the final report of the strategy backtest and some key indicators that I have customized that I find useful, such as: winning rate , Odds, Winning Surface, Kelly Ratio, Take Profit and Stop Loss Thresholds, Trading Frequency, etc. are evaluated according to the Kelly formula. To use the second layer, first load it into the TrainingView chart, no markers will appear on the chart, since you have not specified any strategy source signals, click on the gear-shaped setting next to the "{Sextan} PINEv4 Sextans BTFW" header button, you can open the backtest settings, the first item is to select your custom strategy source. Because we have added the strategy source to the chart in the previous step, you can easily find an option "{Sextan} Your Indicator Source: Signal" at the bottom of the list, this is the strategy source input we need, select and confirm , you can see various markers on the main graph, and quickly generate a backtesting profit graph and a list of backtesting reports. You can generate files and download the backtesting reports locally. You can also click the gear on the backtest chart interface to customize some conditions of the backtest, including: initial capital amount, currency type, percentage of each order placed, amount of pyramid additions, commission fees, slippage, etc. configuration. Note: The configuration in the interface dialog overrides the same configuration implemented by the code in the backtest script.
How to output charts:
The first layer: "{Sextan} Your Indicator Source", the output of this script is the pulse value of yellow and purple, yellow +1 means buy, purple -1 means sell.
The second layer: PINEv4 Sextans Backtest Framework". The output of this script is a bit complicated. After all, it is the entire trading system with a lot of information:
1. Blue and red arrows. The blue upward arrow indicates long position, the red downward arrow indicates short position, and the horizontal bar at the end of the purple arrow indicates take profit or stop loss exit.
2. Red and green lines. This is the holding cost line of the strategy, green represents the cost of holding a long position, and red represents the cost of holding a short position. The cost line is a continuous solid line and the price action is relatively close.
3. Green and yellow long take profit and stop loss area and green and yellow long take profit and stop loss fork. Once a long position is held, there is a conditional order for take profit and stop loss. The green horizontal line is the long take profit ratio line, and the yellow is the long stop loss ratio line; the green cross indicates the long take profit price, and the yellow cross indicates the long position. Stop loss price. It's worth noting that the prongs and wires don't necessarily go together. Because of the optimization of the algorithm, for a strong market, the take profit will occur after breaking the take profit line, and the profit will not be taken until the price falls.
4. The purple and red short take profit and stop loss area and the purple red short stop loss fork. Once a short position is held, there will be a take profit and stop loss conditional order, the red is the short take profit ratio line, and the purple is the short stop loss ratio line; the red cross indicates the short take profit price, and the purple cross indicates the short stop loss price.
5. In addition to the above signs, there are also text and numbers indicating the profit and loss values of long and short positions. "L" means long; "S" means short; "XL" means close long; "XS" means close short.
TradingView Strategy Tester Panel:
The overview graph is an intuitive graph that plots the blue (gain) and red (loss) curves of all backtest periods together, and notes: the absolute value and percentage of net profit, the number of all closed positions, the winning percentage, the profit factor, The maximum trading loss, the absolute value and ratio of the average trading profit and loss, and the average number of K-lines held in all trades.
Another is the performance summary. This is to display all long and short statistical indicators of backtesting in the form of a list, such as: net profit, gross profit, Sharpe ratio, maximum position, commission, times of profit and loss, etc.
Finally, the transaction list is a table indexed by the transaction serial number, showing the signal direction, date and time, price, profit and loss, accumulated profit and loss, maximum transaction profit, transaction loss and other values.
Remarks
Finally, I will explain that this is just the beginning of this model. I will continue to optimize the trading system of the second layer. Various optimization feedback and suggestions are welcome. For valuable feedback, I am willing to provide some L4/L5 technical indicators as rewards for free subscription rights.

[Sextan] Haos Vieual BacktestLevel: 1
NOTE: This is a request by @scantor516 to backtest Haos Visual @PuppyTherapy by QuantTherapy with my Sextan framework. You can backtest many of my indicators in minutes now! Of course,you can define your own indicator in the highlighted area in compliance with the uniform format, which guarantee when you use "Indicator on Indicator" function, it would not produce any error.
Courtesy of QuantTherapy for his Haos Visual @PuppyTherapy
Background
Backtesting of technical indicators and strategies is the most common way to understand a quantitative strategy. However, the complicated configuration and adaptation work of backtesting many quantitative tools makes many traders who do not understand the code daunted. Moreover, although I have written a lot of strategies, I am still not very satisfied with the backtest configuration and writing efficiency. Therefore, I have been thinking about how to build a backtesting framework that can quickly and easily evaluate the backtesting performance of any indicator with a "long/short entry" indicator, that is, a "simple backtesting tool for dummies". The performance requirements should be stable, and the operation should be simple and convenient. It is best to "copy", "paste", and "a few mouse clicks" to complete the quick backtest and evaluation of a new indicator.
Luckily, I recently realized that TradingView provides an "Indicator on Indicator" feature, which is the perfect foundation for doing "hot swap" backtesting. My basic idea is to use a two-layer design. The first layer is the technical indicator signal source that needs to be embedded, which is only used to provide buy and sell signals of custom strategies; the second layer is the trading system, which is used to receive the output signals of the first layer, and filter the signals according to the agreed specifications. , Take Profit, Stop Loss, draw buy and sell signals and cost lines, define and send custom buy and sell alert messages to mobile phones, social software or trading interfaces. In general, this two-layer design is a flexible combination of "death and alive", which can meet the needs of most traders to quickly evaluate the performance of a certain technical indicator. The first layer here is flexible. Users can insert their own strategy codes according to my template, and they can draw buy and sell signals and output them to the second layer. The second layer is fixed, and the overall framework is solidified to ensure the stability and unity of the trading system. It is convenient to compare different or similar strategies under the same conditions. Finally, all trading signals are drawn on the chart, and the output strategy returns. test report.
The main function:
The first layer: "{Sextan} Your Indicator Source", the script provides a template for personalized strategy input, and the signal and definition interfaces ensure full compatibility with the second layer. Backtesting is performed stably in the backtesting framework of the layer. The first layer of this script is also relatively simple: enter your script in the highlighted custom script area, and after ensuring the final buy and sell signals long = bool condition, short = bool condition, the design of the first layer is considered complete. Input it into the PINE script editor of TradingView, save it and add it to the chart, you can see the pulse sequence in yellow (buy) and purple (sell) on the sub-picture, corresponding to the main picture, you can subjectively judge that the quality of the trading point of the strategy is good Bad.
The second layer: "{Sextan} PINEv4 Sextans Backtest Framework". This script is the standardized trading system strategy execution and alarm, used to generate the final report of the strategy backtest and some key indicators that I have customized that I find useful, such as: winning rate , Odds, Winning Surface, Kelly Ratio, Take Profit and Stop Loss Thresholds, Trading Frequency, etc. are evaluated according to the Kelly formula. To use the second layer, first load it into the TrainingView chart, no markers will appear on the chart, since you have not specified any strategy source signals, click on the gear-shaped setting next to the "{Sextan} PINEv4 Sextans BTFW" header button, you can open the backtest settings, the first item is to select your custom strategy source. Because we have added the strategy source to the chart in the previous step, you can easily find an option "{Sextan} Your Indicator Source: Signal" at the bottom of the list, this is the strategy source input we need, select and confirm , you can see various markers on the main graph, and quickly generate a backtesting profit graph and a list of backtesting reports. You can generate files and download the backtesting reports locally. You can also click the gear on the backtest chart interface to customize some conditions of the backtest, including: initial capital amount, currency type, percentage of each order placed, amount of pyramid additions, commission fees, slippage, etc. configuration. Note: The configuration in the interface dialog overrides the same configuration implemented by the code in the backtest script.
How to output charts:
The first layer: "{Sextan} Your Indicator Source", the output of this script is the pulse value of yellow and purple, yellow +1 means buy, purple -1 means sell.
The second layer: PINEv4 Sextans Backtest Framework". The output of this script is a bit complicated. After all, it is the entire trading system with a lot of information:
1. Blue and red arrows. The blue upward arrow indicates long position, the red downward arrow indicates short position, and the horizontal bar at the end of the purple arrow indicates take profit or stop loss exit.
2. Red and green lines. This is the holding cost line of the strategy, green represents the cost of holding a long position, and red represents the cost of holding a short position. The cost line is a continuous solid line and the price action is relatively close.
3. Green and yellow long take profit and stop loss area and green and yellow long take profit and stop loss fork. Once a long position is held, there is a conditional order for take profit and stop loss. The green horizontal line is the long take profit ratio line, and the yellow is the long stop loss ratio line; the green cross indicates the long take profit price, and the yellow cross indicates the long position. Stop loss price. It's worth noting that the prongs and wires don't necessarily go together. Because of the optimization of the algorithm, for a strong market, the take profit will occur after breaking the take profit line, and the profit will not be taken until the price falls.
4. The purple and red short take profit and stop loss area and the purple red short stop loss fork. Once a short position is held, there will be a take profit and stop loss conditional order, the red is the short take profit ratio line, and the purple is the short stop loss ratio line; the red cross indicates the short take profit price, and the purple cross indicates the short stop loss price.
5. In addition to the above signs, there are also text and numbers indicating the profit and loss values of long and short positions. "L" means long; "S" means short; "XL" means close long; "XS" means close short.
TradingView Strategy Tester Panel:
The overview graph is an intuitive graph that plots the blue (gain) and red (loss) curves of all backtest periods together, and notes: the absolute value and percentage of net profit, the number of all closed positions, the winning percentage, the profit factor, The maximum trading loss, the absolute value and ratio of the average trading profit and loss, and the average number of K-lines held in all trades.
Another is the performance summary. This is to display all long and short statistical indicators of backtesting in the form of a list, such as: net profit, gross profit, Sharpe ratio, maximum position, commission, times of profit and loss, etc.
Finally, the transaction list is a table indexed by the transaction serial number, showing the signal direction, date and time, price, profit and loss, accumulated profit and loss, maximum transaction profit, transaction loss and other values.
Remarks
Finally, I will explain that this is just the beginning of this model. I will continue to optimize the trading system of the second layer. Various optimization feedback and suggestions are welcome. For valuable feedback, I am willing to provide some L4/L5 technical indicators as rewards for free subscription rights.

[Sextan] Delta-RSI Oscillator BacktestLevel: 1
NOTE: This is a request by @scantor516 to backtest Delta-RSI Oscillator by tbiktag with my Sextan framework. You can backtest many of my indicators in minutes now! Of course,you can define your own indicator in the highlighted area in compliance with the uniform format, which guarantee when you use "Indicator on Indicator" function, it would not produce any error.
Courtesy of tbiktag for his Delta-RSI Oscillator Strategy
Background
Backtesting of technical indicators and strategies is the most common way to understand a quantitative strategy. However, the complicated configuration and adaptation work of backtesting many quantitative tools makes many traders who do not understand the code daunted. Moreover, although I have written a lot of strategies, I am still not very satisfied with the backtest configuration and writing efficiency. Therefore, I have been thinking about how to build a backtesting framework that can quickly and easily evaluate the backtesting performance of any indicator with a "long/short entry" indicator, that is, a "simple backtesting tool for dummies". The performance requirements should be stable, and the operation should be simple and convenient. It is best to "copy", "paste", and "a few mouse clicks" to complete the quick backtest and evaluation of a new indicator.
Luckily, I recently realized that TradingView provides an "Indicator on Indicator" feature, which is the perfect foundation for doing "hot swap" backtesting. My basic idea is to use a two-layer design. The first layer is the technical indicator signal source that needs to be embedded, which is only used to provide buy and sell signals of custom strategies; the second layer is the trading system, which is used to receive the output signals of the first layer, and filter the signals according to the agreed specifications. , Take Profit, Stop Loss, draw buy and sell signals and cost lines, define and send custom buy and sell alert messages to mobile phones, social software or trading interfaces. In general, this two-layer design is a flexible combination of "death and alive", which can meet the needs of most traders to quickly evaluate the performance of a certain technical indicator. The first layer here is flexible. Users can insert their own strategy codes according to my template, and they can draw buy and sell signals and output them to the second layer. The second layer is fixed, and the overall framework is solidified to ensure the stability and unity of the trading system. It is convenient to compare different or similar strategies under the same conditions. Finally, all trading signals are drawn on the chart, and the output strategy returns. test report.
The main function:
The first layer: "{Sextan} Your Indicator Source", the script provides a template for personalized strategy input, and the signal and definition interfaces ensure full compatibility with the second layer. Backtesting is performed stably in the backtesting framework of the layer. The first layer of this script is also relatively simple: enter your script in the highlighted custom script area, and after ensuring the final buy and sell signals long = bool condition, short = bool condition, the design of the first layer is considered complete. Input it into the PINE script editor of TradingView, save it and add it to the chart, you can see the pulse sequence in yellow (buy) and purple (sell) on the sub-picture, corresponding to the main picture, you can subjectively judge that the quality of the trading point of the strategy is good Bad.
The second layer: "{Sextan} PINEv4 Sextans Backtest Framework". This script is the standardized trading system strategy execution and alarm, used to generate the final report of the strategy backtest and some key indicators that I have customized that I find useful, such as: winning rate , Odds, Winning Surface, Kelly Ratio, Take Profit and Stop Loss Thresholds, Trading Frequency, etc. are evaluated according to the Kelly formula. To use the second layer, first load it into the TrainingView chart, no markers will appear on the chart, since you have not specified any strategy source signals, click on the gear-shaped setting next to the "{Sextan} PINEv4 Sextans BTFW" header button, you can open the backtest settings, the first item is to select your custom strategy source. Because we have added the strategy source to the chart in the previous step, you can easily find an option "{Sextan} Your Indicator Source: Signal" at the bottom of the list, this is the strategy source input we need, select and confirm , you can see various markers on the main graph, and quickly generate a backtesting profit graph and a list of backtesting reports. You can generate files and download the backtesting reports locally. You can also click the gear on the backtest chart interface to customize some conditions of the backtest, including: initial capital amount, currency type, percentage of each order placed, amount of pyramid additions, commission fees, slippage, etc. configuration. Note: The configuration in the interface dialog overrides the same configuration implemented by the code in the backtest script.
How to output charts:
The first layer: "{Sextan} Your Indicator Source", the output of this script is the pulse value of yellow and purple, yellow +1 means buy, purple -1 means sell.
The second layer: PINEv4 Sextans Backtest Framework". The output of this script is a bit complicated. After all, it is the entire trading system with a lot of information:
1. Blue and red arrows. The blue upward arrow indicates long position, the red downward arrow indicates short position, and the horizontal bar at the end of the purple arrow indicates take profit or stop loss exit.
2. Red and green lines. This is the holding cost line of the strategy, green represents the cost of holding a long position, and red represents the cost of holding a short position. The cost line is a continuous solid line and the price action is relatively close.
3. Green and yellow long take profit and stop loss area and green and yellow long take profit and stop loss fork. Once a long position is held, there is a conditional order for take profit and stop loss. The green horizontal line is the long take profit ratio line, and the yellow is the long stop loss ratio line; the green cross indicates the long take profit price, and the yellow cross indicates the long position. Stop loss price. It's worth noting that the prongs and wires don't necessarily go together. Because of the optimization of the algorithm, for a strong market, the take profit will occur after breaking the take profit line, and the profit will not be taken until the price falls.
4. The purple and red short take profit and stop loss area and the purple red short stop loss fork. Once a short position is held, there will be a take profit and stop loss conditional order, the red is the short take profit ratio line, and the purple is the short stop loss ratio line; the red cross indicates the short take profit price, and the purple cross indicates the short stop loss price.
5. In addition to the above signs, there are also text and numbers indicating the profit and loss values of long and short positions. "L" means long; "S" means short; "XL" means close long; "XS" means close short.
TradingView Strategy Tester Panel:
The overview graph is an intuitive graph that plots the blue (gain) and red (loss) curves of all backtest periods together, and notes: the absolute value and percentage of net profit, the number of all closed positions, the winning percentage, the profit factor, The maximum trading loss, the absolute value and ratio of the average trading profit and loss, and the average number of K-lines held in all trades.
Another is the performance summary. This is to display all long and short statistical indicators of backtesting in the form of a list, such as: net profit, gross profit, Sharpe ratio, maximum position, commission, times of profit and loss, etc.
Finally, the transaction list is a table indexed by the transaction serial number, showing the signal direction, date and time, price, profit and loss, accumulated profit and loss, maximum transaction profit, transaction loss and other values.
Remarks
Finally, I will explain that this is just the beginning of this model. I will continue to optimize the trading system of the second layer. Various optimization feedback and suggestions are welcome. For valuable feedback, I am willing to provide some L4/L5 technical indicators as rewards for free subscription rights.

[Sextan] Supertrend - Ladder ATR BacktestLevel: 1
NOTE: This is a request by @upslidedown to backtest Supertrend - Ladder ATR by HeWhoMustNotBeNamed with my Sextan framework. You can backtest many of my indicators in minutes now! Of course,you can define your own indicator in the highlighted area in compliance with the uniform format, which guarantee when you use "Indicator on Indicator" function, it would not produce any error.
Courtesy of HeWhoMustNotBeNamed for his Supertrend - Ladder ATR indicator
Background
Backtesting of technical indicators and strategies is the most common way to understand a quantitative strategy. However, the complicated configuration and adaptation work of backtesting many quantitative tools makes many traders who do not understand the code daunted. Moreover, although I have written a lot of strategies, I am still not very satisfied with the backtest configuration and writing efficiency. Therefore, I have been thinking about how to build a backtesting framework that can quickly and easily evaluate the backtesting performance of any indicator with a "long/short entry" indicator, that is, a "simple backtesting tool for dummies". The performance requirements should be stable, and the operation should be simple and convenient. It is best to "copy", "paste", and "a few mouse clicks" to complete the quick backtest and evaluation of a new indicator.
Luckily, I recently realized that TradingView provides an "Indicator on Indicator" feature, which is the perfect foundation for doing "hot swap" backtesting. My basic idea is to use a two-layer design. The first layer is the technical indicator signal source that needs to be embedded, which is only used to provide buy and sell signals of custom strategies; the second layer is the trading system, which is used to receive the output signals of the first layer, and filter the signals according to the agreed specifications. , Take Profit, Stop Loss, draw buy and sell signals and cost lines, define and send custom buy and sell alert messages to mobile phones, social software or trading interfaces. In general, this two-layer design is a flexible combination of "death and alive", which can meet the needs of most traders to quickly evaluate the performance of a certain technical indicator. The first layer here is flexible. Users can insert their own strategy codes according to my template, and they can draw buy and sell signals and output them to the second layer. The second layer is fixed, and the overall framework is solidified to ensure the stability and unity of the trading system. It is convenient to compare different or similar strategies under the same conditions. Finally, all trading signals are drawn on the chart, and the output strategy returns. test report.
The main function:
The first layer: "{Sextan} Your Indicator Source", the script provides a template for personalized strategy input, and the signal and definition interfaces ensure full compatibility with the second layer. Backtesting is performed stably in the backtesting framework of the layer. The first layer of this script is also relatively simple: enter your script in the highlighted custom script area, and after ensuring the final buy and sell signals long = bool condition, short = bool condition, the design of the first layer is considered complete. Input it into the PINE script editor of TradingView, save it and add it to the chart, you can see the pulse sequence in yellow (buy) and purple (sell) on the sub-picture, corresponding to the main picture, you can subjectively judge that the quality of the trading point of the strategy is good Bad.
The second layer: "{Sextan} PINEv4 Sextans Backtest Framework". This script is the standardized trading system strategy execution and alarm, used to generate the final report of the strategy backtest and some key indicators that I have customized that I find useful, such as: winning rate , Odds, Winning Surface, Kelly Ratio, Take Profit and Stop Loss Thresholds, Trading Frequency, etc. are evaluated according to the Kelly formula. To use the second layer, first load it into the TrainingView chart, no markers will appear on the chart, since you have not specified any strategy source signals, click on the gear-shaped setting next to the "{Sextan} PINEv4 Sextans BTFW" header button, you can open the backtest settings, the first item is to select your custom strategy source. Because we have added the strategy source to the chart in the previous step, you can easily find an option "{Sextan} Your Indicator Source: Signal" at the bottom of the list, this is the strategy source input we need, select and confirm , you can see various markers on the main graph, and quickly generate a backtesting profit graph and a list of backtesting reports. You can generate files and download the backtesting reports locally. You can also click the gear on the backtest chart interface to customize some conditions of the backtest, including: initial capital amount, currency type, percentage of each order placed, amount of pyramid additions, commission fees, slippage, etc. configuration. Note: The configuration in the interface dialog overrides the same configuration implemented by the code in the backtest script.
How to output charts:
The first layer: "{Sextan} Your Indicator Source", the output of this script is the pulse value of yellow and purple, yellow +1 means buy, purple -1 means sell.
The second layer: PINEv4 Sextans Backtest Framework". The output of this script is a bit complicated. After all, it is the entire trading system with a lot of information:
1. Blue and red arrows. The blue upward arrow indicates long position, the red downward arrow indicates short position, and the horizontal bar at the end of the purple arrow indicates take profit or stop loss exit.
2. Red and green lines. This is the holding cost line of the strategy, green represents the cost of holding a long position, and red represents the cost of holding a short position. The cost line is a continuous solid line and the price action is relatively close.
3. Green and yellow long take profit and stop loss area and green and yellow long take profit and stop loss fork. Once a long position is held, there is a conditional order for take profit and stop loss. The green horizontal line is the long take profit ratio line, and the yellow is the long stop loss ratio line; the green cross indicates the long take profit price, and the yellow cross indicates the long position. Stop loss price. It's worth noting that the prongs and wires don't necessarily go together. Because of the optimization of the algorithm, for a strong market, the take profit will occur after breaking the take profit line, and the profit will not be taken until the price falls.
4. The purple and red short take profit and stop loss area and the purple red short stop loss fork. Once a short position is held, there will be a take profit and stop loss conditional order, the red is the short take profit ratio line, and the purple is the short stop loss ratio line; the red cross indicates the short take profit price, and the purple cross indicates the short stop loss price.
5. In addition to the above signs, there are also text and numbers indicating the profit and loss values of long and short positions. "L" means long; "S" means short; "XL" means close long; "XS" means close short.
TradingView Strategy Tester Panel:
The overview graph is an intuitive graph that plots the blue (gain) and red (loss) curves of all backtest periods together, and notes: the absolute value and percentage of net profit, the number of all closed positions, the winning percentage, the profit factor, The maximum trading loss, the absolute value and ratio of the average trading profit and loss, and the average number of K-lines held in all trades.
Another is the performance summary. This is to display all long and short statistical indicators of backtesting in the form of a list, such as: net profit, gross profit, Sharpe ratio, maximum position, commission, times of profit and loss, etc.
Finally, the transaction list is a table indexed by the transaction serial number, showing the signal direction, date and time, price, profit and loss, accumulated profit and loss, maximum transaction profit, transaction loss and other values.
Remarks
Finally, I will explain that this is just the beginning of this model. I will continue to optimize the trading system of the second layer. Various optimization feedback and suggestions are welcome. For valuable feedback, I am willing to provide some L4/L5 technical indicators as rewards for free subscription rights.

[Sextan] Hull MA BacktestLevel: 1
NOTE: This is a request by @babaa to backtest Hull suite by InSilico with my Sextan framework. You can backtest many of my indicators in minutes now! Of course,you can define your own indicator in the highlighted area in compliance with the uniform format, which guarantee when you use "Indicator on Indicator" function, it would not produce any error.
Courtesy of InSilico for his Hull suite indicator
Background
Backtesting of technical indicators and strategies is the most common way to understand a quantitative strategy. However, the complicated configuration and adaptation work of backtesting many quantitative tools makes many traders who do not understand the code daunted. Moreover, although I have written a lot of strategies, I am still not very satisfied with the backtest configuration and writing efficiency. Therefore, I have been thinking about how to build a backtesting framework that can quickly and easily evaluate the backtesting performance of any indicator with a "long/short entry" indicator, that is, a "simple backtesting tool for dummies". The performance requirements should be stable, and the operation should be simple and convenient. It is best to "copy", "paste", and "a few mouse clicks" to complete the quick backtest and evaluation of a new indicator.
Luckily, I recently realized that TradingView provides an "Indicator on Indicator" feature, which is the perfect foundation for doing "hot swap" backtesting. My basic idea is to use a two-layer design. The first layer is the technical indicator signal source that needs to be embedded, which is only used to provide buy and sell signals of custom strategies; the second layer is the trading system, which is used to receive the output signals of the first layer, and filter the signals according to the agreed specifications. , Take Profit, Stop Loss, draw buy and sell signals and cost lines, define and send custom buy and sell alert messages to mobile phones, social software or trading interfaces. In general, this two-layer design is a flexible combination of "death and alive", which can meet the needs of most traders to quickly evaluate the performance of a certain technical indicator. The first layer here is flexible. Users can insert their own strategy codes according to my template, and they can draw buy and sell signals and output them to the second layer. The second layer is fixed, and the overall framework is solidified to ensure the stability and unity of the trading system. It is convenient to compare different or similar strategies under the same conditions. Finally, all trading signals are drawn on the chart, and the output strategy returns. test report.
The main function:
The first layer: "{Sextan} Your Indicator Source", the script provides a template for personalized strategy input, and the signal and definition interfaces ensure full compatibility with the second layer. Backtesting is performed stably in the backtesting framework of the layer. The first layer of this script is also relatively simple: enter your script in the highlighted custom script area, and after ensuring the final buy and sell signals long = bool condition, short = bool condition, the design of the first layer is considered complete. Input it into the PINE script editor of TradingView, save it and add it to the chart, you can see the pulse sequence in yellow (buy) and purple (sell) on the sub-picture, corresponding to the main picture, you can subjectively judge that the quality of the trading point of the strategy is good Bad.
The second layer: "{Sextan} PINEv4 Sextans Backtest Framework". This script is the standardized trading system strategy execution and alarm, used to generate the final report of the strategy backtest and some key indicators that I have customized that I find useful, such as: winning rate , Odds, Winning Surface, Kelly Ratio, Take Profit and Stop Loss Thresholds, Trading Frequency, etc. are evaluated according to the Kelly formula. To use the second layer, first load it into the TrainingView chart, no markers will appear on the chart, since you have not specified any strategy source signals, click on the gear-shaped setting next to the "{Sextan} PINEv4 Sextans BTFW" header button, you can open the backtest settings, the first item is to select your custom strategy source. Because we have added the strategy source to the chart in the previous step, you can easily find an option "{Sextan} Your Indicator Source: Signal" at the bottom of the list, this is the strategy source input we need, select and confirm , you can see various markers on the main graph, and quickly generate a backtesting profit graph and a list of backtesting reports. You can generate files and download the backtesting reports locally. You can also click the gear on the backtest chart interface to customize some conditions of the backtest, including: initial capital amount, currency type, percentage of each order placed, amount of pyramid additions, commission fees, slippage, etc. configuration. Note: The configuration in the interface dialog overrides the same configuration implemented by the code in the backtest script.
How to output charts:
The first layer: "{Sextan} Your Indicator Source", the output of this script is the pulse value of yellow and purple, yellow +1 means buy, purple -1 means sell.
The second layer: PINEv4 Sextans Backtest Framework". The output of this script is a bit complicated. After all, it is the entire trading system with a lot of information:
1. Blue and red arrows. The blue upward arrow indicates long position, the red downward arrow indicates short position, and the horizontal bar at the end of the purple arrow indicates take profit or stop loss exit.
2. Red and green lines. This is the holding cost line of the strategy, green represents the cost of holding a long position, and red represents the cost of holding a short position. The cost line is a continuous solid line and the price action is relatively close.
3. Green and yellow long take profit and stop loss area and green and yellow long take profit and stop loss fork. Once a long position is held, there is a conditional order for take profit and stop loss. The green horizontal line is the long take profit ratio line, and the yellow is the long stop loss ratio line; the green cross indicates the long take profit price, and the yellow cross indicates the long position. Stop loss price. It's worth noting that the prongs and wires don't necessarily go together. Because of the optimization of the algorithm, for a strong market, the take profit will occur after breaking the take profit line, and the profit will not be taken until the price falls.
4. The purple and red short take profit and stop loss area and the purple red short stop loss fork. Once a short position is held, there will be a take profit and stop loss conditional order, the red is the short take profit ratio line, and the purple is the short stop loss ratio line; the red cross indicates the short take profit price, and the purple cross indicates the short stop loss price.
5. In addition to the above signs, there are also text and numbers indicating the profit and loss values of long and short positions. "L" means long; "S" means short; "XL" means close long; "XS" means close short.
TradingView Strategy Tester Panel:
The overview graph is an intuitive graph that plots the blue (gain) and red (loss) curves of all backtest periods together, and notes: the absolute value and percentage of net profit, the number of all closed positions, the winning percentage, the profit factor, The maximum trading loss, the absolute value and ratio of the average trading profit and loss, and the average number of K-lines held in all trades.
Another is the performance summary. This is to display all long and short statistical indicators of backtesting in the form of a list, such as: net profit, gross profit, Sharpe ratio, maximum position, commission, times of profit and loss, etc.
Finally, the transaction list is a table indexed by the transaction serial number, showing the signal direction, date and time, price, profit and loss, accumulated profit and loss, maximum transaction profit, transaction loss and other values.
Remarks
Finally, I will explain that this is just the beginning of this model. I will continue to optimize the trading system of the second layer. Various optimization feedback and suggestions are welcome. For valuable feedback, I am willing to provide some L4/L5 technical indicators as rewards for free subscription rights.

[Sextan] Fisher Transform BacktestLevel: 1
NOTE: This is a request by @Uni_ve12se to backtest Ehlers Fisher Transform by cheatcountry with my Sextan framework. I ONLY take 5 minutes to perform it and how much time would you cost for this work? You can backtest many of my indicators in minutes now! Of course,you can define your own indicator in the highlighted area in compliance with the uniform format, which guarantee when you use "Indicator on Indicator" function, it would not produce any error.
Courtesy of cheatcountry for his Ehlers Fisher Transform indicator
Background
Backtesting of technical indicators and strategies is the most common way to understand a quantitative strategy. However, the complicated configuration and adaptation work of backtesting many quantitative tools makes many traders who do not understand the code daunted. Moreover, although I have written a lot of strategies, I am still not very satisfied with the backtest configuration and writing efficiency. Therefore, I have been thinking about how to build a backtesting framework that can quickly and easily evaluate the backtesting performance of any indicator with a "long/short entry" indicator, that is, a "simple backtesting tool for dummies". The performance requirements should be stable, and the operation should be simple and convenient. It is best to "copy", "paste", and "a few mouse clicks" to complete the quick backtest and evaluation of a new indicator.
Luckily, I recently realized that TradingView provides an "Indicator on Indicator" feature, which is the perfect foundation for doing "hot swap" backtesting. My basic idea is to use a two-layer design. The first layer is the technical indicator signal source that needs to be embedded, which is only used to provide buy and sell signals of custom strategies; the second layer is the trading system, which is used to receive the output signals of the first layer, and filter the signals according to the agreed specifications. , Take Profit, Stop Loss, draw buy and sell signals and cost lines, define and send custom buy and sell alert messages to mobile phones, social software or trading interfaces. In general, this two-layer design is a flexible combination of "death and alive", which can meet the needs of most traders to quickly evaluate the performance of a certain technical indicator. The first layer here is flexible. Users can insert their own strategy codes according to my template, and they can draw buy and sell signals and output them to the second layer. The second layer is fixed, and the overall framework is solidified to ensure the stability and unity of the trading system. It is convenient to compare different or similar strategies under the same conditions. Finally, all trading signals are drawn on the chart, and the output strategy returns. test report.
The main function:
The first layer: "{Sextan} Your Indicator Source", the script provides a template for personalized strategy input, and the signal and definition interfaces ensure full compatibility with the second layer. Backtesting is performed stably in the backtesting framework of the layer. The first layer of this script is also relatively simple: enter your script in the highlighted custom script area, and after ensuring the final buy and sell signals long = bool condition, short = bool condition, the design of the first layer is considered complete. Input it into the PINE script editor of TradingView, save it and add it to the chart, you can see the pulse sequence in yellow (buy) and purple (sell) on the sub-picture, corresponding to the main picture, you can subjectively judge that the quality of the trading point of the strategy is good Bad.
The second layer: "{Sextan} PINEv4 Sextans Backtest Framework". This script is the standardized trading system strategy execution and alarm, used to generate the final report of the strategy backtest and some key indicators that I have customized that I find useful, such as: winning rate , Odds, Winning Surface, Kelly Ratio, Take Profit and Stop Loss Thresholds, Trading Frequency, etc. are evaluated according to the Kelly formula. To use the second layer, first load it into the TrainingView chart, no markers will appear on the chart, since you have not specified any strategy source signals, click on the gear-shaped setting next to the "{Sextan} PINEv4 Sextans BTFW" header button, you can open the backtest settings, the first item is to select your custom strategy source. Because we have added the strategy source to the chart in the previous step, you can easily find an option "{Sextan} Your Indicator Source: Signal" at the bottom of the list, this is the strategy source input we need, select and confirm , you can see various markers on the main graph, and quickly generate a backtesting profit graph and a list of backtesting reports. You can generate files and download the backtesting reports locally. You can also click the gear on the backtest chart interface to customize some conditions of the backtest, including: initial capital amount, currency type, percentage of each order placed, amount of pyramid additions, commission fees, slippage, etc. configuration. Note: The configuration in the interface dialog overrides the same configuration implemented by the code in the backtest script.
How to output charts:
The first layer: "{Sextan} Your Indicator Source", the output of this script is the pulse value of yellow and purple, yellow +1 means buy, purple -1 means sell.
The second layer: PINEv4 Sextans Backtest Framework". The output of this script is a bit complicated. After all, it is the entire trading system with a lot of information:
1. Blue and red arrows. The blue upward arrow indicates long position, the red downward arrow indicates short position, and the horizontal bar at the end of the purple arrow indicates take profit or stop loss exit.
2. Red and green lines. This is the holding cost line of the strategy, green represents the cost of holding a long position, and red represents the cost of holding a short position. The cost line is a continuous solid line and the price action is relatively close.
3. Green and yellow long take profit and stop loss area and green and yellow long take profit and stop loss fork. Once a long position is held, there is a conditional order for take profit and stop loss. The green horizontal line is the long take profit ratio line, and the yellow is the long stop loss ratio line; the green cross indicates the long take profit price, and the yellow cross indicates the long position. Stop loss price. It's worth noting that the prongs and wires don't necessarily go together. Because of the optimization of the algorithm, for a strong market, the take profit will occur after breaking the take profit line, and the profit will not be taken until the price falls.
4. The purple and red short take profit and stop loss area and the purple red short stop loss fork. Once a short position is held, there will be a take profit and stop loss conditional order, the red is the short take profit ratio line, and the purple is the short stop loss ratio line; the red cross indicates the short take profit price, and the purple cross indicates the short stop loss price.
5. In addition to the above signs, there are also text and numbers indicating the profit and loss values of long and short positions. "L" means long; "S" means short; "XL" means close long; "XS" means close short.
TradingView Strategy Tester Panel:
The overview graph is an intuitive graph that plots the blue (gain) and red (loss) curves of all backtest periods together, and notes: the absolute value and percentage of net profit, the number of all closed positions, the winning percentage, the profit factor, The maximum trading loss, the absolute value and ratio of the average trading profit and loss, and the average number of K-lines held in all trades.
Another is the performance summary. This is to display all long and short statistical indicators of backtesting in the form of a list, such as: net profit, gross profit, Sharpe ratio, maximum position, commission, times of profit and loss, etc.
Finally, the transaction list is a table indexed by the transaction serial number, showing the signal direction, date and time, price, profit and loss, accumulated profit and loss, maximum transaction profit, transaction loss and other values.
Remarks
Finally, I will explain that this is just the beginning of this model. I will continue to optimize the trading system of the second layer. Various optimization feedback and suggestions are welcome. For valuable feedback, I am willing to provide some L4/L5 technical indicators as rewards for free subscription rights.

[Sextan] M-Oscillator BacktestLevel: 1
NOTE: This is a request by @scantor516 to backtest M-Oscillator by Mango2Juice with my Sextan framework. I ONLY take 5 minutes to perform it and how much time would you cost for this work?
Courtesy of Mango2Juice for M-Oscillator script.
You can backtest many of my indicators in minutes now! Of course,you can define your own indicator in the highlighted area in compliance with the uniform format, which guarantee when you use "Indicator on Indicator" function, it would not produce any error.
Background
Backtesting of technical indicators and strategies is the most common way to understand a quantitative strategy. However, the complicated configuration and adaptation work of backtesting many quantitative tools makes many traders who do not understand the code daunted. Moreover, although I have written a lot of strategies, I am still not very satisfied with the backtest configuration and writing efficiency. Therefore, I have been thinking about how to build a backtesting framework that can quickly and easily evaluate the backtesting performance of any indicator with a "long/short entry" indicator, that is, a "simple backtesting tool for dummies". The performance requirements should be stable, and the operation should be simple and convenient. It is best to "copy", "paste", and "a few mouse clicks" to complete the quick backtest and evaluation of a new indicator.
Luckily, I recently realized that TradingView provides an "Indicator on Indicator" feature, which is the perfect foundation for doing "hot swap" backtesting. My basic idea is to use a two-layer design. The first layer is the technical indicator signal source that needs to be embedded, which is only used to provide buy and sell signals of custom strategies; the second layer is the trading system, which is used to receive the output signals of the first layer, and filter the signals according to the agreed specifications. , Take Profit, Stop Loss, draw buy and sell signals and cost lines, define and send custom buy and sell alert messages to mobile phones, social software or trading interfaces. In general, this two-layer design is a flexible combination of "death and alive", which can meet the needs of most traders to quickly evaluate the performance of a certain technical indicator. The first layer here is flexible. Users can insert their own strategy codes according to my template, and they can draw buy and sell signals and output them to the second layer. The second layer is fixed, and the overall framework is solidified to ensure the stability and unity of the trading system. It is convenient to compare different or similar strategies under the same conditions. Finally, all trading signals are drawn on the chart, and the output strategy returns. test report.
The main function:
The first layer: "{Sextan} Your Indicator Source", the script provides a template for personalized strategy input, and the signal and definition interfaces ensure full compatibility with the second layer. Backtesting is performed stably in the backtesting framework of the layer. The first layer of this script is also relatively simple: enter your script in the highlighted custom script area, and after ensuring the final buy and sell signals long = bool condition, short = bool condition, the design of the first layer is considered complete. Input it into the PINE script editor of TradingView, save it and add it to the chart, you can see the pulse sequence in yellow (buy) and purple (sell) on the sub-picture, corresponding to the main picture, you can subjectively judge that the quality of the trading point of the strategy is good Bad.
The second layer: "{Sextan} PINEv4 Sextans Backtest Framework". This script is the standardized trading system strategy execution and alarm, used to generate the final report of the strategy backtest and some key indicators that I have customized that I find useful, such as: winning rate , Odds, Winning Surface, Kelly Ratio, Take Profit and Stop Loss Thresholds, Trading Frequency, etc. are evaluated according to the Kelly formula. To use the second layer, first load it into the TrainingView chart, no markers will appear on the chart, since you have not specified any strategy source signals, click on the gear-shaped setting next to the "{Sextan} PINEv4 Sextans BTFW" header button, you can open the backtest settings, the first item is to select your custom strategy source. Because we have added the strategy source to the chart in the previous step, you can easily find an option "{Sextan} Your Indicator Source: Signal" at the bottom of the list, this is the strategy source input we need, select and confirm , you can see various markers on the main graph, and quickly generate a backtesting profit graph and a list of backtesting reports. You can generate files and download the backtesting reports locally. You can also click the gear on the backtest chart interface to customize some conditions of the backtest, including: initial capital amount, currency type, percentage of each order placed, amount of pyramid additions, commission fees, slippage, etc. configuration. Note: The configuration in the interface dialog overrides the same configuration implemented by the code in the backtest script.
How to output charts:
The first layer: "{Sextan} Your Indicator Source", the output of this script is the pulse value of yellow and purple, yellow +1 means buy, purple -1 means sell.
The second layer: PINEv4 Sextans Backtest Framework". The output of this script is a bit complicated. After all, it is the entire trading system with a lot of information:
1. Blue and red arrows. The blue upward arrow indicates long position, the red downward arrow indicates short position, and the horizontal bar at the end of the purple arrow indicates take profit or stop loss exit.
2. Red and green lines. This is the holding cost line of the strategy, green represents the cost of holding a long position, and red represents the cost of holding a short position. The cost line is a continuous solid line and the price action is relatively close.
3. Green and yellow long take profit and stop loss area and green and yellow long take profit and stop loss fork. Once a long position is held, there is a conditional order for take profit and stop loss. The green horizontal line is the long take profit ratio line, and the yellow is the long stop loss ratio line; the green cross indicates the long take profit price, and the yellow cross indicates the long position. Stop loss price. It's worth noting that the prongs and wires don't necessarily go together. Because of the optimization of the algorithm, for a strong market, the take profit will occur after breaking the take profit line, and the profit will not be taken until the price falls.
4. The purple and red short take profit and stop loss area and the purple red short stop loss fork. Once a short position is held, there will be a take profit and stop loss conditional order, the red is the short take profit ratio line, and the purple is the short stop loss ratio line; the red cross indicates the short take profit price, and the purple cross indicates the short stop loss price.
5. In addition to the above signs, there are also text and numbers indicating the profit and loss values of long and short positions. "L" means long; "S" means short; "XL" means close long; "XS" means close short.
TradingView Strategy Tester Panel:
The overview graph is an intuitive graph that plots the blue (gain) and red (loss) curves of all backtest periods together, and notes: the absolute value and percentage of net profit, the number of all closed positions, the winning percentage, the profit factor, The maximum trading loss, the absolute value and ratio of the average trading profit and loss, and the average number of K-lines held in all trades.
Another is the performance summary. This is to display all long and short statistical indicators of backtesting in the form of a list, such as: net profit, gross profit, Sharpe ratio, maximum position, commission, times of profit and loss, etc.
Finally, the transaction list is a table indexed by the transaction serial number, showing the signal direction, date and time, price, profit and loss, accumulated profit and loss, maximum transaction profit, transaction loss and other values.
Remarks
Finally, I will explain that this is just the beginning of this model. I will continue to optimize the trading system of the second layer. Various optimization feedback and suggestions are welcome. For valuable feedback, I am willing to provide some L4/L5 technical indicators as rewards for free subscription rights.

[Sextan] KAMA BacktestLevel: 1
NOTE: This is ONLY an EXAMPLE on HOW-TO produce a customized "{Sextan} PINEv4 Sextans Backtest Framework" with intput signal source as my "{blackcat} L2 Perry Kaufman Adaptive MA (KAMA)" quickly and drawing on main chart. You can backtest many of my indicators in minutes now!
Of course,you can define your own indicator in the highlighted area in compliance with the uniform format, which guarantee when you use "Indicator on Indicator" function, it would not produce any error.
Background
Backtesting of technical indicators and strategies is the most common way to understand a quantitative strategy. However, the complicated configuration and adaptation work of backtesting many quantitative tools makes many traders who do not understand the code daunted. Moreover, although I have written a lot of strategies, I am still not very satisfied with the backtest configuration and writing efficiency. Therefore, I have been thinking about how to build a backtesting framework that can quickly and easily evaluate the backtesting performance of any indicator with a "long/short entry" indicator, that is, a "simple backtesting tool for dummies". The performance requirements should be stable, and the operation should be simple and convenient. It is best to "copy", "paste", and "a few mouse clicks" to complete the quick backtest and evaluation of a new indicator.
Luckily, I recently realized that TradingView provides an "Indicator on Indicator" feature, which is the perfect foundation for doing "hot swap" backtesting. My basic idea is to use a two-layer design. The first layer is the technical indicator signal source that needs to be embedded, which is only used to provide buy and sell signals of custom strategies; the second layer is the trading system, which is used to receive the output signals of the first layer, and filter the signals according to the agreed specifications. , Take Profit, Stop Loss, draw buy and sell signals and cost lines, define and send custom buy and sell alert messages to mobile phones, social software or trading interfaces. In general, this two-layer design is a flexible combination of "death and alive", which can meet the needs of most traders to quickly evaluate the performance of a certain technical indicator. The first layer here is flexible. Users can insert their own strategy codes according to my template, and they can draw buy and sell signals and output them to the second layer. The second layer is fixed, and the overall framework is solidified to ensure the stability and unity of the trading system. It is convenient to compare different or similar strategies under the same conditions. Finally, all trading signals are drawn on the chart, and the output strategy returns. test report.
The main function:
The first layer: "{Sextan} Your Indicator Source", the script provides a template for personalized strategy input, and the signal and definition interfaces ensure full compatibility with the second layer. Backtesting is performed stably in the backtesting framework of the layer. The first layer of this script is also relatively simple: enter your script in the highlighted custom script area, and after ensuring the final buy and sell signals long = bool condition, short = bool condition, the design of the first layer is considered complete. Input it into the PINE script editor of TradingView, save it and add it to the chart, you can see the pulse sequence in yellow (buy) and purple (sell) on the sub-picture, corresponding to the main picture, you can subjectively judge that the quality of the trading point of the strategy is good Bad.
The second layer: "{Sextan} PINEv4 Sextans Backtest Framework". This script is the standardized trading system strategy execution and alarm, used to generate the final report of the strategy backtest and some key indicators that I have customized that I find useful, such as: winning rate , Odds, Winning Surface, Kelly Ratio, Take Profit and Stop Loss Thresholds, Trading Frequency, etc. are evaluated according to the Kelly formula. To use the second layer, first load it into the TrainingView chart, no markers will appear on the chart, since you have not specified any strategy source signals, click on the gear-shaped setting next to the "{Sextan} PINEv4 Sextans BTFW" header button, you can open the backtest settings, the first item is to select your custom strategy source. Because we have added the strategy source to the chart in the previous step, you can easily find an option "{Sextan} Your Indicator Source: Signal" at the bottom of the list, this is the strategy source input we need, select and confirm , you can see various markers on the main graph, and quickly generate a backtesting profit graph and a list of backtesting reports. You can generate files and download the backtesting reports locally. You can also click the gear on the backtest chart interface to customize some conditions of the backtest, including: initial capital amount, currency type, percentage of each order placed, amount of pyramid additions, commission fees, slippage, etc. configuration. Note: The configuration in the interface dialog overrides the same configuration implemented by the code in the backtest script.
How to output charts:
The first layer: "{Sextan} Your Indicator Source", the output of this script is the pulse value of yellow and purple, yellow +1 means buy, purple -1 means sell.
The second layer: PINEv4 Sextans Backtest Framework". The output of this script is a bit complicated. After all, it is the entire trading system with a lot of information:
1. Blue and red arrows. The blue upward arrow indicates long position, the red downward arrow indicates short position, and the horizontal bar at the end of the purple arrow indicates take profit or stop loss exit.
2. Red and green lines. This is the holding cost line of the strategy, green represents the cost of holding a long position, and red represents the cost of holding a short position. The cost line is a continuous solid line and the price action is relatively close.
3. Green and yellow long take profit and stop loss area and green and yellow long take profit and stop loss fork. Once a long position is held, there is a conditional order for take profit and stop loss. The green horizontal line is the long take profit ratio line, and the yellow is the long stop loss ratio line; the green cross indicates the long take profit price, and the yellow cross indicates the long position. Stop loss price. It's worth noting that the prongs and wires don't necessarily go together. Because of the optimization of the algorithm, for a strong market, the take profit will occur after breaking the take profit line, and the profit will not be taken until the price falls.
4. The purple and red short take profit and stop loss area and the purple red short stop loss fork. Once a short position is held, there will be a take profit and stop loss conditional order, the red is the short take profit ratio line, and the purple is the short stop loss ratio line; the red cross indicates the short take profit price, and the purple cross indicates the short stop loss price.
5. In addition to the above signs, there are also text and numbers indicating the profit and loss values of long and short positions. "L" means long; "S" means short; "XL" means close long; "XS" means close short.
TradingView Strategy Tester Panel:
The overview graph is an intuitive graph that plots the blue (gain) and red (loss) curves of all backtest periods together, and notes: the absolute value and percentage of net profit, the number of all closed positions, the winning percentage, the profit factor, The maximum trading loss, the absolute value and ratio of the average trading profit and loss, and the average number of K-lines held in all trades.
Another is the performance summary. This is to display all long and short statistical indicators of backtesting in the form of a list, such as: net profit, gross profit, Sharpe ratio, maximum position, commission, times of profit and loss, etc.
Finally, the transaction list is a table indexed by the transaction serial number, showing the signal direction, date and time, price, profit and loss, accumulated profit and loss, maximum transaction profit, transaction loss and other values.
Remarks
Finally, I will explain that this is just the beginning of this model. I will continue to optimize the trading system of the second layer. Various optimization feedback and suggestions are welcome. For valuable feedback, I am willing to provide some L4/L5 technical indicators as rewards for free subscription rights.

[Sextan] Your Indicator SourceLevel: 1
NOTE: This is ONLY an EXAMPLE on HOW-TO produce a customized "{Sextan} PINEv4 Sextans Backtest Framework" intput signal source, you can define your own indicator in the highlighted area in compliance with the uniform format, which guarantee when you use "Indicator on Indicator" function, it would not produce any error.
I use two simple moving average crossings to produce long and short entry signal with SMA3 and SMA8 in the example.
Background
Backtesting of technical indicators and strategies is the most common way to understand a quantitative strategy. However, the complicated configuration and adaptation work of backtesting many quantitative tools makes many traders who do not understand the code daunted. Moreover, although I have written a lot of strategies, I am still not very satisfied with the backtest configuration and writing efficiency. Therefore, I have been thinking about how to build a backtesting framework that can quickly and easily evaluate the backtesting performance of any indicator with a "long/short entry" indicator, that is, a "simple backtesting tool for dummies". The performance requirements should be stable, and the operation should be simple and convenient. It is best to "copy", "paste", and "a few mouse clicks" to complete the quick backtest and evaluation of a new indicator.
Luckily, I recently realized that TradingView provides an "Indicator on Indicator" feature, which is the perfect foundation for doing "hot swap" backtesting. My basic idea is to use a two-layer design. The first layer is the technical indicator signal source that needs to be embedded, which is only used to provide buy and sell signals of custom strategies; the second layer is the trading system, which is used to receive the output signals of the first layer, and filter the signals according to the agreed specifications. , Take Profit, Stop Loss, draw buy and sell signals and cost lines, define and send custom buy and sell alert messages to mobile phones, social software or trading interfaces. In general, this two-layer design is a flexible combination of "death and alive", which can meet the needs of most traders to quickly evaluate the performance of a certain technical indicator. The first layer here is flexible. Users can insert their own strategy codes according to my template, and they can draw buy and sell signals and output them to the second layer. The second layer is fixed, and the overall framework is solidified to ensure the stability and unity of the trading system. It is convenient to compare different or similar strategies under the same conditions. Finally, all trading signals are drawn on the chart, and the output strategy returns. test report.
The main function:
The first layer: "{Sextan} Your Indicator Source", the script provides a template for personalized strategy input, and the signal and definition interfaces ensure full compatibility with the second layer. Backtesting is performed stably in the backtesting framework of the layer. The first layer of this script is also relatively simple: enter your script in the highlighted custom script area, and after ensuring the final buy and sell signals long = bool condition, short = bool condition, the design of the first layer is considered complete. Input it into the PINE script editor of TradingView, save it and add it to the chart, you can see the pulse sequence in yellow (buy) and purple (sell) on the sub-picture, corresponding to the main picture, you can subjectively judge that the quality of the trading point of the strategy is good Bad.
The second layer: "{Sextan} PINEv4 Sextans Backtest Framework". This script is the standardized trading system strategy execution and alarm, used to generate the final report of the strategy backtest and some key indicators that I have customized that I find useful, such as: winning rate , Odds, Winning Surface, Kelly Ratio, Take Profit and Stop Loss Thresholds, Trading Frequency, etc. are evaluated according to the Kelly formula. To use the second layer, first load it into the TrainingView chart, no markers will appear on the chart, since you have not specified any strategy source signals, click on the gear-shaped setting next to the "{Sextan} PINEv4 Sextans BTFW" header button, you can open the backtest settings, the first item is to select your custom strategy source. Because we have added the strategy source to the chart in the previous step, you can easily find an option "{Sextan} Your Indicator Source: Signal" at the bottom of the list, this is the strategy source input we need, select and confirm , you can see various markers on the main graph, and quickly generate a backtesting profit graph and a list of backtesting reports. You can generate files and download the backtesting reports locally. You can also click the gear on the backtest chart interface to customize some conditions of the backtest, including: initial capital amount, currency type, percentage of each order placed, amount of pyramid additions, commission fees, slippage, etc. configuration. Note: The configuration in the interface dialog overrides the same configuration implemented by the code in the backtest script.
How to output charts:
The first layer: "{Sextan} Your Indicator Source", the output of this script is the pulse value of yellow and purple, yellow +1 means buy, purple -1 means sell.
The second layer: PINEv4 Sextans Backtest Framework". The output of this script is a bit complicated. After all, it is the entire trading system with a lot of information:
1. Blue and red arrows. The blue upward arrow indicates long position, the red downward arrow indicates short position, and the horizontal bar at the end of the purple arrow indicates take profit or stop loss exit.
2. Red and green lines. This is the holding cost line of the strategy, green represents the cost of holding a long position, and red represents the cost of holding a short position. The cost line is a continuous solid line and the price action is relatively close.
3. Green and yellow long take profit and stop loss area and green and yellow long take profit and stop loss fork. Once a long position is held, there is a conditional order for take profit and stop loss. The green horizontal line is the long take profit ratio line, and the yellow is the long stop loss ratio line; the green cross indicates the long take profit price, and the yellow cross indicates the long position. Stop loss price. It's worth noting that the prongs and wires don't necessarily go together. Because of the optimization of the algorithm, for a strong market, the take profit will occur after breaking the take profit line, and the profit will not be taken until the price falls.
4. The purple and red short take profit and stop loss area and the purple red short stop loss fork. Once a short position is held, there will be a take profit and stop loss conditional order, the red is the short take profit ratio line, and the purple is the short stop loss ratio line; the red cross indicates the short take profit price, and the purple cross indicates the short stop loss price.
5. In addition to the above signs, there are also text and numbers indicating the profit and loss values of long and short positions. "L" means long; "S" means short; "XL" means close long; "XS" means close short.
TradingView Strategy Tester Panel:
The overview graph is an intuitive graph that plots the blue (gain) and red (loss) curves of all backtest periods together, and notes: the absolute value and percentage of net profit, the number of all closed positions, the winning percentage, the profit factor, The maximum trading loss, the absolute value and ratio of the average trading profit and loss, and the average number of K-lines held in all trades.
Another is the performance summary. This is to display all long and short statistical indicators of backtesting in the form of a list, such as: net profit, gross profit, Sharpe ratio, maximum position, commission, times of profit and loss, etc.
Finally, the transaction list is a table indexed by the transaction serial number, showing the signal direction, date and time, price, profit and loss, accumulated profit and loss, maximum transaction profit, transaction loss and other values.
Remarks
Finally, I will explain that this is just the beginning of this model. I will continue to optimize the trading system of the second layer. Various optimization feedback and suggestions are welcome. For valuable feedback, I am willing to provide some L4/L5 technical indicators as rewards for free subscription rights.
