Ichimoku Cloud Breakout Only LongThis is a very simple trading strategy based exclusively on the Ichimoku Cloud. There are no additional indicators or complex rules involved. The key condition is that we only open long positions when the price is clearly above the cloud — indicating a bullish trend.
For optimal results, the recommended timeframes are 1D (daily) or 1W (weekly) charts. These higher timeframes help filter out market noise and provide more reliable trend signals.
We do not short the market under any circumstances. The focus is purely on riding upward momentum when the price breaks out or stays above the cloud.
This strategy works best when applied to growth stocks with strong upward trends and good fundamentals — such as Google (GOOGL), Tesla (TSLA), Apple (AAPL), or NVIDIA (NVDA).
Поиск скриптов по запросу "bands"

Gold Breakout Strategy - RR 4Strategy Name: Gold Breakout Strategy - RR 4
🧠 Main Objective
This strategy aims to capitalize on breakouts from the Donchian Channel on Gold (XAU/USD) by filtering trades with:
Volume confirmation,
A custom momentum indicator (LWTI - Linear Weighted Trend Index),
And a specific trading session (8 PM to 8 AM Quebec time — GMT-5).
It takes only one trade per day, either a buy or a sell, using a fixed stop-loss at the wick of the breakout candle and a 4:1 reward-to-risk (RR) ratio.
📊 Indicators Used
Donchian Channel
Length: 96
Detects breakouts of recent highs or lows.
Volume
Simple Moving Average (SMA) over 30 bars.
A breakout is only valid if the current volume is above the SMA.
LWTI (Linear Weighted Trend Index)
Measures momentum using price differences over 25 bars, smoothed over 5.
Used to confirm trend direction:
Buy when LWTI > its smoothed version (uptrend).
Sell when LWTI < its smoothed version (downtrend).
⏰ Time Filter
The strategy only allows entries between 8 PM and 8 AM (GMT-5 / Quebec time).
A timestamp-based filter ensures the system recognizes the correct trading session even across midnight.
📌 Entry Conditions
🟢 Buy (Long)
Price breaks above the previous Donchian Channel high.
The current channel high is higher than the previous one.
Volume is above its moving average.
LWTI confirms an uptrend.
The time is within the trading session (20:00 to 08:00).
No trade has been taken yet today.
🔴 Sell (Short)
Price breaks below the previous Donchian Channel low.
The current channel low is lower than the previous one.
Volume is above its moving average.
LWTI confirms a downtrend.
The time is within the trading session.
No trade has been taken yet today.
💸 Trade Management
Stop-Loss (SL):
For long entries: placed below the wick low of the breakout candle.
For short entries: placed above the wick high of the breakout candle.
Take-Profit (TP):
Set at a fixed 4:1 reward-to-risk ratio.
Calculated as 4x the distance between the entry price and stop-loss.
No trailing stop, no break-even, no scaling in/out.
🎨 Visuals
Green triangle appears below the candle on a buy signal.
Red triangle appears above the candle on a sell signal.
Donchian Channel lines are plotted on the chart.
The strategy is designed for the 5-minute timeframe.
🔄 One Trade Per Day Rule
Once a trade is taken (buy or sell), no more trades will be executed for the rest of the day. This prevents overtrading and limits exposure.

Reverse Keltner Channel StrategyReverse Keltner Channel Strategy
Overview
The Reverse Keltner Channel Strategy is a mean-reversion trading system that capitalizes on price movements between Keltner Channels. Unlike traditional Keltner Channel strategies that trade breakouts, this system takes the contrarian approach by entering positions when price returns to the channel after overextending.
Strategy Logic
Long Entry Conditions:
Price crosses above the lower Keltner Channel from below
This signals a potential reversal after an oversold condition
Position is entered at market price upon signal confirmation
Long Exit Conditions:
Take Profit: Price reaches the upper Keltner Channel
Stop Loss: Placed at half the channel width below entry price
Short Entry Conditions:
Price crosses below the upper Keltner Channel from above
This signals a potential reversal after an overbought condition
Position is entered at market price upon signal confirmation
Short Exit Conditions:
Take Profit: Price reaches the lower Keltner Channel
Stop Loss: Placed at half the channel width above entry price
Key Features
Mean Reversion Approach: Takes advantage of price tendency to return to mean after extreme moves
Adaptive Stop Loss: Stop loss dynamically adjusts based on market volatility via ATR
Visual Signals: Entry points clearly marked with directional triangles
Fully Customizable: All parameters can be adjusted to fit various market conditions
Customizable Parameters
Keltner EMA Length: Controls the responsiveness of the channel (default: 20)
ATR Multiplier: Determines channel width/sensitivity (default: 2.0)
ATR Length: Affects volatility calculation period (default: 10)
Stop Loss Factor: Adjusts risk management aggressiveness (default: 0.5)
Best Used On
This strategy performs well on:
Currency pairs with defined ranging behavior
Commodities that show cyclical price movements
Higher timeframes (4H, Daily) for more reliable signals
Markets with moderate volatility
Risk Management
The built-in stop loss mechanism automatically adjusts to market conditions by calculating position risk relative to the current channel width. This approach ensures that risk remains proportional to potential reward across varying market conditions.
Notes for Optimization
Consider adjusting the EMA length and ATR multiplier based on the specific asset and timeframe:
Lower values increase sensitivity and generate more signals
Higher values produce fewer but potentially more reliable signals
As with any trading strategy, thorough backtesting is recommended before live implementation.
Past performance is not indicative of future results. Always practice sound risk management.

Supertrend Hombrok BotSupertrend Hombrok Bot – Automated Trading Strategy for Dynamic Market Conditions
This trading strategy script has been developed to operate automatically based on detailed market conditions. It combines the popular Supertrend indicator, RSI (Relative Strength Index), Volume, and ATR (Average True Range) to determine the best entry and exit points while maintaining proper risk management.
Key Features:
Supertrend as the Base: Uses the Supertrend indicator to identify the market's trend direction, generating buy signals when the market is in an uptrend and sell signals when in a downtrend.
RSI Filter: The RSI is used to determine overbought and oversold conditions, helping to avoid entries in extreme market conditions. Entries are avoided when RSI > 70 (overbought) and RSI < 30 (oversold), reducing the risk of false movements.
Volume Filter: The strategy checks if the trading volume is above the average multiplied by a user-defined factor. This ensures that only significant movements, with higher liquidity, are considered.
Candle Body Size: The strategy filters only candles with a body large enough relative to the ATR (Average True Range), ensuring that the price movements on the chart have sufficient strength.
Risk Management: The bot is configured to operate with an adjustable Risk/Reward Ratio (R:R). This means that for each trade, both Take Profit (TP) and Stop Loss (SL) are adjusted based on the market's volatility as measured by the ATR.
Automatic Entries and Exits: The script automatically executes entries based on the specified conditions and exits with predefined Stop Loss and Take Profit levels, ensuring risk is controlled for each trade.
How It Works:
Buy Condition: Triggered when the market is in an uptrend (Supertrend), the volume is above the adjusted average, the candle body is strong enough, and the RSI is below the overbought level.
Sell Condition: Triggered when the market is in a downtrend (Supertrend), the volume is above the adjusted average, the candle body is strong enough, and the RSI is above the oversold level.
Alerts:
Buy and Sell Alerts are configured with detailed information, including Stop Loss and Take Profit values, allowing the user to receive notifications when trading conditions are met.
Capital Management:
The capital per trade can be adjusted based on account size and risk profile.
Important Note:
Always test before trading with real capital: While the strategy has been designed based on solid technical analysis methods, always perform tests in real-time market conditions with demo accounts before applying the bot in live trading.
Disclaimer: This script is a tool to assist in the trading process and does not guarantee profit. Past performance is not indicative of future results, and the trader is always responsible for their investment decisions.

Vinicius Setup ATR
Description:
This script is a strategy based on the Supertrend indicator combined with volume analysis, candle strength, and RSI. Its goal is to identify potential entry points for buy and sell trades based on technical criteria, without promising profitability or guaranteed results.
Script Components:
Supertrend: Used as the main trend compass. When the trend is positive (direction = 1), buy signals are considered; when negative (direction = -1), sell signals are considered.
Volume: Entries are only validated if the volume is above the average of the last 20 candles, adjusted with a 1.2 multiplier.
Candle Body: The candle body must be larger than a certain percentage of the ATR, ensuring sufficient strength and volatility.
RSI: Used as a filter to avoid trades in extreme overbought or oversold zones.
Support and Resistance: Identified based on simple pivots (5 periods before and after).
Customizable Parameters:
ATR Length and Multiplier: Controls the sensitivity of the Supertrend.
RSI Period: Adjusts the relative strength filter.
Minimum Volume and Candle Body: Settings to validate entry signals.
Entry Conditions:
Buy: Positive trend + strong candle + high volume + RSI below 70.
Sell: Negative trend + strong candle + high volume + RSI above 30.
Exit Conditions:
The trade is closed upon the appearance of an opposite signal.
Notes:
This is a technical system with no profit guarantees.
It is recommended to test with realistic capital values and parameters suited to your risk management.
The script is not optimized for specific profitability, but rather to support study and the construction of setups with objective criteria.

Donchian Breakout Strategy📈 Donchian Breakout Strategy (Inspired by Way of the Turtle)
This strategy is a modern adaptation of the legendary Turtle Trading system as taught in Way of the Turtle by Curtis Faith — re-engineered for the crypto market’s volatility, 24/7 nature, and frequent fakeouts.
⸻
🐢 Original Inspiration
The original Turtle system, created by Richard Dennis and William Eckhardt, used:
• Breakouts of Donchian Channels (20-day for entry, 10-day for exit)
• Volatility-based position sizing using ATR (N)
• Simple rules, big trend exposure, and pyramiding to grow winners
It was built for futures and commodities, trading daily bars, assuming stable trading hours and regulated markets.
⸻
🚀 What’s Different in This Strategy?
✅ Optimized for Crypto
• Adapts to constant volatility and price manipulation common in crypto
• Adds commission modeling for realistic results (0.045% default)
✅ Improved Entry Filtering
• Uses EMA filter to align with trend direction
• Adds RSI momentum check to avoid early or weak breakouts
• Optional volatility and volume filters to reduce false signals
✅ Smarter Exits
• ATR-based volatility stop loss, not just Donchian reversal
• Avoids pyramiding to reduce risk from sudden reversals
✅ Backtest-Friendly
• Default backtest window starts from 2025-01-01
• Fully configurable: long/short toggle, filter control, stop loss multiplier
⸻
🧪 Use Case
• Best on trending coins with strong directional moves
• Avoids chop via filters, preserving capital
• Can be tuned for aggressive or conservative setups with just a few tweaks

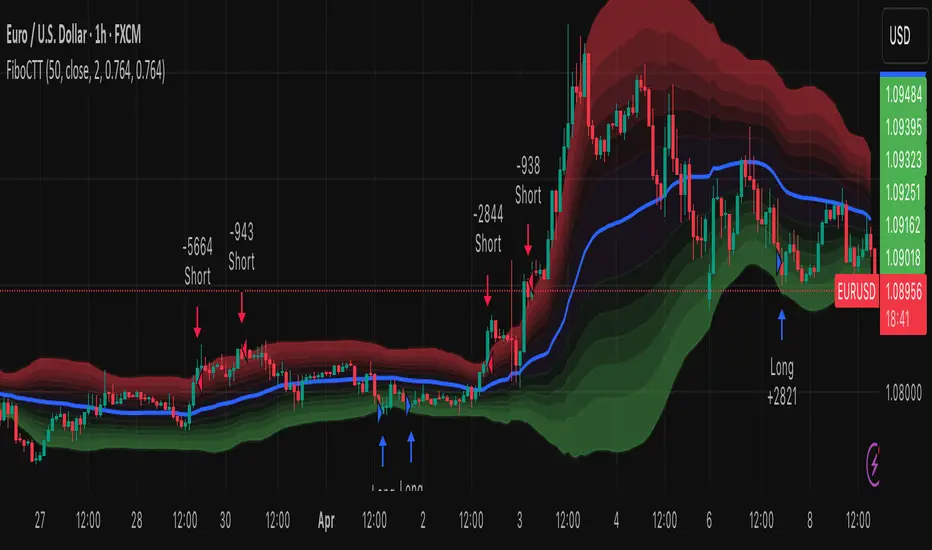
Fibonacci Counter-Trend TradingOverview:
The Fibonacci Counter-Trend Trading strategy is designed to capitalize on price reversals by utilizing Fibonacci levels calculated from the standard deviation of price movements. This strategy opens a sell order when the closing price crosses above a specified upper Fibonacci level and a buy order when the closing price crosses below a specified lower Fibonacci level. By leveraging the principles of Fibonacci retracement and volatility, this strategy aims to identify potential reversal points in the market.
How It Works:
Fibonacci Levels Calculation:
The strategy calculates upper and lower Fibonacci levels based on the standard deviation of the price over a specified moving average length. These levels are derived from the Fibonacci sequence, which is widely used in technical analysis to identify potential support and resistance levels.
The upper levels are calculated by adding specific Fibonacci ratios (0.236, 0.382, 0.5, 0.618, 0.764, and 1.0) multiplied by the standard deviation to the basis (the volume-weighted moving average).
The lower levels are calculated by subtracting the same Fibonacci ratios multiplied by the standard deviation from the basis.
Trade Entry Rules:
Sell Order: A sell order is triggered when the closing price crosses above the selected upper Fibonacci level. This indicates a potential reversal point where the price may start to decline.
Buy Order: A buy order is initiated when the closing price crosses below the selected lower Fibonacci level. This suggests a potential reversal point where the price may begin to rise.
Trade Management:
The strategy includes stop-losses based on the Fibonacci levels to protect against adverse price movements.
How to Use:
Users can customize the moving average length and the multiplier for the standard deviation to suit their trading preferences and market conditions.
The strategy can be applied to various financial instruments, including stocks, forex, and cryptocurrencies, making it versatile for different trading environments.
Pros:
The Fibonacci Counter-Trend Trading strategy combines the mathematical principles of the Fibonacci sequence with the statistical measure of standard deviation, providing a unique approach to identifying potential market reversals.
This strategy is particularly useful in volatile markets where price swings can lead to significant trading opportunities.
The use of Fibonacci levels can help traders identify key support and resistance areas, enhancing decision-making.
Cons:
The strategy may generate false signals in choppy or sideways markets, leading to potential losses if the price does not reverse as anticipated.
Relying solely on Fibonacci levels without considering other technical indicators or market conditions may result in missed opportunities or increased risk.
The effectiveness of the strategy can vary depending on the chosen parameters (e.g., moving average length and standard deviation multiplier), requiring users to spend time optimizing these settings for different market conditions.
As with any counter-trend strategy, there is a risk of significant drawdowns during strong trending markets, where the price continues to move in one direction without reversing.
By understanding the mechanics of the Fibonacci Counter-Trend Trading strategy, along with its pros and cons, traders can effectively implement it in their trading routines and potentially enhance their trading performance.
EMA 34 Crossover with Break Even Stop LossEMA 34 Crossover with Break Even Stop Loss Strategy
This trading strategy is based on the 34-period Exponential Moving Average (EMA) and aims to enter long positions when the price crosses above the EMA 34. The strategy is designed to manage risk effectively with a dynamic stop loss and take-profit mechanism.
Key Features:
EMA 34 Crossover:
The strategy generates a long entry signal when the closing price of the current bar crosses above the 34-period EMA, with the condition that the previous closing price was below the EMA. This crossover indicates a potential upward trend.
Risk Management:
Upon entering a trade, the strategy sets a stop loss at the low of the previous bar. This helps in controlling the downside risk.
A take profit level is set at a 10:1 risk-to-reward ratio, meaning the potential profit is ten times the amount risked on the trade.
Break-even Stop Loss:
As the price moves in favor of the trade and reaches a 3:1 risk-to-reward ratio, the strategy moves the stop loss to the entry price (break-even). This ensures that no loss will be incurred if the market reverses, effectively protecting profits.
Exit Conditions:
The strategy exits the trade when either the stop loss is hit (if the price drops below the stop loss level) or the take profit target is reached (if the price rises to the take profit level).
If the price reaches the break-even level (entry price), the stop loss is adjusted to lock in profits and prevent any loss.
Visualization:
The stop loss and take profit levels are plotted on the chart for easy visualization, helping traders track the status of their trade.
Trade Management Summary:
Long Entry: When price crosses above the 34-period EMA.
Stop Loss: Set to the low of the previous candle.
Take Profit: Set to a 10:1 risk-to-reward ratio.
Break-even: Stop loss is moved to entry price when a 3:1 risk-to-reward ratio is reached.
Exit: The trade is closed either when the stop loss or take profit levels are hit.
This strategy is designed to minimize losses by employing a dynamic stop loss and to maximize gains by setting a favorable risk-to-reward ratio, making it suitable for traders who prefer a structured, automated approach to risk management and trend-following.

Adaptive Fibonacci Pullback System -FibonacciFluxAdaptive Fibonacci Pullback System (AFPS) - FibonacciFlux
This work is licensed under a Attribution-NonCommercial-ShareAlike 4.0 International (CC BY-NC-SA 4.0). Original concepts by FibonacciFlux.
Abstract
The Adaptive Fibonacci Pullback System (AFPS) presents a sophisticated, institutional-grade algorithmic strategy engineered for high-probability trend pullback entries. Developed by FibonacciFlux, AFPS uniquely integrates a proprietary Multi-Fibonacci Supertrend engine (0.618, 1.618, 2.618 ratios) for harmonic volatility assessment, an Adaptive Moving Average (AMA) Channel providing dynamic market context, and a synergistic Multi-Timeframe (MTF) filter suite (RSI, MACD, Volume). This strategy transcends simple indicator combinations through its strict, multi-stage confluence validation logic. Historical simulations suggest that specific MTF filter configurations can yield exceptional performance metrics, potentially achieving Profit Factors exceeding 2.6 , indicative of institutional-level potential, while maintaining controlled risk under realistic trading parameters (managed equity risk, commission, slippage).
4 hourly MTF filtering
1. Introduction: Elevating Pullback Trading with Adaptive Confluence
Traditional pullback strategies often struggle with noise, false signals, and adapting to changing market dynamics. AFPS addresses these challenges by introducing a novel framework grounded in Fibonacci principles and adaptive logic. Instead of relying on static levels or single confirmations, AFPS seeks high-probability pullback entries within established trends by validating signals through a rigorous confluence of:
Harmonic Volatility Context: Understanding the trend's stability and potential turning points using the unique Multi-Fibonacci Supertrend.
Adaptive Market Structure: Assessing the prevailing trend regime via the AMA Channel.
Multi-Dimensional Confirmation: Filtering signals with lower-timeframe Momentum (RSI), Trend Alignment (MACD), and Market Conviction (Volume) using the MTF suite.
The objective is to achieve superior signal quality and adaptability, moving beyond conventional pullback methodologies.
2. Core Methodology: Synergistic Integration
AFPS's effectiveness stems from the engineered synergy between its core components:
2.1. Multi-Fibonacci Supertrend Engine: Utilizes specific Fibonacci ratios (0.618, 1.618, 2.618) applied to ATR, creating a multi-layered volatility envelope potentially resonant with market harmonics. The averaged and EMA-smoothed result (`smoothed_supertrend`) provides a robust, dynamic trend baseline and context filter.
// Key Components: Multi-Fibonacci Supertrend & Smoothing
average_supertrend = (supertrend1 + supertrend2 + supertrend3) / 3
smoothed_supertrend = ta.ema(average_supertrend, st_smooth_length)
2.2. Adaptive Moving Average (AMA) Channel: Provides dynamic market context. The `ama_midline` serves as a key filter in the entry logic, confirming the broader trend bias relative to adaptive price action. Extended Fibonacci levels derived from the channel width offer potential dynamic S/R zones.
// Key Component: AMA Midline
ama_midline = (ama_high_band + ama_low_band) / 2
2.3. Multi-Timeframe (MTF) Filter Suite: An optional but powerful validation layer (RSI, MACD, Volume) assessed on a lower timeframe. Acts as a **validation cascade** – signals must pass all enabled filters simultaneously.
2.4. High-Confluence Entry Logic: The core innovation. A pullback entry requires a specific sequence and validation:
Price interaction with `average_supertrend` and recovery above/below `smoothed_supertrend`.
Price confirmation relative to the `ama_midline`.
Simultaneous validation by all enabled MTF filters.
// Simplified Long Entry Logic Example (incorporates key elements)
long_entry_condition = enable_long_positions and
(low < average_supertrend and close > smoothed_supertrend) and // Pullback & Recovery
(close > ama_midline and close > ama_midline) and // AMA Confirmation
(rsi_filter_long_ok and macd_filter_long_ok and volume_filter_ok) // MTF Validation
This strict, multi-stage confluence significantly elevates signal quality compared to simpler pullback approaches.
1hourly filtering
3. Realistic Implementation and Performance Potential
AFPS is designed for practical application, incorporating realistic defaults and highlighting performance potential with crucial context:
3.1. Realistic Default Strategy Settings:
The script includes responsible default parameters:
strategy('Adaptive Fibonacci Pullback System - FibonacciFlux', shorttitle = "AFPS", ...,
initial_capital = 10000, // Accessible capital
default_qty_type = strategy.percent_of_equity, // Equity-based risk
default_qty_value = 4, // Default 4% equity risk per initial trade
commission_type = strategy.commission.percent,
commission_value = 0.03, // Realistic commission
slippage = 2, // Realistic slippage
pyramiding = 2 // Limited pyramiding allowed
)
Note: The default 4% risk (`default_qty_value = 4`) requires careful user assessment and adjustment based on individual risk tolerance.
3.2. Historical Performance Insights & Institutional Potential:
Backtesting provides insights into historical behavior under specific conditions (always specify Asset/Timeframe/Dates when sharing results):
Default Performance Example: With defaults, historical tests might show characteristics like Overall PF ~1.38, Max DD ~1.16%, with potential Long/Short performance variance (e.g., Long PF 1.6+, Short PF < 1).
Optimized MTF Filter Performance: Crucially, historical simulations demonstrate that meticulous configuration of the MTF filters (particularly RSI and potentially others depending on market) can significantly enhance performance. Under specific, optimized MTF filter settings combined with appropriate risk management (e.g., 7.5% risk), historical tests have indicated the potential to achieve **Profit Factors exceeding 2.6**, alongside controlled drawdowns (e.g., ~1.32%). This level of performance, if consistently achievable (which requires ongoing adaptation), aligns with metrics often sought in institutional trading environments.
Disclaimer Reminder: These results are strictly historical simulations. Past performance does not guarantee future results. Achieving high performance requires careful parameter tuning, adaptation to changing markets, and robust risk management.
3.3. Emphasizing Risk Management:
Effective use of AFPS mandates active risk management. Utilize the built-in Stop Loss, Take Profit, and Trailing Stop features. The `pyramiding = 2` setting requires particularly diligent oversight. Do not rely solely on default settings.
4. Conclusion: Advancing Trend Pullback Strategies
The Adaptive Fibonacci Pullback System (AFPS) offers a sophisticated, theoretically grounded, and highly adaptable framework for identifying and executing high-probability trend pullback trades. Its unique blend of Fibonacci resonance, adaptive context, and multi-dimensional MTF filtering represents a significant advancement over conventional methods. While requiring thoughtful implementation and risk management, AFPS provides discerning traders with a powerful tool potentially capable of achieving institutional-level performance characteristics under optimized conditions.
Acknowledgments
Developed by FibonacciFlux. Inspired by principles of Fibonacci analysis, adaptive averaging, and multi-timeframe confirmation techniques explored within the trading community.
Disclaimer
Trading involves substantial risk. AFPS is an analytical tool, not a guarantee of profit. Past performance is not indicative of future results. Market conditions change. Users are solely responsible for their decisions and risk management. Thorough testing is essential. Deploy at your own considered risk.

LUX CLARA - EMA + VWAP (No ATR Filter) - v6EMA STRAT SHOUT OUTOUTLIERSSSSS
Overview:
an intraday strategy built around two core principles:
Trend Confirmation using the 50 EMA (Exponential Moving Average) in relation to the VWAP (Volume-Weighted Average Price).
Entry Signals triggered by the 8 EMA crossing the 50 EMA in the direction of that confirmed trend.
Key Logic:
Bullish Trend if the 50 EMA is above VWAP. Only long entries are allowed when the 8 EMA crosses above the 50 EMA during that bullish phase.
Bearish Trend if the 50 EMA is below VWAP. Only short entries are allowed when the 8 EMA crosses below the 50 EMA during that bearish phase.
Intraday Focus: Trades are restricted to a user-defined session window (default 7:30 AM–11:30 AM), aligning entries/exits with peak intraday liquidity.
Exit Rule: Positions close automatically when the 8 EMA crosses back in the opposite direction of the entry.
Why It Works:
EMA + VWAP helps detect both immediate momentum (EMAs) and overall institutional bias (VWAP).
By confining trades to a set intraday window, the strategy aims to capture morning volatility while avoiding choppy afternoon or overnight sessions.
Customization:
Users can adjust EMA lengths, session times, or incorporate stops/targets for additional risk management.
It can be tested on various symbols and intraday timeframes to gauge performance and robustness.

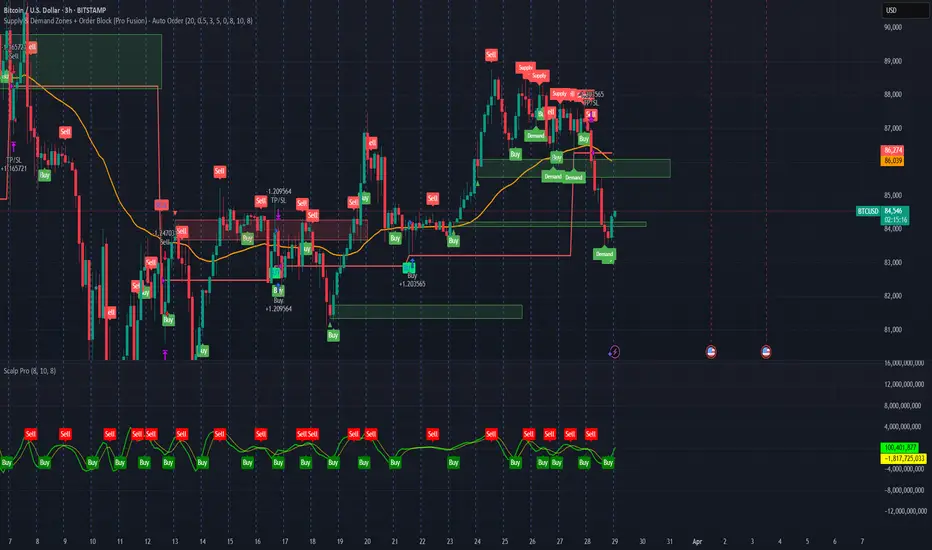
Supply & Demand Zones + Order Block (Pro Fusion) - Auto Order Strategy Title:
Smart Supply & Demand Zones + Order Block Auto Strategy with ScalpPro (Buy-Focused)
📄 Strategy Description:
This strategy combines the power of Supply & Demand Zone analysis, Order Block detection, and an enhanced Scalp Pro momentum filter, specifically designed for automated decision-making based on high-volume breakouts.
✅ Key Features:
Auto Entry (Buy Only) Based on Breakouts
Automatically enters a Buy position when the price breaks out of a valid demand zone, confirmed by EMA 50 trend and volume spike.
Order Block Logic
Identifies bullish and bearish order blocks using consecutive candle structures and significant price movement.
Dynamic Stop Loss & Trailing Stop
Implements a trailing stop once price moves in profit, along with static initial stop loss for risk management.
Clear Visual Labels & Alerts
Displays BUY/SELL, Demand/Supply, and Order Block labels directly on the chart. Alerts trigger on valid breakout signals.
Scalp Pro Momentum Filter (Optimized)
Uses a modified MACD-style momentum indicator to confirm trend strength and filter out weak signals.
[3Commas] Turtle StrategyTurtle Strategy
🔷 What it does: This indicator implements a modernized version of the Turtle Trading Strategy, designed for trend-following and automated trading with webhook integration. It identifies breakout opportunities using Donchian channels, providing entry and exit signals.
Channel 1: Detects short-term breakouts using the highest highs and lowest lows over a set period (default 20).
Channel 2: Acts as a confirmation filter by applying an offset to the same period, reducing false signals.
Exit Channel: Functions as a dynamic stop-loss (wait for candle close), adjusting based on market structure (default 10 periods).
Additionally, traders can enable a fixed Take Profit level, ensuring a systematic approach to profit-taking.
🔷 Who is it for:
Trend Traders: Those looking to capture long-term market moves.
Bot Users: Traders seeking to automate entries and exits with bot integration.
Rule-Based Traders: Operators who prefer a structured, systematic trading approach.
🔷 How does it work: The strategy generates buy and sell signals using a dual-channel confirmation system.
Long Entry: A buy signal is generated when the close price crosses above the previous high of Channel 1 and is confirmed by Channel 2.
Short Entry: A sell signal occurs when the close price falls below the previous low of Channel 1, with confirmation from Channel 2.
Exit Management: The Exit Channel acts as a trailing stop, dynamically adjusting to price movements. To exit the trade, wait for a full bar close.
Optional Take Profit (%): Closes trades at a predefined %.
🔷 Why it’s unique:
Modern Adaptation: Updates the classic Turtle Trading Strategy, with the possibility of using a second channel with an offset to filter the signals.
Dynamic Risk Management: Utilizes a trailing Exit Channel to help protect gains as trades move favorably.
Bot Integration: Automates trade execution through direct JSON signal communication with your DCA Bots.
🔷 Considerations Before Using the Indicator:
Market & Timeframe: Best suited for trending markets; higher timeframes (e.g., H4, D1) are recommended to minimize noise.
Sideways Markets: In choppy conditions, breakouts may lead to false signals—consider using additional filters.
Backtesting & Demo Testing: It is crucial to thoroughly backtest the strategy and run it on a demo account before risking real capital.
Parameter Adjustments: Ensure that commissions, slippage, and position sizes are set accurately to reflect real trading conditions.
🔷 STRATEGY PROPERTIES
Symbol: BINANCE:ETHUSDT (Spot).
Timeframe: 4h.
Test Period: All historical data available.
Initial Capital: 10000 USDT.
Order Size per Trade: 1% of Capital, you can use a higher value e.g. 5%, be cautious that the Max Drawdown does not exceed 10%, as it would indicate a very risky trading approach.
Commission: Binance commission 0.1%, adjust according to the exchange being used, lower numbers will generate unrealistic results. By using low values e.g. 5%, it allows us to adapt over time and check the functioning of the strategy.
Slippage: 5 ticks, for pairs with low liquidity or very large orders, this number should be increased as the order may not be filled at the desired level.
Margin for Long and Short Positions: 100%.
Indicator Settings: Default Configuration.
Period Channel 1: 20.
Period Channel 2: 20.
Period Channel 2 Offset: 20.
Period Exit: 10.
Take Profit %: Disable.
Strategy: Long & Short.
🔷 STRATEGY RESULTS
⚠️Remember, past results do not guarantee future performance.
Net Profit: +516.87 USDT (+5.17%).
Max Drawdown: -100.28 USDT (-0.95%).
Total Closed Trades: 281.
Percent Profitable: 40.21%.
Profit Factor: 1.704.
Average Trade: +1.84 USDT (+1.80%).
Average # Bars in Trades: 29.
🔷 How to Use It:
🔸 Adjust Settings:
Select your asset and timeframe suited for trend trading.
Adjust the periods for Channel 1, Channel 2, and the Exit Channel to align with the asset’s historical behavior. You can visualize these channels by going to the Style tab and enabling them.
For example, if you set Channel 2 to 40 with an offset of 40, signals will take longer to appear but will aim for a more defined trend.
Experiment with different values, a possible exit configuration is using 20 as well. Compare the results and adjust accordingly.
Enable the Take Profit (%) option if needed.
🔸Results Review:
It is important to check the Max Drawdown. This value should ideally not exceed 10% of your capital. Consider adjusting the trade size to ensure this threshold is not surpassed.
Remember to include the correct values for commission and slippage according to the symbol and exchange where you are conducting the tests. Otherwise, the results will not be realistic.
If you are satisfied with the results, you may consider automating your trades. However, it is strongly recommended to use a small amount of capital or a demo account to test proper execution before committing real funds.
🔸Create alerts to trigger the DCA Bot:
Verify Messages: Ensure the message matches the one specified by the DCA Bot.
Multi-Pair Configuration: For multi-pair setups, enable the option to add the symbol in the correct format.
Signal Settings: Enable the option to receive long or short signals (Entry | TP | SL), copy and paste the messages for the DCA Bots configured.
Alert Setup:
When creating an alert, set the condition to the indicator and choose "alert() function call only".
Enter any desired Alert Name.
Open the Notifications tab, enable Webhook URL, and paste the Webhook URL.
For more details, refer to the section: "How to use TradingView Custom Signals".
Finalize Alerts: Click Create, you're done! Alerts will now be sent automatically in the correct format.
🔷 INDICATOR SETTINGS
Period Channel 1: Period of highs and lows to trigger signals
Period Channel 2: Period of highs and lows to filter signals
Offset: Move Channel 2 to the right x bars to try to filter out the favorable signals.
Period Exit: It is the period of the Donchian channel that is used as trailing for the exits.
Strategy: Order Type direction in which trades are executed.
Take Profit %: When activated, the entered value will be used as the Take Profit in percentage from the entry price level.
Use Custom Test Period: When enabled signals only works in the selected time window. If disabled it will use all historical data available on the chart.
Test Start and End: Once the Custom Test Period is enabled, here you select the start and end date that you want to analyze.
Check Messages: Check Messages: Enable this option to review the messages that will be sent to the bot.
Entry | TP | SL: Enable this options to send Buy Entry, Take Profit (TP), and Stop Loss (SL) signals.
Deal Entry and Deal Exit: Copy and paste the message for the deal start signal and close order at Market Price of the DCA Bot. This is the message that will be sent with the alert to the Bot, you must verify that it is the same as the bot so that it can process properly.
DCA Bot Multi-Pair: You must activate it if you want to use the signals in a DCA Bot Multi-pair in the text box you must enter (using the correct format) the symbol in which you are creating the alert, you can check the format of each symbol when you create the bot.
👨🏻💻💭 We hope this tool helps enhance your trading. Your feedback is invaluable, so feel free to share any suggestions for improvements or new features you'd like to see implemented.
__
The information and publications within the 3Commas TradingView account are not meant to be and do not constitute financial, investment, trading, or other types of advice or recommendations supplied or endorsed by 3Commas and any of the parties acting on behalf of 3Commas, including its employees, contractors, ambassadors, etc.

Dynamic Breakout Master by tradingbauhaus 🌟 Code Description:
This Pine Script implements a trading strategy called "Dynamic Breakout Master" 💥. The core idea of the strategy is to identify breakouts (price movements) at key support 💙 and resistance 🔴 levels, through a dynamic channel that adapts to the market’s conditions. Here's how it works:
🔧 Customizable Input Parameters:
🧭 Pivot Period: This defines the number of bars (candles) to the left and right used to detect pivots (highs and lows) that mark the support and resistance zones.
📊 Data Source: You can choose whether to use highs and lows or closes and opens of the candles to identify the pivots.
📏 Max Channel Width: Specifies the maximum width allowed for the support/resistance channel, expressed as a percentage over the last 300 bars.
💪 Minimum Pivot Strength: This defines the minimum number of pivots needed for a support or resistance level to be considered valid.
🏔 Max Support/Resistance Zones: Limits the number of key zones displayed on the chart.
📅 Lookback Period: Adjusts how many bars back the system should check to find and validate support and resistance levels.
🎨 Custom Colors: You can choose colors for the support, resistance, and in-channel zones.
📉 Moving Averages (MA): The strategy allows adding up to two moving averages (SMA or EMA) to assist in making trading decisions.
📊 Calculating Support/Resistance Levels:
The system uses an algorithm to identify pivots from prices and calculates dynamic support and resistance zones 🔒🔓.
The closer the pivots are and the stronger their influence, the more relevant the zone becomes for the strategy.
The dynamic channel is drawn on the chart, with a maximum width limit for these zones defined by the input parameter.
📈 Trading Logic:
🚀 Identifying Breakouts:
The strategy looks for when the price breaks (breakouts) a resistance or support level.
If the price breaks upward through the resistance level, a buy order 📈 is triggered.
If the price breaks downward through the support level, a sell order 📉 is triggered.
🔔 Alerts:
Resistance Break (ResBreak) and Support Break (SupBreak) alerts are configured to notify users when a significant breakout occurs.
💰 Commissions:
The strategy includes a commission (0.1%) to simulate transaction costs for each trade.
📊 Chart Visualization:
The support and resistance zones are displayed as colored rectangles:
🔴 Resistance (red) and
🔵 Support (blue).
Pivots of support and resistance can be labeled as P (for resistance) and V (for support).
Breakouts of support or resistance levels are marked with triangles that appear on the chart 🔺🔻.
📈 Trading Strategy:
If the price breaks upward through the resistance level, a long position (buy) 📈 is opened.
If the price breaks downward through the support level, a short position (sell) 📉 is opened.
🏆 Conclusion:
This script is a dynamic breakout strategy 💥 that allows traders to capture significant price movements when support or resistance channels break. The customizable parameters let users fine-tune the strategy according to their preferences, while the visual alerts on the chart make it easier to follow trading opportunities. The inclusion of moving averages and key price zones adds an extra layer of analysis to improve decision-making 💡.

FVG Breakout Lite by tradingbauhausExplanation of "FVG Breakout Lite by tradingbauhaus"
This script is a trading strategy built for TradingView that helps you spot and trade "Fair Value Gaps" (FVGs)—price areas where the market moved quickly, leaving a gap that might act as support or resistance later. It’s designed to catch breakout opportunities when the price moves strongly in one direction, with extra filters to make trades more reliable. Here’s how it works and how you can use it:
What It Does
1. Finds Fair Value Gaps (FVGs):
A "Bullish FVG" happens when the price jumps up quickly, leaving a gap below where it didn’t trade much (e.g., today’s low is higher than the high from two bars ago).
A "Bearish FVG" is the opposite: the price drops fast, leaving a gap above (e.g., today’s high is lower than the low from two bars ago).
The script draws colored boxes on your chart to show these gaps: green for bullish, red for bearish.
2. Spots Breakouts:
It looks for "strong" FVGs by comparing them to a trend (based on the highest highs and lowest lows over a set period).
If a bullish gap forms above the recent highs, or a bearish gap below the recent lows, it’s marked as a breakout opportunity.
3. Adds a Volume Check:
Trades only happen if the market’s volume is higher than usual (e.g., 1.2x the average volume over the last 20 bars). This helps ensure the breakout has real momentum behind it.
4. Trades Automatically:
Long Trades (Buy): If a bullish breakout FVG forms and volume is high, it buys at the current price.
Short Trades (Sell): If a bearish breakout FVG forms with high volume, it sells short.
Each trade comes with a stop loss (to limit losses) and a take profit (to lock in gains), both adjustable by you.
5. Shows Mitigation Lines (Optional):
If you turn on "Display Mitigation Zones," it draws lines at the edge of each breakout FVG. These lines show where the price might return to "fill" the gap later, helping you see key levels.
6. Includes Webull Costs:
The script factors in real trading fees from Webull, like tiny SEC and FINRA fees for selling, and a daily margin cost if you’re borrowing money to trade. These don’t show up on the chart but affect the strategy’s performance in backtesting.
How to Use It
1. Add to Your Chart:
Copy the script into TradingView’s Pine Editor, click "Add to Chart," and it’ll start drawing FVGs and running the strategy.
2. Customize Settings:
Trend Period (Default: 25): How many bars it looks back to define the trend. Longer periods mean fewer but stronger signals.
Volume Lookback (Default: 20) & Volume Threshold (Default: 1.2): Adjust how it measures "high volume." Increase the threshold for stricter trades.
Stop Loss % (Default: 1.5%) & Take Profit % (Default: 3%): Set how much you’re willing to lose or aim to gain per trade.
Margin Rate % (Default: 8.74%): Webull’s rate for borrowing money—lower it if your account qualifies for a better rate.
Display Mitigation Zones (Default: On): Toggle this to see or hide the gap lines.
Colors: Change the green (bullish) and red (bearish) shades to suit your chart.
3. Backtest It:
Go to the "Strategy Tester" tab in TradingView to see how it performs on past data. It’ll show trades, profits, losses, and Webull fees included.
4. Watch It Work:
Green boxes mean bullish FVGs; red boxes mean bearish FVGs. If volume spikes and the price breaks out, you’ll see trades happen automatically.
What to Expect
Visuals: You’ll see colored boxes for FVGs and optional lines showing where they start. These help you spot key price zones even if you’re not trading.
Trades: It’s selective—only trades when FVGs align with a breakout and volume confirms it. Expect fewer trades but with higher potential.
Risk: The stop loss keeps losses in check, while the take profit aims for a 2:1 reward-to-risk ratio by default (3% gain vs. 1.5% loss).
Costs: Webull’s fees are small but baked into the results, so you’re seeing a realistic picture of profits.
Tips for Users
Test it on a small timeframe (like 5-minute charts) for day trading or a larger one (like daily) for swing trading.
Play with the volume threshold—if you get too few trades, lower it (e.g., 1.1); if too many, raise it (e.g., 1.5).
Watch how price reacts to the mitigation lines—they’re often support or resistance zones traders target.
This strategy is lightweight, focused, and built for traders who like breakouts with a bit of confirmation. It’s not foolproof (no strategy is!), but it gives you a clear way to trade FVGs with some smart filters.

3x Supertrend (for Vietnamese stock market and vn30f1m)The 4Vietnamese 3x Supertrend Strategy is an advanced trend-following trading system developed in Pine Script™ and designed for publication on TradingView as an open-source strategy under the Mozilla Public License 2.0. This strategy leverages three Supertrend indicators with different ATR lengths and multipliers to identify optimal trade entries and exits while dynamically managing risk.
Key Features:
Option to build and hold long term positions with entry stop order. Try this to avoid market complex movement and retain long term investment style's benefits.
Advanced Entry & Exit Optimization: Includes configurable stop-loss mechanisms, pyramiding, and exit conditions tailored for different market scenarios.
Dynamic Risk Management: Implements features like selective stop-loss activation, trade window settings, and closing conditions based on trend reversals and loss management.
This strategy is particularly suited for traders seeking a systematic and rule-based approach to trend trading. By making it open-source, we aim to provide transparency, encourage community collaboration, and help traders refine and optimize their strategies for better performance.
License:
This script is released under the Mozilla Public License 2.0, allowing modifications and redistribution while maintaining open-source integrity.
Happy trading!

Ultimate Stochastics Strategy by NHBprod Use to Day Trade BTCHey All!
Here's a new script I worked on that's super simple but at the same time useful. Check out the backtest results. The backtest results include slippage and fees/commission, and is still quite profitable. Obviously the profitability magnitude depends on how much capital you begin with, and how much the user utilizes per order, but in any event it seems to be profitable according to backtests.
This is different because it allows you full functionality over the stochastics calculations which is designed for random datasets. This script allows you to:
Designate ANY period of time to analyze and study
Choose between Long trading, short trading, and Long & Short trading
It allows you to enter trades based on the stochastics calculations
It allows you to EXIT trades using the stochastics calculations or take profit, or stop loss, Or any combination of those, which is nice because then the user can see how one variable effects the overall performance.
As for the actual stochastics formula, you get control, and get to SEE the plot lines for slow K, slow D, and fast K, which is usually not considered.
You also get the chance to modify the smoothing method, which has not been done with regular stochastics indicators. You get to choose the standard simple moving average (SMA) method, but I also allow you to choose other MA's such as the HMA and WMA.
Lastly, the user gets the option of using a custom trade extender, which essentially allows a buy or sell signal to exist for X amount of candles after the initial signal. For example, you can use "max bars since signal" to 1, and this will allow the indicator to produce an extra sequential buy signal when a buy signal is generated. This can be useful because it is possible that you use a small take profit (TP) and quickly exit a profitable trade. With the max bars since signal variable, you're able to reenter on the next candle and allow for another opportunity.
Let me know if you have any questions! Please take a look at the performance report and let me know your thoughts! :)

Futures Engulfing Candle Size Strategy (Ticks, TP/SL)The Futures Candle Size Strategy is designed to identify and trade significant price movements in the futures market based on candle size. It is optimized for futures instruments like ES, NQ, or CL, where precise tick-level calculations are essential. The strategy includes a customizable take profit and stop loss in ticks and operates only within a specified time window (e.g., 7:00 AM to 9:15 AM CST).
Key Features:
Candle Size Threshold: Trades are triggered when the candle's high-to-low range exceeds the defined threshold in ticks.
Time Filter: Limits trades to the most active market hours, specifically between 7:00 AM and 9:15 AM CST.
Take Profit and Stop Loss: Customizable exit levels in ticks to manage risk and lock in profits.
Long and Short Trades: Automatically places buy or sell orders based on the candle's direction (bullish or bearish).
Alerts: Sends alerts whenever a trade is triggered, helping you stay informed in real-time.
How It Works:
The strategy calculates the size of each candle in ticks and compares it to the user-defined threshold.
If the candle size meets or exceeds the threshold within the specified time range, it triggers a long or short trade.
The trade automatically exits when the price hits the take profit or stop loss levels.

Mean Reversion Pro Strategy [tradeviZion]Mean Reversion Pro Strategy : User Guide
A mean reversion trading strategy for daily timeframe trading.
Introduction
Mean Reversion Pro Strategy is a technical trading system that operates on the daily timeframe. The strategy uses a dual Simple Moving Average (SMA) system combined with price range analysis to identify potential trading opportunities. It can be used on major indices and other markets with sufficient liquidity.
The strategy includes:
Trading System
Fast SMA for entry/exit points (5, 10, 15, 20 periods)
Slow SMA for trend reference (100, 200 periods)
Price range analysis (20% threshold)
Position management rules
Visual Elements
Gradient color indicators
Three themes (Dark/Light/Custom)
ATR-based visuals
Signal zones
Status Table
Current position information
Basic performance metrics
Strategy parameters
Optional messages
📊 Strategy Settings
Main Settings
Trading Mode
Options: Long Only, Short Only, Both
Default: Long Only
Position Size: 10% of equity
Starting Capital: $20,000
Moving Averages
Fast SMA: 5, 10, 15, or 20 periods
Slow SMA: 100 or 200 periods
Default: Fast=5, Slow=100
🎯 Entry and Exit Rules
Long Entry Conditions
All conditions must be met:
Price below Fast SMA
Price below 20% of current bar's range
Price above Slow SMA
No existing position
Short Entry Conditions
All conditions must be met:
Price above Fast SMA
Price above 80% of current bar's range
Price below Slow SMA
No existing position
Exit Rules
Long Positions
Exit when price crosses above Fast SMA
No fixed take-profit levels
No stop-loss (mean reversion approach)
Short Positions
Exit when price crosses below Fast SMA
No fixed take-profit levels
No stop-loss (mean reversion approach)
💼 Risk Management
Position Sizing
Default: 10% of equity per trade
Initial capital: $20,000
Commission: 0.01%
Slippage: 2 points
Maximum one position at a time
Risk Control
Use daily timeframe only
Avoid trading during major news events
Consider market conditions
Monitor overall exposure
📊 Performance Dashboard
The strategy includes a comprehensive status table displaying:
Strategy Parameters
Current SMA settings
Trading direction
Fast/Slow SMA ratio
Current Status
Active position (Flat/Long/Short)
Current price with color coding
Position status indicators
Performance Metrics
Net Profit (USD and %)
Win Rate with color grading
Profit Factor with thresholds
Maximum Drawdown percentage
Average Trade value
📱 Alert Settings
Entry Alerts
Long Entry (Buy Signal)
Short Entry (Sell Signal)
Exit Alerts
Long Exit (Take Profit)
Short Exit (Take Profit)
Alert Message Format
Strategy name
Signal type and direction
Current price
Fast SMA value
Slow SMA value
💡 Usage Tips
Consider starting with Long Only mode
Begin with default settings
Keep track of your trades
Review results regularly
Adjust settings as needed
Follow your trading plan
⚠️ Disclaimer
This strategy is for educational and informational purposes only. It is not financial advice. Always:
Conduct your own research
Test thoroughly before live trading
Use proper risk management
Consider your trading goals
Monitor market conditions
Never risk more than you can afford to lose
📋 Release Notes
14 January 2025
Added New Fast & Slow SMA Options:
Fibonacci-based periods: 8, 13, 21, 144, 233, 377
Additional period: 50
Complete Fast SMA options now: 5, 8, 10, 13, 15, 20, 21, 34, 50
Complete Slow SMA options now: 100, 144, 200, 233, 377
Bug Fixes:
Fixed Maximum Drawdown calculation in the performance table
Now using strategy.max_drawdown_percent for accurate DD reporting
Previous version showed incorrect DD values
Performance metrics now accurately reflect trading results
Performance Note:
Strategy tested with Fast/Slow SMA 13/377
Test conducted with 10% equity risk allocation
Daily Timeframe
For Beginners - How to Modify SMA Levels:
Find this line in the code:
fastLength = input.int(title="Fast SMA Length", defval=5, options= )
To add a new Fast SMA period: Add the number to the options list, e.g.,
To remove a Fast SMA period: Remove the number from the options list
For Slow SMA, find:
slowLength = input.int(title="Slow SMA Length", defval=100, options= )
Modify the options list the same way
⚠️ Note: Keep the periods that make sense for your trading timeframe
💡 Tip: Test any new combinations thoroughly before live trading
"Trade with Discipline, Manage Risk, Stay Consistent" - tradeviZion

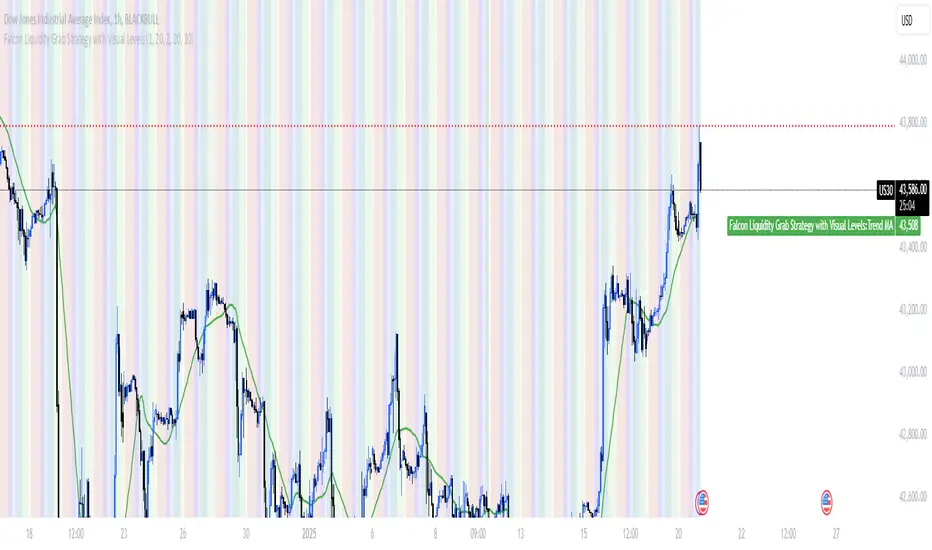
Falcon Liquidity Grab StrategyHow to Use This Script for Commodities and Indices
Best Timeframes: Start with 15-minute charts but test on higher timeframes like 1 hour for indices.
Risk Settings: Adjust the stop_loss_points and take_profit_multiplier to match the volatility of the chosen instrument.
Fibonacci Trend - Aynet1. Inputs
lookbackPeriod: Defines the number of bars to consider for calculating swing highs and lows. Default is 20.
fibLevel1 to fibLevel5: Fibonacci retracement levels to calculate price levels (23.6%, 38.2%, 50%, 61.8%, 78.6%).
useTime: Enables or disables time-based Fibonacci projections.
riskPercent: Defines the percentage of risk for trading purposes (currently not used in calculations).
2. Functions
isSwingHigh(index): Identifies a swing high at the given index, where the high of that candle is higher than both its previous and subsequent candles.
isSwingLow(index): Identifies a swing low at the given index, where the low of that candle is lower than both its previous and subsequent candles.
3. Variables
swingHigh and swingLow: Store the most recent swing high and swing low prices.
swingHighTime and swingLowTime: Store the timestamps of the swing high and swing low.
fib1 to fib5: Fibonacci levels based on the difference between swingHigh and swingLow.
4. Swing Point Detection
The script checks if the last bar is a swing high or swing low using the isSwingHigh() and isSwingLow() functions.
If a swing high is detected:
The high price is stored in swingHigh.
The timestamp of the swing high is stored in swingHighTime.
If a swing low is detected:
The low price is stored in swingLow.
The timestamp of the swing low is stored in swingLowTime.
5. Fibonacci Levels Calculation
If both swingHigh and swingLow are defined, the script calculates the Fibonacci retracement levels (fib1 to fib5) based on the price difference (priceDiff = swingHigh - swingLow).
6. Plotting Fibonacci Levels
Fibonacci levels (fib1 to fib5) are plotted as horizontal lines using the line.new() function.
Labels (e.g., "23.6%") are added near the lines to indicate the level.
Lines and labels are color-coded:
23.6% → Blue
38.2% → Green
50.0% → Yellow
61.8% → Orange
78.6% → Red
7. Filling Between Fibonacci Levels
The plot() function creates lines for each Fibonacci level.
The fill() function is used to fill the space between two levels with semi-transparent colors:
Blue → Between fib1 and fib2
Green → Between fib2 and fib3
Yellow → Between fib3 and fib4
Orange → Between fib4 and fib5
8. Time-Based Fibonacci Projections
If useTime is enabled:
The time difference (timeDiff) between the swing high and swing low is calculated.
Fibonacci time projections are added based on multiples of 23.6%.
If the current time reaches a projected time, a label (e.g., "T1", "T2") is displayed near the high price.
9. Trading Logic
Two placeholder variables are defined for trading logic:
longCondition: Tracks whether a condition for a long trade is met (currently not implemented).
shortCondition: Tracks whether a condition for a short trade is met (currently not implemented).
These variables can be extended to define entry/exit signals based on Fibonacci levels.
How It Works
Detect Swing Points: It identifies recent swing high and swing low points on the chart.
Calculate Fibonacci Levels: Based on the swing points, it computes retracement levels.
Visualize Levels: Plots the levels on the chart with labels and fills between them.
Time Projections: Optionally calculates time-based projections for future price movements.
Trading Opportunities: The framework provides tools for detecting potential reversal or breakout zones using Fibonacci levels.
Custom Strategy: ETH Martingale 2.0Strategic characteristics
ETH Little Martin 2.0 is a self-developed trading strategy based on the Martingale strategy, mainly used for trading ETH (Ethereum). The core idea of this strategy is to place orders in the same direction at a fixed price interval, and then use Martin's multiple investment principle to reduce losses, but this is also the main source of losses.
Parameter description:
1 Interval: The minimum spacing for taking profit, stop loss, and opening/closing of orders. Different targets have different spacing. Taking ETH as an example, it is generally recommended to have a spacing of 2% for fluctuations in the target.
2 Base Price: This is the price at which you triggered the first order. Similarly, I am using ETH as an example. If you have other targets, I suggest using the initial value of a price that can be backtesting. The Base Price is only an initial order price and has no impact on subsequent orders.
3 Initial Order Amount: Users can set an initial order amount to control the risk of each transaction. If the stop loss is reached, we will double the amount based on this value. This refers to the value of the position held, not the number of positions held.
4 Loss Multiplier: The strategy will increase the next order amount based on the set multiple after the stop loss, in order to make up for the previous losses through a larger position. Note that after taking profit, it will be reset to 1 times the Initial Order Amount.
5. Long Short Operation: The first order of the strategy is a multiple entry, and in subsequent orders, if the stop loss is reached, a reverse order will be opened. The position value of a one-way order is based on the Loss Multiplier multiple investment, so it is generally recommended that the Loss Multiplier default to 2.
Improvement direction
Although this strategy already has a certain trading logic, there are still some improvement directions that can be considered:
1. Dynamic adjustment of spacing: Currently, the spacing is fixed, and it can be considered to dynamically adjust the spacing based on market volatility to improve the adaptability of the strategy. Try using dynamic spacing, which may be more suitable for the actual market situation.
2. Filtering criteria: Orders and no orders can be optimized separately. The biggest problem with this strategy is that it will result in continuous losses during fluctuations, and eventually increase the investment amount. You can consider filtering out some fluctuations or only focusing on trend trends.
3. Risk management: Add more risk management measures, such as setting a maximum loss limit to avoid huge losses caused by continuous stop loss.
4. Optimize the stop loss multiple: Currently, the stop loss multiple is fixed, and it can be considered to dynamically adjust the multiple according to market conditions to reduce risk.

Fibonacci Levels Strategy with High/Low Criteria-AYNETThis code represents a TradingView strategy that uses Fibonacci levels in conjunction with high/low price criteria over specified lookback periods to determine buy (long) and sell (short) conditions. Below is an explanation of each main part of the code:
Explanation of Key Sections
User Inputs for Higher Time Frame and Candle Settings
Users can select a higher time frame (timeframe) for analysis and specify whether to use the "Current" or "Last" higher time frame (HTF) candle for calculating Fibonacci levels.
The currentlast setting allows flexibility between using real-time or the most recent closed higher time frame candle.
Lookback Periods for High/Low Criteria
Two lookback periods, lowestLookback and highestLookback, allow users to set the number of bars to consider when finding the lowest and highest prices, respectively.
This determines the criteria for entering trades based on how recent highs or lows compare to current prices.
Fibonacci Levels Configuration
Fibonacci levels (0%, 23.6%, 38.2%, 50%, 61.8%, 78.6%, and 100%) are configurable. These are used to calculate price levels between the high and low of the higher time frame candle.
Each level represents a retracement or extension relative to the high/low range of the HTF candle, providing important price levels for decision-making.
HTF Candle Calculation
HTF candle data is calculated based on the higher time frame selected by the user, using the newbar check to reset htfhigh, htflow, and htfopen values.
The values are updated with each new HTF bar or as prices move within the same HTF bar to track the highest high and lowest low accurately.
Set Fibonacci Levels Array
Using the calculated HTF candle's high, low, and open, the Fibonacci levels are computed by interpolating these values according to the user-defined Fibonacci levels.
A fibLevels array stores these computed values.
Plotting Fibonacci Levels
Each Fibonacci level is plotted on the chart with a different color, providing visual indicators for potential support/resistance levels.
High/Low Price Criteria Calculation
The lowest and highest prices over the specified lookback periods (lowestLookback and highestLookback) are calculated and plotted on the chart. These serve as dynamic levels to trigger long or short entries.
Trade Signal Conditions
longCondition: A long (buy) signal is generated when the price crosses above both the lowest price criteria and the 50% Fibonacci level.
shortCondition: A short (sell) signal is generated when the price crosses below both the highest price criteria and the 50% Fibonacci level.
Executing Trades
Based on the longCondition and shortCondition, trades are entered with the strategy.entry() function, using the labels "Long" and "Short" for tracking on the chart.
Strategy Use
This strategy allows traders to utilize Fibonacci retracement levels and recent highs/lows to identify trend continuation or reversal points, potentially providing entry points aligned with larger market structure. Adjusting the lowestLookback and highestLookback along with Fibonacci levels enables a customizable approach to suit different trading styles and market conditions.

Harmony Signal Flow By ArunThis Pine Script strategy, titled "Harmony Signal Flow By Arun," uses the Relative Strength Index (RSI) indicator to generate buy and sell signals based on custom thresholds. The script incorporates stop-loss and target management and restricts new trades until the previous position closes. Here's a detailed description:
Custom RSI Metric:
The strategy calculates a 5-period RSI based on the closing price, aiming for a more responsive measure of price momentum.
RSI thresholds are defined:
Lower threshold (30): Indicates oversold conditions, triggering a potential buy.
Upper threshold (70): Indicates overbought conditions, prompting a possible sell.
Entry Conditions:
Buy Signal: The strategy initiates a buy order when the RSI crosses above the lower threshold (30), indicating a shift from oversold conditions.
Sell Signal: A sell order is triggered when the RSI crosses below the upper threshold (70), suggesting an overbought reversal.
Only one order (buy or sell) can be active at a time, ensuring that a new trade begins only when there’s no existing position.
Stop-Loss and Target Management:
For each trade, stop-loss and target conditions are applied to manage risk and secure profits.
For Buy Positions:
Stop-loss is set 100 points below the entry price.
Target is set 150 points above the entry price.
For Sell Positions:
Stop-loss is set 100 points above the entry price.
Target is 150 points below the entry price.
The strategy closes the trade when either the stop-loss or target is met, marking the trade as "closed" and allowing a new trade entry.
Trade Sequencing:
A new trade (buy or sell) is only permitted after the previous position hits either its stop-loss or target, preventing overlapping trades and ensuring clear trade sequences.
This sequential approach enhances risk management by ensuring only one active position at any time.
End-of-Day Closure:
All open positions are closed automatically at 3:25 PM (Indian market time) to avoid overnight exposure, ensuring the strategy remains strictly intraday.
The flag for trade entry is reset at the end of each day, enabling fresh trades the next day.
Chart Indicators:
The script plots buy and sell signals directly on the chart with visible labels.
It also displays the custom RSI metric with horizontal lines for the lower and upper thresholds, providing visual cues for entry and exit points.
Summary
This strategy is a momentum-based intraday trading approach that uses the RSI for identifying potential reversals and manages trades through predefined stop-loss and target levels. By enforcing trade sequencing and closing positions at the end of the trading day, it prioritizes risk management and seeks to capitalize on short-term trends while avoiding overnight market risks.
