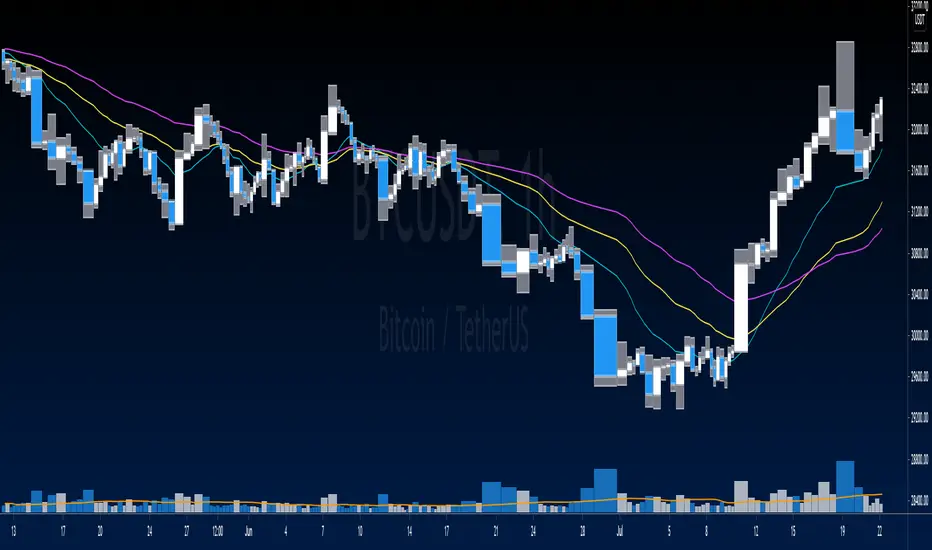
Equivolume BarsEquivolume bars. Width is determined by volume. Please note that equivolume bars are rendered independently of the time scale.
Makes use of @LonesomeTheBlue's "Start the Script on Last Nth Bar" in order to prevent time out. As such you are only able to view the most recent bars and no bar replay beyond that range.
Поиск скриптов по запросу "bar"
Trail with Bar Time [NBL]Hello Everyone its Trailing stop loss Indicator with Bar Time if you want to Trail Your position with Specific Bar or time You can also Trail. Basically, its indicator we are using automation Trading
How to work its indicator?
➤ if you want to Trail Your Position according to Specific Bar or time
Indicator Feature
➤ Long Side TSL hit With Alerts
➤ Short Side TSL hit With Alerts
➤ Both Side TSL hit With Alerts
➤ You can also Select Specific Bar
➤ You Can Also add Trailing with Percentage or Point
➤ You Can Also Select Trailing calculate Bar Source Like Open, Close, High, Low etc More.
Important: This Indicator we are using for Automation Trading if You Want This Indicator Access Please Contact me PM on Tradingview
Индикатор Pine Script®
Start the Script on Last Nth Bar [Experimental]Hello Pine Scripters,
Sometimes we need to run some processes in the scripts on last N bar but currently we don't know bar_index value of realtime bar or number of remaining bars before we reached it. So most of us use "start date" as input and run some processes after "start date".
This experimental script finds last Nth bar approximately. As you can see in the script we (should) use GMT, otherwise as I see the result might not be accurate (we don't know timezone used on the chart)
The idea is to find/use similar bar in the past (using timenow as reference) and then calculate aproximate the time of last Nth bar. the results may not be accurate all the time, also we can not know local holidays etc.
At the moment the script works on 1minute or higher time frames (it won't work on less 1min timeframes)
In the future if the Pine Team add something like "bar_index_realtime" then we will not need such things. by the way many thanks to Pine Team, they are doing great job.
You can use this script in your scripts as you want, no need to ask permission. If you can improve it let me know ;)
Enjoy!
Индикатор Pine Script®
3 Bar Triangle Breakout////Current bar's High is less than the 3rd bar's High///
/// and Current bar's Low to be higher the 3rd bar's Low.////
////This then predicts the market might breakout to new levels ////
///within 2-3 of the next coming bars///
////Entry occurs when have two inside days and close break candle three high or low//
//If need more information recommend google search/////
I have coded when candle conducts breakout the formation above is the setup criteria !!
Индикатор Pine Script®
Hide Extended Hours/non-intraday American BarsOnly works with American bar style.
Not works with Candles.
--------
This script can hide the extended hours/non-intraday bars and leave the intraday bars only, especially for future users, such as ES/NQ/RTY/YM, etc.,.
Now you can find the intraday support/resistance quite easily!
Example, as a ES investor, you can easily find the intraday support/resistance level ,which is almost equal to SPY / SPX , no longer need to check SPY / SPX separately again, saving your time a lot.
--------
IMPORTANT INSTRUCTION
In order to make the script work, you have to bring it to the most top visual layer.
Please do as the following steps:
Add the script to chart
Hover mouse on the script name, and tap the right-most 'more' button (which appears as 3 dots)
Select "Visual Order", then select "Bring to front".
Done!
Also, in order to have a better view effect and make the bars COMPLETELY "Hidden", you can adjust the hidden bar color in the "setting" menu to the exact color of your chart background.
Индикатор Pine Script®
PowerX Strategy Bar Coloring [OFFICIAL VERSION]This script colors the bars according to the PowerX Strategy by Markus Heitkoetter:
The PowerX Strategy uses 3 indicators:
- RSI (7)
- Stochastics (14, 3, 3)
- MACD (12, 26 , 9)
The bars are colored GREEN if...
1.) The RSI (7) is above 50 AND
2.) The Stochastic (14, 3, 3) is above 50 AND
3.) The MACD (12, 26, 9) is above its Moving Average, i.e. MACD Histogram is positive.
The bars are colored RED if...
1.) The RSI (7) is below 50 AND
2.) The Stochastic (14, 3, 3) is below 50 AND
3.) The MACD (12, 26, 9) is below its Moving Average, i.e. MACD Histogram is negative.
If only 2 of these 3 conditions are met, then the bars are black (default color)
We highly recommend plotting the indicators mentioned above on your chart, too, so that you can see when bars are getting close to being "RED" or "GREEN", e.g. RSI is getting close to the 50 line.
Индикатор Pine Script®
Trend Following BarWhile analysing a chart, one of the biggest problem is to see if there is trend or not. While thinking about it, I found the idea to analyse moving averages in channel and their momentum according to channel width.
How it Works?
On each bar it creates a channel by highest/lowest point of a MA. highest point is upper line and lowest point is lower line of the MA channel,
It gets highest and lowest point of last 300 bars, (say Price Channel)
If the width of MA channel is greater than certain rate of price channel then it decides there is trend
After it decided there is trend, it calculates the rate between channel and MA. Bigger result means stronger trend.
According to rate of MA channel and the price channel, bar color becomes lighter/darker. so when you look at the bar color you can see the trend strength.
Some details about my idea:
Options:
You can choose following MA types as source: EMA, SMA, RMA, WMA, VWMA
"Period to Check Trend" is the period to create MA channel. Bigger period cause more sensitivity.
"Trend Channel Rate %" is rate of price channel. Price channel created by using highest/lowest of last 300 bars. I did this to make the script works on all time frames correctly.
"Use Linear Regression" is used to get rid of noise. it may cause 1-2 bars latency.
All comments are welcome!.
Enjoy!
Индикатор Pine Script®
Elephant Bar by Oliver VelezThis script detects an event created by Oliver Velez, basically it is a wide-range candle, its range is noticeably larger than the previous candles, this event indicates a possible continuation of the movement, or the beginning of an extended movement. The candle has to be of good body, as a rule it can be taken that the body must be more than 70%. The stop goes below the minimum of the candle and the signal is given when the next candle followed by the elephant candle exceeds its body, this condition is not programmed so that the alert indicates that an elephant candle was generated and the trader has some time to visualize the graph and wait for the signal. Example below:
NOTE: IT IS VERY IMPORTANT THAT THE TRADER ANALYZE THE CONTEXT OF THE MARKET WHERE THE ELEPHANT BAR IS GENERATED AND DETERMINE ACCORDING TO ITS EXPERIENCE IF THE EVENT HAS A GOOD PROBABILITY OF PROJECTION, YOU MUST NOT TAKE AN ENTRY ONLY BY THIS EVENT, IF YOU DO YOU WILL LOSE ALL YOUR MONEY
.
One of the problems of the elephant bar is that it generates a fairly wide risk unit with respect to other narrow range events, so the risk / benefit ratio is not very large, but it is an event that deserves attention when it occurs in a good location since it generally generates continuation.
If you want to have a lower risk unit and improve the risk / benefit ratio, you can play the “Gift Zone”, when detecting an elephant bar you can wait for a step back inside the elephant bar area and take a position, this will give you a less distance to the stop, but this can lead to the event escaping if there is no recoil.
- The size of the candle is determined by comparing a range of previous candles (you can set the amount at your discretion)
- Search factor: by default 1.3, this means that all bars that have a range greater than the average range of previous candles + 30%, are considered elephant candles (can be configured at your discretion)
- Possibility to configure the percentage of the body that the elephant candle must have.
- Possibility of filtering up to 2 means with direction detection and color change (fully configurable)
- Possibility of filtering by mobile averages
- Alerts
- Additional features
Thumb up if you liked me ..
Индикатор Pine Script®
ATR Squeeze Identifier + Last-Bar TR Stops1) Paints two lines based on previous bar's true range, has option for custom multiplier to make stop a factor of previous bar's TR. Used for quick identification of stop loss placement based on previous bar set-ups.
2) Identifies bar on close which has true range that is smaller than a period-chosen ATR criteria. Additionally, has an input for a raw "ATR Shave" which is used to narrow down bars with even smaller true range. Mostly used to identify potential entry zones where market is being squeezed, and expansion is likely to follow. Plots a character under the bar.
3) Identifies a close which includes and follows 5 consecutive closes which all exhibit smaller than average ATR. Includes customize-able ATR length and "ATR Shave" to narrow down tighter range's. Paints circle at bottom of chart. Mostly used to identify when market has been 'quiet' for some time and entries should be considered for likely expansion.
Индикатор Pine Script®
Inside Bar and Outside Bar Simple indicator, to show outside bars and inside bars
inside sellbar = "I" in red color
inside buybar = "I" in green color
Outside sellbar = "O" in red color
Outside buybar = "O" in green color
----------//---------------
PT-BR
Indicador simples, para mostrar outside bars e inside bars
inside sellbar = "I" na cor vermelha
inside buybar = "I" na cor verde
Outside sellbar = "O" na cor vermelha
Outside buybar = "O" na cor verde
Индикатор Pine Script®
ck - Inner Bars Indicator with Alerts and Trailing Stop v1*** Please check out the matching Strategy to accompany this Indicator to allow you to fully backtest! ***
Inner Bar trading strategy is where the "inside" bar (or candle to the right) within a pair is smaller and within the high to low range of the prior bar, as this pattern tends to be somewhat predictable; especially in "chop" or sideways trading, it is useful to have in your tool box.
Features include:
Complimentary strategy you can add as well as the indicator to backtest and tune your settings before live trading
Trailing Stoploss to wring every cent from a trade
Clear Alert labels have been coded in for use with trading bots, 3commas is recommended.
Enable/Disable Shorts in addition to Longs
Visual chart shapes - Pink Triangle = Long, Purple Triangle = Short, Thin Green Arrow = Profit, Thin Red Arrow = Loss
Realtime Deal Status - Plotlines include Yellow = Entry Price, Green = Trailing Stop Profit, Red - Hard Stoploss
A further feature is that you can disable Shorts (therefore only Longing) for use with exchanges
that only allow you to Long, such as Binance & Coinbase.
Additionally, this Indicator will close a trade before opening the next, so a single exchange
account (BitMEX for example) is all that is required versus having separate accounts to long or
short on the same chart.
This strategy is intended to use $100 of capital, traded at 2.5% per order with 10x lev on Bitmex.
If you like my work, please use my referral links (you will receive discounts!)
3commas trading bots (now with Bitmex support and a lot more!) - 3commas.io
BitMEX - www.bitmex.com
If you have any comments or suggestions, please message me via TradingView.
Based on the core "Inner Bars" concept found at:
backtest-rookies.com
with original inspiration/idea from babypips.com
Индикатор Pine Script®
ck - Inner Bars Strategy v1*** Please check out the matching Indicator to accompany this Strategy to allow you to fully backtest! ***
Inner Bar trading strategy is where the "inside" bar (or candle to the right) within a pair is smaller and within the high to low range of the prior bar, as this pattern tends to be somewhat predictable; especially in "chop" or sideways trading, it is useful to have in your tool box.
Features include:
Complimentary Indicator you can add as well as this strategy to backtest and tune your settings before live trading
Trailing Stoploss to wring every cent from a trade
Indicator only: Clear Alert labels have been coded in for use with trading bots, 3commas is recommended.
Enable/Disable Shorts in addition to Longs
A further feature is that you can disable Shorts (therefore only Longing) for use with exchanges
that only allow you to Long, such as Binance & Coinbase.
Additionally, this Indicator will close a trade before opening the next, so a single exchange
account (BitMEX for example) is all that is required versus having separate accounts to long or
short on the same chart.
This strategy is intended to use $100 of capital, traded at 2.5% per order with 10x lev on Bitmex.
If you like my work, please use my referral links (you will receive discounts!)
3commas trading bots (now with Bitmex support and a lot more!) - 3commas.io
BitMEX - www.bitmex.com
If you have any comments or suggestions, please message me via TradingView.
Based on the core "Inner Bars" concept found at:
backtest-rookies.com
with original inspiration/idea from babypips.com
Стратегия Pine Script®
Candlestick Trading Bible pack: Engulfing + Pin bar + Inside barHelpful indicator that overlays the price with colors and arrows for understanding easily engulfing, pin bar and inside bar formations as seen in the book "The Candlestick Trading Bible" IG of writer: @price.action.strategies
How it works:
-Bullish engulfing: yellow
-Bearish engulfing: fuchsia
-Pin bars: up/down green/red arrows
-Inside bars: white circle above the inside candle
----------
I do not have any relationship with the writer or the book mentioned above. The explanations in it may differ from what is drawn on the graph.
Индикатор Pine Script®
Stochastic with False bar R2-2 by JustUncleLThis study project is an updated version of the implementation of the "Stochastic False BAR" indicator.
Description:
The standard Stochastic buy/sell indications come from Stochastic crosses about the standard overbought/oversold zones (80/20). This does not always work and you get stuck in the OB/OS zones with a trend continuation. Utilising a second much longer length Stochastic, the "False BAR" (Black) indicates when it is unsafe to take Stochastic cross over trades. Where the false bar does not appear (aqua, no background highlighing), the overbought / oversold conditions of the Stochastic can be considered higher-probability reversal areas and thus trading opportunities.
This Revision:
Added options to enable/disable False Bar lines and Stochastic trends.
Added options to modify upper and lower limits of false bar Stochastic and trading stochastic trend.
Added option to show the trading Stochastic as coloured Ribbon.
Added name titles for all plots
Added Background highlighting for False Bar.
Индикатор Pine Script®
Fractal Resonance BarLazyBear's WaveTrend port has been praised for highlighting trend reversals with precision and punctuality (minimal lag). But strong "3rd Wave" trends can "embed" or saturate any oscillator flashing several premature crosses while stuck overbought/oversold. This happens when the trend stretches over a longer timescale than the oscillator's averaging window or filter time constant. Our solution: monitor many timescales. With Fractal Resonance Bar's rich color codings, strong wavefronts form across timescales and jump out like an approaching line of thunderclouds!
Fractal Resonance Bar color-codes the status of eight underlying stochastic oscillators, with each row averaging over twice the time of the row above.
Fractal Resonance Bar shifts its timescales along with your choice of main chart timescale:
1 minute chart: 1 minute through 128 minute (~2 hour) oscillators.
15 minute chart: 15 minute through 1920 minute (~32 hour) oscillators.
1 hour chart: 1 hour through 128 hour (~2 week) oscillators.
Daily chart: 1 day through 128 day (~4 month) oscillators.
The color map is configured as follows:
Hot Pink: Extreme Overbought (> 100%) rolled over to sell, but oscillators probably embedded with more upside (revert to Dark Green) possible after a pause.
Deep Red: Overbought (> 75%) crossover ripe for selling (validated when red spreads to timescales below).
Brown: Minor (< 75%) crossover sell from which could bounce back green or start a plunge toward gray/black.
Gray/Black: Mature (< -75%) sells turning full black in a plunge before the dawn.
Lime Green: Extreme Oversold (< -100%) and bouncing, though may yet bottom even lower.
Green: Oversold (< -75%) crossover ripe for buy. Green spreading to all timescales below will validate bottom is in.
Dark Green/Teal: Mature buy in overbought (> 75%) range, waiting for sell crossover to Hot Pink for a pause or correction.
White Stripes are Impulsive Trend Warning
Fractal Resonance Bar warns of oscillator embedding by showing white stripes when it detects strong, early surges in the timescale rows below.The white stripes usually accompany Hot Pink warning it's too early to go short, or Lime Green warning it's too early to go long.
Heeding these warnings will probably miss the exact top or bottom, but you're less likely to get overrun in a momentum move.
Usually the market gives us a second opportunity to short very close to the top or buy very close to the bottom after the warning white stripes have subsided.
NOTE: Recently rolled over Futures contracts may not have enough history for all oscillator calculations, in which case no bar colors will appear.
Tweakable Attributes
The default Channel Length, Stochastic Ratio Length and Lag Length work reasonably well on all timescales in our experience. Minor tweaks don't hurt but this may just overfit to a particular chart history.
We don't recommend changing the 75% Overbought and 100% Extreme Overbought default levels as these are ideal numbers relative to the underlying oscillator statistic calculations. But these settings can shift the color transition levels.
Embedded attribute controls the sensitivity/conservativeness of the white strip embedding detectors. Closer to 75 increases the warning sensitivity while closer to 100 decreases the aggressiveness of blocking white stripes.
Embed Separation also affects the white stripe sensitivity.
Row width increases each row's thickness to fill the available screen height you've afforded the bar.
Индикатор Pine Script®
[SpaghettiForex] ABR - Activity Bar Range ABR — Activity Bar Range is a context indicator that highlights on the chart the High–Low range of the most recently active candle, selected within a user-defined lookback.
ABR does not use volume. It estimates activity purely from price movement (True Range or Absolute Return), normalised by ATR. The goal is to provide a clean, objective reference area showing where price has recently expressed the most meaningful impulse.
What it displays:
- An Activity Range Zone: the area between High and Low of the candle with the highest activity score in the selected lookback.
- Optional BRK (breakout) and BDN (breakdown) labels when price breaks the zone while meeting basic quality filters.
________________________________________
Screenshots (examples):
Screenshot 1 — Range context (no labels)
A sideways/ranging phase where ABR provides a single reference zone.
This is a context tool: the zone is the focus, not the signals.
Note: in Dynamic mode the zone updates when a new “highest activity” candle appears inside the lookback.
Screenshot 2 — Clean breakout (BRK)
Example of a BRK label on a breakout above the Activity Range Zone.
Recommended: signals set to bar-close only for cleaner real-time behaviour.
Screenshot 3 — Edge case / false breakout (honest limitation)
Example where a breakout attempt fails and price returns into the zone.
ABR helps with context, but it cannot eliminate false moves—risk management still matters.
________________________________________
How the Activity Range Zone is built:
1. ABR computes an activity score for each candle using either:
- True Range / ATR, or
- Absolute Return / ATR
2. Within the selected lookback, it finds the candle with the highest activity score.
3. It draws the High–Low range of that candle on the chart as the Activity Range Zone.
Practical use
ABR is designed as a context filter for breakout/breakdown reads:
- it can help reduce breakouts triggered on “empty” or low-quality areas,
- it keeps charts clean by providing one key zone at a time,
- it makes the question simple: “Is price truly breaking the range of the most active candle in the recent window?”
BRK / BDN labels (optional):
BRK/BDN labels are not financial advice and do not “decide” trades. They are visual markers triggered when a zone break meets user-defined conditions such as:
- bar-close confirmation (recommended to reduce historical vs real-time differences),
- minimum relative activity vs an SMA (ratio filter),
- close-position quality within the candle,
- minimum distance (ticks) beyond the zone.
Zone update behaviour (Lock Mode):
- Dynamic: the zone updates continuously to follow the most active candle within the lookback.
- Lock After Signal: after a BRK or BDN event, the zone can remain fixed for a more stable reference.
Main settings overview:
- Lookback and activity proxy (no volume)
- Signal filters (bar-close confirmation, activity ratio, candle quality, minimum distance)
- Lock Mode (dynamic vs locked after signal)
- Visual controls (zone fill/lines, colours, labels)
Important note:
ABR is a price-action context tool. It does not provide performance promises and should be used as part of a broader process and sound risk management.
Индикатор Pine Script®
TCT - Range Bar ScalperA confluence-based scalping indicator designed for range bar charts that identifies high-probability trade entries using ADX momentum, Directional Movement bias, and Short-Term Trend direction.
📊 How It Works
This indicator generates buy and sell signals when three key conditions align:
Buy Signal Triggers When:
ADX is above the threshold (default: 20) confirming trend strength
Directional Movement shows bullish bias (DI+ > DI-)
Short-Term Trend candles are bullish
Sell Signal Triggers When:
ADX is above the threshold confirming trend strength
Directional Movement shows bearish bias (DI- > DI+)
Short-Term Trend candles are bearish
🎯 Key Features
Dashboard Panel
Real-time display of Momentum (ADX value), Bias (DM direction), and Direction (STT state)
Color-coded cells for instant visual assessment
Fully customizable position, colors, and text size
Short-Term Trend Candles
Smoothed candles using linear regression to filter noise
Overlaid directly on your chart
Adjustable reaction speed for faster or smoother signals
Smart Signal Logic
Toggle between consecutive signals or alternating buy/sell mode
Optional filter to require bar close in signal direction
Signals only fire when conditions fail and recover (prevents spam)
Confluence Dots (Optional)
Visual status indicators for each component (ADX, DM, STT)
Quickly see which conditions are met or missing
Alerts
Built-in alert conditions for both buy and sell signals
⚙️ Settings
ADX Length
Period for ADX/DI calculation (default: 10)
ADX Threshold
Minimum ADX for signals (default: 20)
STT Speed
Speed for trend candles (5-200, default: 25)
Allow Consecutive Signals
Enable/disable same-direction signal repeats
Require Bar Close in Direction
Filter signals by candle close direction
💡 Best Used On
Range bar charts (primary design intent)
Works on any timeframe but optimized for scalping
Pairs well with support/resistance levels and volume analysis
📝 Notes
Lower STT Speed values react faster to price changes; higher values provide smoother signals
The ADX threshold filters out choppy, sideways markets
Use the confluence dots to understand why signals may not be firing
Индикатор Pine Script®
TCT - Range Bar RiderMulti-signal indicator that combines HAMA (Heikin Ashi Moving Average), ADX, and dynamic trend analysis to identify entry and exit points.
Core features:
Long-term trend visualization: HAMA bars with optional gradient coloring to show trend direction and strength
Three independent signal systems:
Signal 1: Entry/exit signals when price, HAMA, dynamic trend, and ADX align. Separate buy/sell toggles and exit signals
Signal 2: Early reversal signals when HAMA bars transition to neutral. Separate buy/sell toggles
Signal 3: Signals when ADX crosses its threshold or HAMA flips while ADX is strong. Separate buy/sell toggles
Trend strength analysis: ADX visualization with gradient coloring
Moving average: Weighted moving average for trend confirmation
Short-term trend: Linear regression-based dynamic trend indicator with adjustable sensitivity
Customizable: Colors, shapes, and sizes for all signals
Bar close confirmation: Optional requirement that bars close in the signal direction
Exit signals: Automatic exit signals for Signal 1 when conditions change
Signal details:
Signal 1: Triggers when price is above/below the MA, HAMA is bullish/bearish, dynamic trend aligns, and ADX is above threshold. Exits when ADX exceeds the exit threshold or HAMA reverses
Signal 2: Early warning signals when HAMA gradient transitions to neutral, indicating potential trend reversals
Signal 3: Signals when ADX crosses above threshold in the HAMA direction, or when HAMA flips while ADX is already strong
Use cases:
Range-bound and trending markets
Swing trading
Trend-following strategies
Multi-timeframe analysis
Early reversal detection
Customization options:
Enable/disable each signal type independently (buy and sell separately)
Customize colors, shapes, and sizes for all signals
Adjust ADX threshold, smoothing, and gradient steps
Configure HAMA lengths (open, high, low, close) and gradient steps
Toggle gradient effects and visual elements
Adjust dynamic trend sensitivity (5-200)
Configure moving average length and appearance
Alerts included:
Signal 1 Buy/Sell/Exit
Signal 2 Buy/Sell
Signal 3 Buy/Sell
Price crosses above/below moving average
Designed for traders who want a unified view of trend direction, strength, and potential reversal points with granular control over signal types.
Индикатор Pine Script®
Conditional Background & Bar Colorsℹ️ Conditional Background & Bar Colors is a lightweight utility indicator that applies conditional background and candle/bar colors based on user-defined logical rules.
This script is not a trading indicator and does not generate buy or sell signals.
It is designed purely as a visual enhancement layer to help highlight market states or indicator conditions.
🔧 Features
Define multiple independent conditions using:
➤ Comparisons (>, <, =, ≥, ≤)
➤ Cross, crossover, crossunder
➤ Value changes and slope direction
➤ NA / non-NA states
Apply colors to:
➤ Chart background
➤ Candles / bars
➤ Optional “all conditions matched” logic for confluence highlighting
➤ Works with any indicator or price source
Can be applied to:
➤ Main price chart
➤ Indicator panes (e.g. RSI, MACD, custom indicators)
➤ No repainting
➤ No alerts
➤ No strategy or execution logic
🎯 Use Cases
➤ Visual confirmation of indicator alignment
➤ Market regime or bias highlighting
➤ Context awareness for discretionary trading
➤ Conditional coloring inside indicator panes
🎨 Color behavior
➤ Background colors overlap and can be combined using transparency
➤ The “all conditions matched” color overrides individual background colors
➤ Bar colors override each other, where the lowest active condition in the list takes priority
⚠️ Disclaimer
This script provides visual assistance only.
All trading decisions remain the sole responsibility of the user.
Индикатор Pine Script®
Alson Chew PAM EXE and Mother BarIndicators for strategies taught by Alson Chew's Price Action Manipulation (PAM) course
Two functions.
First it identifies EXE bars (Pin, Mark, Icecream bars).
Second it identifies Mother bars and draws an extension line for 6 bars.
Applicable to all time frames and can customise how many signals to show.
To be used in conjunction with trading strategies like
- 20 SMA, 50 SMA, 200 SMA FS formation
- Force Bottom, Force Top FS formation
- UR1 and DR1 using EXE Bar
Индикатор Pine Script®
Watermark | Bar Time | Average Daily RangeMulti Info Panel & Watermark
Multi Info Panel & Watermark is a utility indicator that displays several pieces of chart information in a single, customizable panel. It is designed to support intraday and swing analysis by making key data—such as symbol details, date, and average daily range—easy to see at a glance, as well as providing simple tools for notes and backtesting.
Features
Watermark / Custom Note
Optional text overlay that can be used as a watermark or personal note.
Can display a strategy name, reminder, or any other user-defined label on the chart.
Ticker Info
Shows information about the currently active symbol on the chart (for example, symbol name and other basic details depending on the inputs).
Helps keep track of which market or pair is being analyzed, especially when using multiple charts.
Current Date
Displays the current date directly on the chart.
Useful for screenshots, journaling, and documenting analysis.
Average Daily Range (ADR)
Calculates the average daily range of the active symbol over a user-defined number of recent days.
Helps visualize how much price typically moves in a day, which can support position sizing, target setting, or volatility awareness within your own trading approach.
Open Bar Time Marker
Marks the open time of a selected bar (for example, a session open or a specific reference bar).
Primarily intended as a visual aid for manual backtesting and reviewing historical price action.
Usage
Use the watermark and ticker info to keep your charts labeled and organized.
Refer to the ADR readout to understand typical daily volatility of the instrument you are studying.
Use the date and open bar time marker when creating screenshots, trade journals, or when replaying historical sessions for review.
This script does not generate trading signals and does not guarantee any performance or results. It is provided solely as an informational and visualization tool. Always combine it with your own analysis, risk management, and decision-making. Nothing in this indicator or description should be considered financial advice.
Индикатор Pine Script®
Yash RSI Bars - Multi Timeframersi time frame testing
Only bar coloring - No extra plots or lines
✅ Custom timeframe - Colors bars based on RSI from your selected timeframe
✅ White bars - When RSI is above overbought level (default 70)
✅ Yellow bars - When RSI is below oversold level (default 30)
✅ No color - When RSI is in neutral zone
Clean and simple! 🎯
Индикатор Pine Script®
Price Action - Inside/Outside BarsThis indicator highlights Inside and Outside bars based on Al Brooks' price action philosophy from "Reading Price Charts Bar by Bar." Inside bars (high ≤ previous high and low ≥ previous low) represent contraction and potential breakouts, often leading to two-legged moves. Outside bars (high > previous high and low < previous low with min body 50%) signal volatility and possible reversals or trends. Customizable highlights, lines, and labels help identify high-probability setups in trends or ranges. Always focus on context—buy low, sell high, and wait for confirmation.
Индикатор Pine Script®


