Zahorchak MeasureCreator: Michael G. Zahorchak.
References:
The Art of Low Risk Investing by Michael G. Zahorchak, 1977. Unfortunately, it's all but impossible to find a copy these days.
The Complete Guide to Market Breadth Indicators by Gregory L. Morris, 2006. A fantastic resource for those interested in Technical Analysis or creating their own trend based system.
Two articles by Greg Morris on the Zahorchak Measure. I can't link to them under the House Rules, but they are easily searchable.
The Zahorchak Measure (ZM) is designed to give you a market bias (either uptrend or downtrend) which you can use to determine a trade bias for ETF's or stocks.
ZM works by taking multiple moving averages of the NYSE Composite, a moving average of the NYSE advance decline line, and examining the relationship between those elements. Broadly, the market is considered to be in a uptrend when ZM is above zero, and a downtrend when below. However, there are many ways to interpret the indicator.
The version created by Greg Morris is more akin to a binary indicator in that ZM jumps from number to number. This version is smoothed to create an oscillator as it reduces whipsaws (at the expense of lag). You can set the EMA Length to 1 to go back to the original.
Some notes:
Michael Zahorchak called it the "Zahorchak Method", whereas Greg Morris uses the term "Measure". I'm not totally clear on the change, but Mr. Morris made some changes (covered below), so that may explain the altered name.
The original indicator used moving averages of 5, 15, and 40 weeks. I have converted these to daily numbers as that's the time frame I most commonly trade. You can convert the numbers back by dividing by 5.
The original indicator used the Dow Industrials for the moving averages, however Greg Morris switched to the NYSE Composite due to the advance decline line being based on the NYSE.
Greg Morris removed the 5 period moving average of the NYSE Composite, as it created increased volatility at market tops and bottoms. I tested ZM with the 5 period MA added back in, and I believe removing it creates a superior indicator.
I've added both Multi Time Frame functionality, and the ability to alter moving average lengths. Play around and see what you can come up with.
ZM oscillates between -10 and +10. There are some interesting levels creating between these two numbers (apart from the obvious zero level) - see what you can come up with.
All credit goes to Michael Zahorchak and Greg Morris for the indicator creation. I have simply reproduced their work for the TradingView community as this great indicator wasn't available.
Any queries let me know in the comments or PM me.
DD.
Поиск скриптов по запросу "binary"

GBS Binary Strategy test v1This script intends to predict the end result for GBPJPY for low time operations.

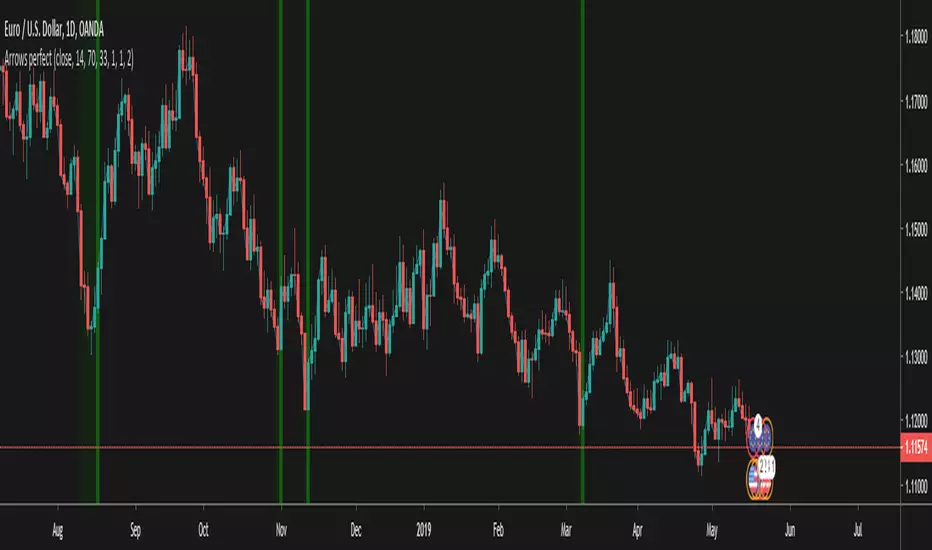
Where Is My Audi v1This script is under its first version and is designed to work in 5 minutes candles. I suggest to operate in Binary or Digital operations.
The main idea of this script is to ignore all entries that might be wrong and guess what could be the result at the end of the candle. In order to do that the indicator has 2 phases:
1. At the beginning of the candle it could draw a circle above or below the candle. If the circle is below we wait for bullish operations, if the circle is above we wait for bearish operations.
2. The circle is replaced by an arrow: green when we want to buy or red when we want to sell.
Note: The only repaint we could find is when there's a reversal candle against what we want to do.
As always take care and take good entry points in every operation. If it's possible wait for a regression (if the price is in the other side of the operation we want to take is better!).
It's working for GBPJPY, EURUSD and AUDUSD.
As always operate with a good risk manage, and I thing the efficacy of this script could be around 90% or 95%.
Be tuned for next improvements.

Trig's Law 2.0This script uses a combination of candlestick patterns and indicators to produce signals that indicate potential trade opportunities for binary options traders.
These signals are meant to serve as additional confirmation.
Best suited for EURNZD pair on the 5min and 3min timeframes.
In the settings menu, you will see a list of pattern-based signals you can choose to have displayed on the chart.
ideally should wait for the signal candle to close before entering any trade.

Stochastic binary option styleUsing Time Frames For Trend – You can also use different time frames to determine trends with stochastic. To do this you will need to use two different time frame charts, I like to use the weekly/daily or daily/hourly combination depending on the asset. Weekly/daily works well with stocks and indices while I prefer the shorter time frame for currency and commodities. This is how it works; stochastic on the longer term chart sets trend, stochastic on the shorter term chart gives the signal. If, on the weekly chart, stochastic is pointing up then you would trade bullish signals on the daily charts. Or if using the daily/hourly combo the stochastic on the daily would set trend while signals would come from the hourly chart.
Green color bar and background means k is > d, the crowd is bullish (trend is bullish, a bullish crossover is happened), red is the contrary (bears are the leaders)
Credit to Michael Hodges

TJD Parabolic SAR + Binary PivotsIdentifies support points, and pivots on the market, to place you in trending trades, and identify potential reversals.

B3 FisherTransformThis is the indicator from the trading strategy I posted recently. I do like Fisher Transform a lot on day bar charts. However, the smaller you go in bar interval, the less I feel it is as usable. At that point, any oscillator will usually do. When comparing the slope of the line and direction to the chart price action using day bars, I get a great sense of when to enter into a swing.
The indicator is often earlier to turn than other indicators, therefor, occasionally a trade may take a day to 3 days to start moving well in the desired direction, but it is never late which is very nice!
Use in conjunction with your support and resistance levels to find great entry points on reversals.
Use in conjunction with moving averages to find the reentry into a continuing trend.
Features include bar paint, zero line, and adjustable deviation values to target trend continuation and possible max oscillation reversal trades.
Enjoy! ~B3 d^.^b


BOSS Smooth Stochastic-RSI And RSI Oscillators With Alerts THE BEST FOREX, BINARY OPTIONS, STOCK AND CRYPTO INDICATORS FOR TRADINGVIEW.COM
Our Smooth Stochastic RSI indicator and our RSI indicator all combined in one!
BACKGROUND AND BAR COLOR
Green=BULLISH
Yellow= NEUTRAL/TRANSITIONAL
Red= BEARISH
ALERTS
GET ALERTS FOR BULLISH AND BEARISH CROSSOVERS ON STOCHASTIC RSI
GET ALERTS WHEN RSI LINE IS GREEN AND RED

BOSS Automatic Trendlines and Support Zones IndicatorTHE BEST FOREX, BINARY OPTIONS, STOCK AND CRYPTO INDICATORS FOR TRADINGVIEW.COM
Our auto-trendlines indicator and our support and resistance zones indicator with Fast and Slow EMA's all combined in one!
TrendLines
Trendlines when drawn properly make an excellent tool for traders. Used improperly though, they become ineffective and even counterproductive, resulting in a belief that prices have made a reversal when they really haven't, or that a trend has strength when price action suggests it doesn't.
The Boss Auto Trendline Indicator draws the trendlines automatically, and now you can effectively use trendlines as part of your trading strategy.
Trendlines highlight a trend or range (sideways movement). A trendline connects swing lows, where the low is lower than the surrounding prices, and swing highs in price. When the price rises, the swing lows rise.
Red Lines & Dots.
Connecting these lows with a line results in an ascending trendline , showing you that the trend is up. A trendline can also be drawn along the swing highs. This shows the angle of ascent, and the strength of the price move, whether strongly higher or not.
Green Lines & Dots
When the price falls, the swing highs fall. Connecting these highs with a line results in a descending trendline , illustrating the downward trend. A trendline can also be drawn along the swing lows. This shows the angle of descent and the strength of the downward price movement.
Support & Resistance Zones
Green = Support Zones
Red = Resistance Zones
The basic trading method for using support and resistance is to buy/long near support in uptrends, and to sell/short near resistance in downtrends.
Fast & Slow EMA's
Trend Following - you essentially use the EMA to track the primary trend. If a trading pair does not close beyond the average - you stay in the trade.
Moving Average Crosses - by using two different exponential moving average crosses you can generate buy and/or sell signals. For example, you can have a fast average cross a slow average to trigger a trade signal.
Dynamic Support and Resistance - EMA periods like the 21 or 55 can act as support and resistance zones.

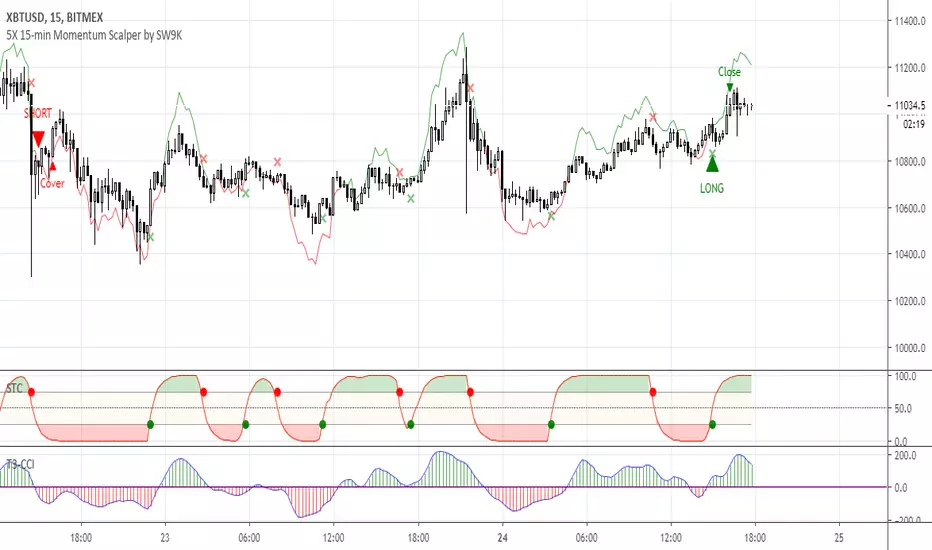
5X 15-min Momentum Scalper by SW9KThis is the alpha release-candidate study script with indicator alerts included. It is currently open for select individuals to test.
The core of this momentum scalper is primarily based on a modified Schaff Trend (which in itself is based on Stochastic elements and MACD) and a modified T3-CCI oscillator, specifically calibrated for 15-minute type movements -- do not apply to any other timeframes. Although it will take small scalps, it is designed to recognize when to ride out underwater positions so use maximum leverage or 5X or you may risk liquidation. Also, there is a stop loss setting feature, but it may reduce profits and win rate.
You can verify the highly accurate 75% win rate performance statistics with 100,000 XBTUSD contracts simulated at .
Features:
40% 3-month net profit, 74.48% win rate, 2.988 profit factor, 3.13% max drawdown, adjusted Sharpe ratio of ~3
Optimized for 15 minute timeframe scalping
Attempts to recognize when to keep position open and ride them out into profitable or breakeven
Profitable even with full Bitmex taker fees (0.075%)
Pyramiding Setting (default 3)
Aggressive Mode to increase entries and potential profits at higher risk
Easy-to-set binary Alerts
Follow SW9K at www.twitter.com
Volume 🔊 — SharkCIAThis method uses volume/price for trend analysis and includes a dead zone to prevent overtrading.
This is a binary signal, so if it's green we're bullish.
Prior art by Spectrum101

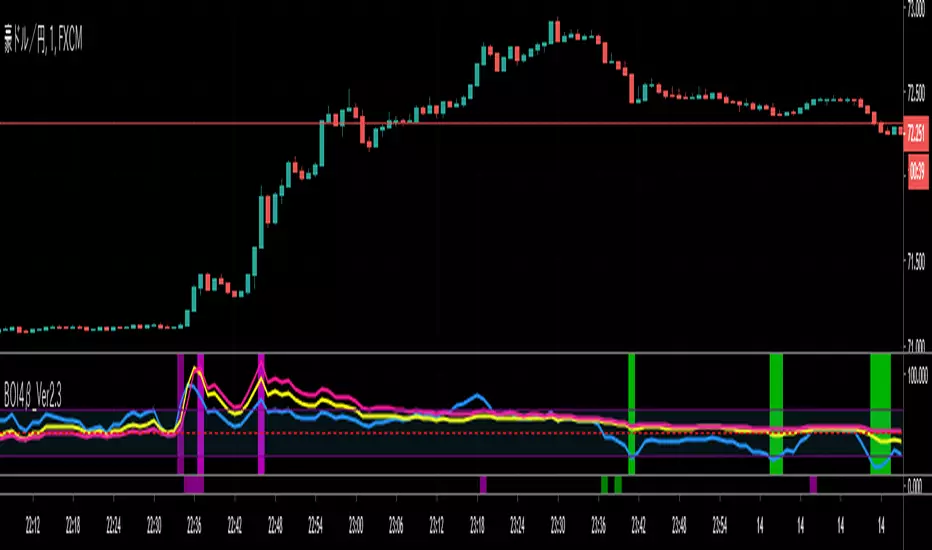
yutas_BOindicator4βver.1.0
High-low sign indicator for binary option only. (sample version)
バイナリーオプション専用ハイローサインインジケーター。 (お試し用)

BOSS Smooth Stochastic RSI Histogram Oscillator With Alerts THE BEST FOREX, BINARY OPTIONS, AND CRYPTO INDICATORS FOR TRADINGVIEW.COM
Our smooth stochastic rsi in column form with buy and sell alerts.

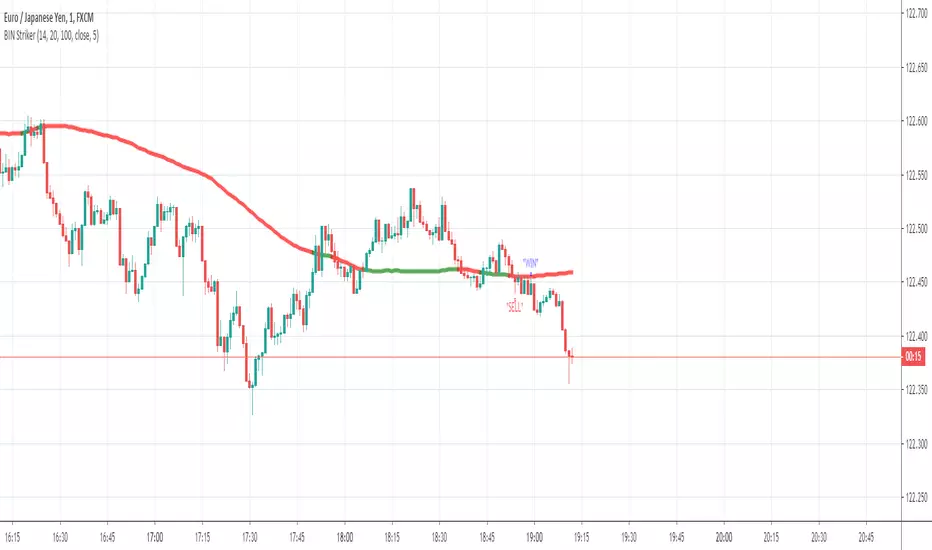
BIN StrikerThis script is for a 5 minute Binary trade signal and should be placed on a 1M candlestick chart.
Relative Body Indicator by VtsRBI:
The EMA of the relative body (RB) of Japanese candles is evaluated.
The RB of a candle (my definition) is simply the ratio of the body with respect to its full length
and taken positive for bull candles and negative for bear candles:
e.g. a bull "marubozo" has RB=1 a bear "marubozo" has RB=-1;
a "doji" has RB=0.
This simple indicator grasps the essence of the market by filtering out a great deal of noise.
A flag can be selected to calculate its very basic binary version, where a bull candle counts as a one
and a bear candle counts as a minus one.
Enter (or exit) the market when the signal line crosses the base line.
When the market is choppy we have a kind of alternating bear and bull candles so that
RBI is FLAT and usually close to zero.
Therefore avoid entering the market when RBI is FLAT and INSIDE the Exclusion level.
The exclusion level is to be set by hand: go back in history and check when market was choppy; a good
way to set it is to frame the oscillations of RBI whe price was choppy.
RBI is more effective when an EMA of price is used as filtering. I found EMA(13) to be
a decent filter: go long when base crosses signal upwards AND closing price is above EMA(13);
same concept for going short.
As any other indicator, use it with responsibility: THERE CAN'T BE A SINGLE MAGIC INDICATOR winning
all trades.
Above all, have fun.
Vitelot/Yanez/Vts March 31, 2019
Note: I'm not aware of any indicator like this. My apologies to whoever had this idea before me.

Surface Roughness EstimatorIntroduction
Roughness of a signal is often non desired since smooth signals are easier to analyse, its logical to say that anything interacting with rough price is subject to decrease in accuracy/efficiency and can induce non desired effects such as whipsaws. Being able to measure it can give useful information and potentially avoid errors in an analysis.
It is said that roughness appear when a signal have high-frequencies (short wavelengths) components with considerable amplitudes, so its not wrong to say that "estimating roughness" can be derived into "estimating complexity".
Measuring Roughness
There are a lot of way to estimate roughness in a signal, the most well know method being the estimation of fractal dimensions. Here i will use a first order autocorrelation function.
Auto-correlation is defined by the linear relationship between a signal and a delayed version of itself, for exemple if the price goes on the same direction than the price i bars back then the auto-correlation will increase, else decrease. So what this have to do with roughness ? Well when the auto-correlation decrease it means that the dominant frequency is high, and therefore that the signal is rough.
Interpretation Of The Indicator
When the indicator is high it means that price is rough, when its low it indicate that price is smooth. Originally its the inverse way but i found that it was more convenient to do it this way. We can interpret low values of the indicator as a trending market but its not totally true, for example high values dont always indicate that the market is ranging.
Here the comparison with the indicator applied to price (orange) and a moving average (purple)
The average measurement applied to a moving average is way lower than the one using the price, this is because a moving average is smoother than price.
Its also interesting to see that some trend strength estimator like efficiency ratio can treat huge volatility signals as trend as shown below.
Here the efficiency ratio treat this volatile movement as a trending market, our indicator instead indicate that this movement is rough, such indication can avoid situation where price is followed by another huge volatile movement in the opposite direction.
Its important to make the distinction between volatility and trend strength, the trend is defined by low frequencies components of a signal, therefore measuring trend strength can be resumed as measuring the amplitude of such frequencies, but roughness estimation can do a great job as well.
Conclusion
I have showed how to estimate roughness in price and compared how our indicator behaved in comparison with a classic trend strength measurement tool. Filters or any other indicator can be way more efficient if they know how to filter according to a situation, more commonly smoothing more when price is rough and smoothing less when price is smooth. Its good to have a wider view of how market is behaving and not sticking with the binary view of "Trending" and "Ranging" .
I hope you find a use to this script :)
Best Regards

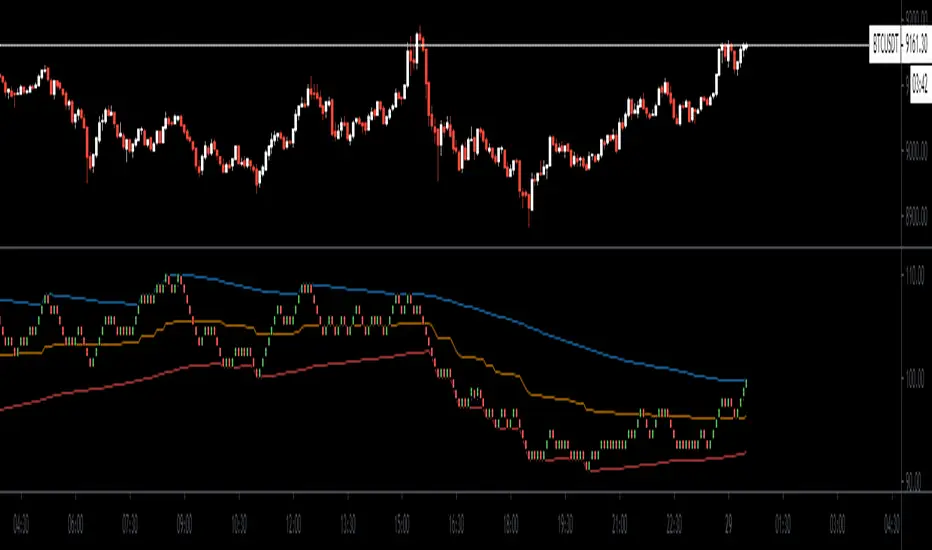
Profitable SuperTrendHello friends,
This script is a powerful, non-repainting optimizer for the classic SuperTrend indicator — one of the most popular tools for trend-following and volatility-based trading. It automatically finds and applies the most profitable SuperTrend settings for each instrument and timeframe, removing the need for manual parameter tuning or guesswork.
🛠 How It Works
The indicator evaluates over 1,400 combinations of ATR Periods and Multipliers using a decision tree–based optimization algorithm .
Each configuration is backtested across the instrument's full history, and when a more profitable setup is identified, the indicator automatically switches to those values in real time — while preserving the standard SuperTrend logic.
It also supports commission customization for more realistic backtesting and includes an alert system that notifies you whenever a better parameter set is found.
This adaptive approach keeps the SuperTrend continuously tuned to evolving market conditions without repainting or distorting past data.
💡 Integrated Versions Explained
This all-in-one tool merges 3 complementary indicators:
• Profitable SuperTrend — A dedicated optimizer that runs in a separate window below your chart. It doesn’t produce buy/sell signals directly but analyzes your asset and timeframe to find optimal ATR settings. Results are visualized as two lines (purple and orange), with optional labels displaying the best parameter values. You can then manually apply these values to your standard SuperTrend.
• Self-Adjusting SuperTrend — A real-time overlay version that behaves like the standard SuperTrend but dynamically adjusts its parameters on the fly. It requires no manual setup and can be paired with the Profitable SuperTrend for full transparency over which values are currently active.
• Compact Self-Adjusting SuperTrend — A minimalist oscillator version that uses simple binary outputs: -1 for Sell and 1 for Buy. This format is ideal for filtering or integrating the adaptive logic into other trading systems.
Together, they form a complete adaptive suite that combines automation, flexibility, and precision — suitable for both discretionary and systematic traders.
🔥 Key Features
Adaptive optimization powered by a decision tree–based algorithm
Real-time switching to the most profitable SuperTrend parameters
Commission customization for realistic backtesting
Direction filter (Longs | Shorts | Longs & Shorts)
Optional analysis start date for focused historical testing
Smart alert when better settings are detected
Optional buy/sell labels and compact trend output
Clean and organized UI with improved workflow
If you'd like access or have any questions, feel free to reach out to me directly via DM.
👋 Good luck and happy trading!
Платный скрипт

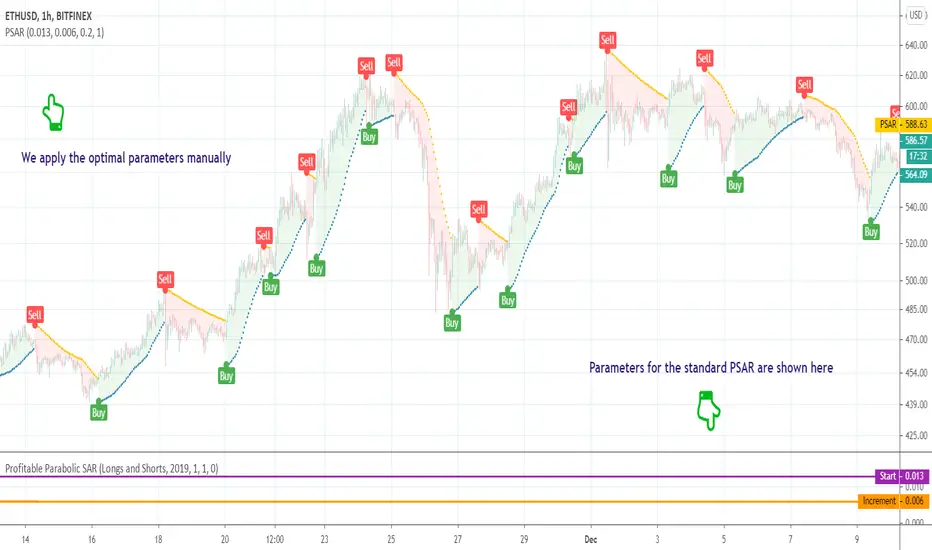
Profitable Parabolic SARHello friends,
This script is a powerful, non-repainting optimizer for the classic Parabolic Stop and Reverse (PSAR) — one of J. Welles Wilder's most respected trend-following systems. It automatically finds and applies the most profitable PSAR settings for each instrument and timeframe, eliminating the need for manual parameter tuning.
🛠 How It Works
The indicator evaluates over 500 combinations of PSAR parameters using a decision tree–based algorithm under the hood .
Each configuration is backtested across the instrument's full price history, and when a more profitable setup is identified, the indicator seamlessly switches to those values in real time — while maintaining the original PSAR logic.
The Maximum parameter remains fixed since its impact on overall profitability is minimal compared to Start and Increment.
This self-adjusting approach removes the guesswork of parameter optimization and keeps the PSAR dynamically tuned to changing market regimes.
💡 Integrated Versions Explained
This all-in-one tool merges 3 complementary indicators:
• Profitable PSAR — A parameter optimizer that runs in a separate window below your main chart. It doesn't generate buy/sell signals directly but analyzes your specific asset and timeframe to find optimal settings. These are displayed as two lines (purple and orange), with optional labels showing the actual parameter values. Once identified, you can apply these optimal values manually to the standard PSAR.
• Self-Adjusting PSAR — A real-time overlay version that looks and behaves like the standard PSAR but automatically adjusts its parameters on the fly. It requires no manual configuration and can be paired with the Profitable PSAR to monitor which settings are currently active.
• Compact Self-Adjusting PSAR — A minimalist oscillator version that reflects the same adaptive logic through simple binary outputs: -1 for Sell and 1 for Buy. This variant is ideal for filtering or signal integration into other systems.
Together, they form a unified adaptive system that gives users both automation and interpretability — the best of both worlds.
🔥 Key Features
Adaptive optimization powered by a decision tree–based algorithm
Real-time switching to more profitable parameter configurations
Direction filter (Longs | Shorts | Longs & Shorts)
Optional analysis start date for focused historical testing
Commission customization for realistic performance modeling
Visual highlighting of parameter changes
Optional buy/sell labels and compact trend signal display
If you'd like access or have any questions, feel free to reach out to me directly via DM.
👋 Good luck and happy trading!
Платный скрипт