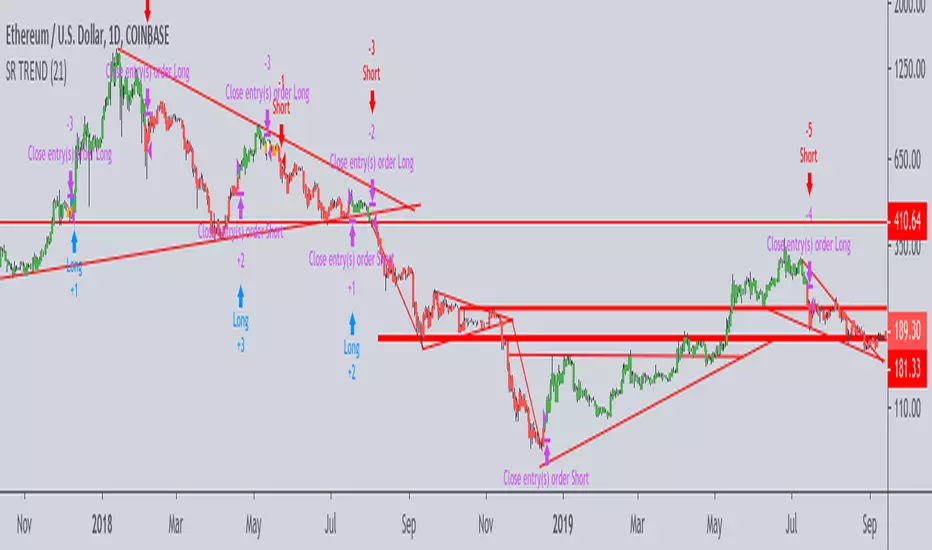
Support-Resistance breakoutStrategy based on longing resistance breakout and shorting support breakout.
It defines highs and lows using fractal with 2 bars for confirming high/lows. So it has 2 bars lag.
It calculates the difference between sma with defined length (21 by default) of highs and of lows and uses it as alt SR level. This idea I took from synapticEx's indicator Nebula-Advanced-Dynamic-Support-Resistance.
Position enter is the breakout of SR, defined by fractals.
Position exit is: bar change in opposite to position direction > difference is sma of highs and of lows.
Поиск скриптов по запросу "breakout"
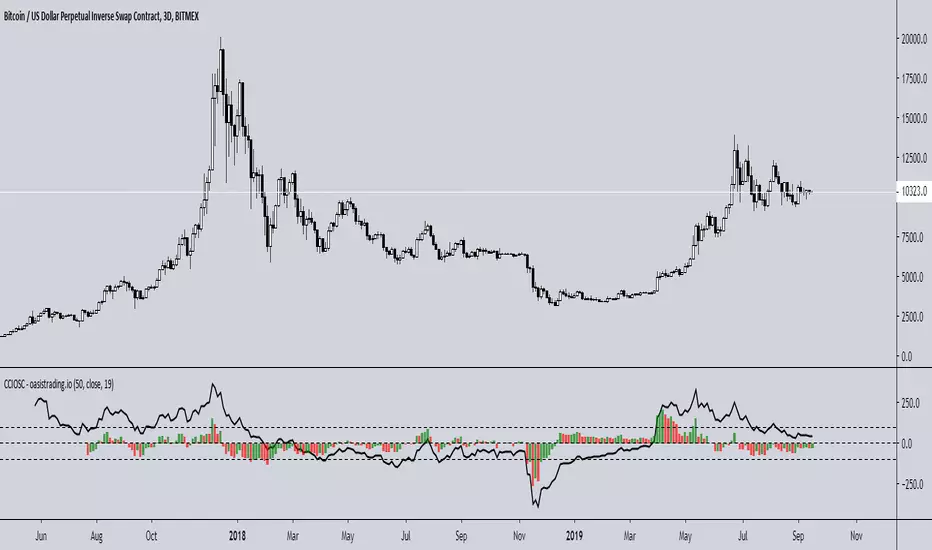
Improved CCI with Momentum OscillatorThis indicator is free to all Oasis Trading Group members.
The Improved CCI is a basic CCI with a momentum gauge applied to the zero line. This indicator is used to find breakouts/breakdowns and when they have lost momentum.
A bullish entry would be found when the CCI has broken the 100 line when the Momentum gauge is above zero or when the CCI has crossed above the -100 line when the Momentum gauge is above zero.
A bearish entry would be found when the CCI has broken the -100 line when the Momentum gauge is below zero or when the CCI has crossed below the 100 line when the Momentum gauge is below zero.
For Access or Questions: Private message us. Thank you.
TMA Indicator v2.1This indicator is designed to show support and resistance at local extremes.
Indicator can be configured to filter out bullish vs bearish resistance levels based on configurable parameters.
Supports alerts for entries and exits based on breakouts of local extrema.
Green/Red indicates long/short entry
Yellow/Orange indicates long/short exit
Backtest window: Jan 1, 2015 - Jul 21, 2019 (today)
For paper trading only. Do not use on real markets. Never make investment decisions based on this indicator alone.

Envelope Breakout Alerts (Heikin Ashi)This is an experimental strategy designed to identify breakouts on 4h to 3d timeframes.
Use at your own risk, it's still only a proof of concept based off the built-in Envelope indicator. Heikin Ashi smoothing is built in.

AG Ultimate Bollinger BandsWe believe we have really built the ultimate Bollinger Bands! There are so many options with these Bands:
- use an SMA or EMA for the Basis Moving Average
- displaying the Average Highs/Lows (blue lines) to create a Moving Band
- show breakouts of the Upper/Lower Bollinger Bands with arrows for simplicity (no more wondering whether it closed out or not!)
- show a standard deviation of Highs/Lows alongside the traditional Upper/Lower Bollinger Bands.
All options are togglable, for full flexibility and customisation.

Poseidon - [Swing High Low][Support and Resistance][Reversal]...A great indicator with tons of usages for technical analysis
Act as:
* Support and Resistance (It can be used as breakouts only if you drag the line manualy, it will never break it by itself)
* Swing points
* Reversal point (The candle will reverse in 90% in cases)
* Tops and Bottoms (It finds highest and lowest points)
... and many more TA for strategies
Combined with RSI will give even better overview of the chart
Play with values till you find what your needs are
The bigger value is, the more accurate points will be
(There is no such as magic indicators, you need to do your job, you need to know what are you doing before enter in real life!)
Cheers!
@Zekis

Volume w/ Threshold and Editable MA PeriodJust a simple script that tweaks the original Volume one.
The purpose is creating a threshold which we'll use to put an alert on. This way, we can be notified whether Volume pumps.
Useful for spotting breakouts, breakdowns and pumps.
Threshold is simply a coeff * ma(volume,period). Coeff is editable as well.
Hope this helps!

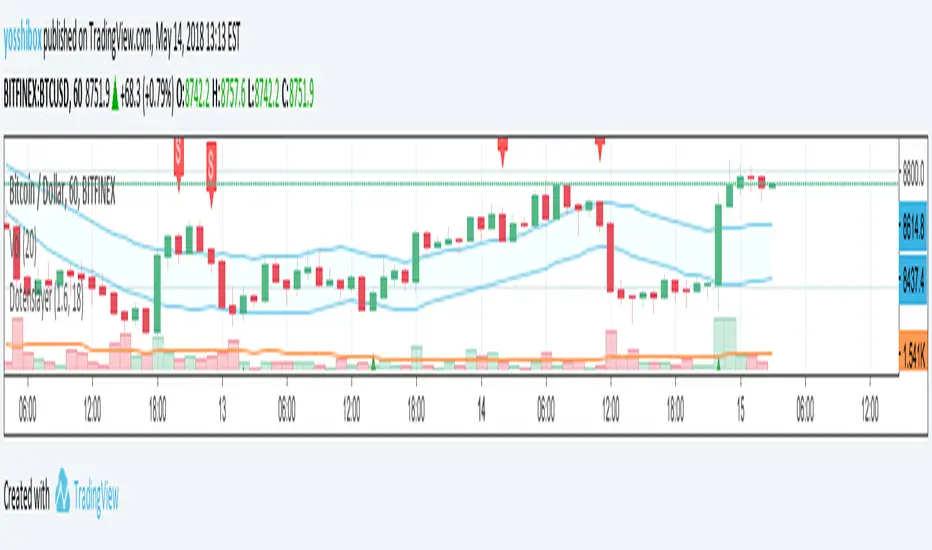
Dotenslayer : An open range breakouts method indicator for botThis script shows the long and short points of certain Japanese bots like 'DotenKun' which use open range breakouts method.
Searching recent 18 bars as default and shows the range calculated with a factor (default k = 1.6). You can edit this condition by yourself.
When filled the long or short conditions, also shows the indicator on the price chart to help your trading on BTC.
Also, this script can make alarm events related to those conditions.
This script only works for BTCUSD, XBTUSD, BTCJPY, FXBTCJPY with 1H time span.
Disclaimer :
I don't own the source code of the certain bots and I didn't directly reference the source code of it.
So which means, I don't guarantee this script works as same as the bots works.
Also, I didn't mean to disturb their trading bot businesses.
Your donations are welcome! :
BTC : 327MqYGfHJFC7LRijGwQZXdTAyFwvYCzyv
ETH : 0x5E270c3667E65ba6158D292a98c5b54F81AfCAf1
Support and resistance (Spicytrader)
Spicytrader automatically identifies the most accurate supports and resistances.
Most breakouts are triggered when crossing supports and resistances.
GET ACCESS : spicytrader.com

Range Breakout PredictorHi everyone, I put this together while learning Pine and wanted to share to see if anyone finds it useful.
It does a decent job predicting the direction of breakouts from range conditions, as well as picking up some easy trend profits. I had some fun making it quite configurable for those who would like to tune it for a particular index (for example, check out GOOG at 1 hour resolution with the default values, just for fun).
Please let me know if you like anything about it or have suggestions!

Fractal breakouts (god lines)Fractal breakout strategy. Used to ascertain exact entries (both long and short)
Ideal for > $800-1000 scalps on margin (on higher time-frames i.e. 1H and above) . Simultaneously, also great for quick scalps on lower time-frames (1, 3 and 5 minutes) .
Please message for info. Full strategy rules will be provided once access is given.
See below sample trades based on this strategy:
1H:
15m:
1m:

Auto AVWAP (Anchored-VWAP) with Breakout Screener_v2Updated indicator for AWAP breakout. The indicator identified the candle that breaks out of AVWAP

Engulfing & Pin Bar Breakout StrategyOverview
This strategy automates a classic, powerful trading methodology based on identifying key candlestick reversal patterns and trading the subsequent price breakout. It is designed to be a complete, "set-and-go" system with built-in risk and position size management.
The core logic operates on the 1-Hour timeframe, scanning for four distinct high-probability reversal signals: two bullish and two bearish. An entry is only triggered when the market confirms the signal by breaking a key price level, aiming to capture momentum following a potential shift in market sentiment.
The Strategy Logic
The system is composed of two distinct modules: Bullish (Long) and Bearish (Short).
🐂 Bullish (Long) Setup
The script initiates a long trade based on the following strict criteria:
Signal: Identifies either a Hammer or a Bullish Engulfing pattern. These patterns often indicate that sellers are losing control and buyers are stepping in.
Confirmation: Waits for the very next candle after the signal.
Entry Trigger: A long position is automatically opened as soon as the price breaks above the high of the signal candle.
Stop Loss: Immediately set just below the low of the signal candle.
Take Profit: A fixed target is placed at a 1:5 Risk/Reward Ratio.
🐻 Bearish (Short) Setup
The script initiates a short trade based on the following strict criteria:
Signal: Identifies either a Shooting Star or a Bearish Engulfing pattern. These patterns suggest buying pressure is fading and sellers are taking over.
Confirmation: Waits for the very next candle after the signal.
Entry Trigger: A short position is automatically opened as soon as the price breaks below the low of the signal candle.
Stop Loss: Immediately set just above the high of the signal candle.
Take Profit: A fixed target is placed at a 1:4 Risk/Reward Ratio.
Key Feature: Automated Risk Management
This strategy is designed for disciplined trading. You do not need to calculate position sizes manually.
Fixed Risk: The script automatically calculates the correct position size to risk exactly 2% of your total account equity on every single trade.
Dynamic Sizing: The position size will adjust based on the distance between your entry price and your stop loss for each specific setup, ensuring a consistent risk profile.
How To Use
Apply the script to your chosen chart (e.g., BTC/USD).
Crucially, set your chart's timeframe to 1-Hour (H1). The strategy is specifically calibrated for this interval.
Navigate to the "Strategy Tester" tab below your chart to view backtest results, including net profit, win rate, and individual trades.
Disclaimer: This script is provided for educational and informational purposes only. It is not financial advice. All trading involves substantial risk, and past performance is not indicative of future results. Please use this tool responsibly and at your own risk.

Hodie Smart Inside BarThe Hodie Smart Inside Bar indicator automatically detects and visually highlights inside bars — candles fully contained within the range of the previous (parent) candle.
How the indicator works:
Inside Bar Identification:
The indicator analyzes each candle and checks if its high is lower than the previous candle’s high, and its low is higher than the previous candle’s low. If this condition is met, the candle is considered an inside bar.
Size Filtering:
To filter out small and insignificant consolidations, the indicator compares the size of the parent candle’s range to the inside bar’s range. Only if the parent candle is significantly larger (2 times or more — adjustable parameter), the inside bar is considered significant.
Zone Drawing:
For each detected inside bar, the indicator draws a rectangular zone bounded by the parent candle’s high and low. This zone automatically extends to the right as new bars appear until the price moves outside the parent candle’s range.
Zone Completion:
Once the price closes above the parent candle’s high or below its low, the zone is considered complete and stops extending.
Visual Aids:
If enabled, the indicator can shade the background of the current inside bar for additional visual emphasis.
A label with the text "IB" appears above the inside bar candle on the chart for easier identification.
Alerts:
Supports alerts when a new inside bar forms.
Alerts help traders notice important signals promptly.
To activate, create an alert on the indicator with the condition “New Inside Bar”.
Benefits of the Indicator:
Inside bars often signal consolidation and potential liquidity accumulation, which may be followed by a strong impulsive breakout. This indicator helps traders quickly identify consolidation zones and prepare for possible price moves.

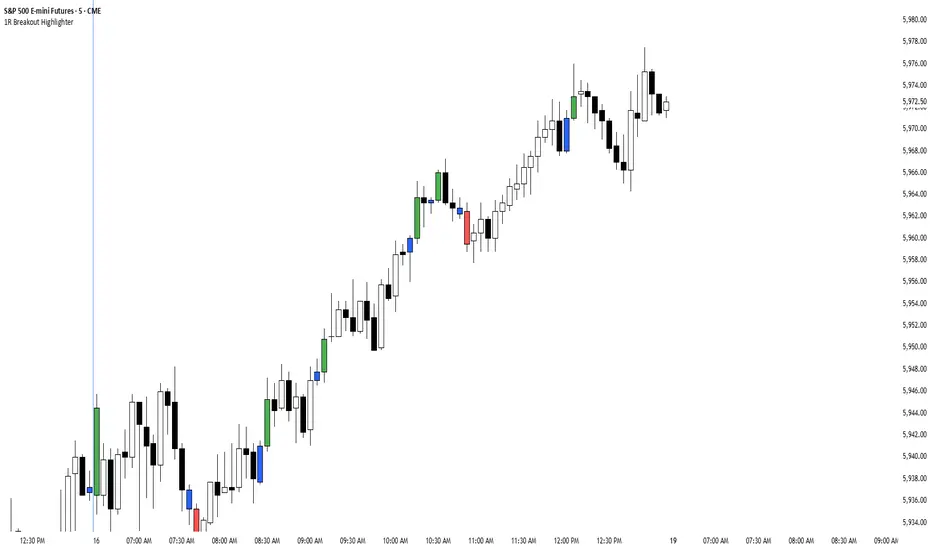
1R Breakout Highlighter1R Breakout. This indicator measures every bar and highlights any bar that is greater than the previous bar by more than 1R.
Chews Opening Range Breakout - FibonacciVisual tool for taking a Fibonacci retracement-backed opening range breakout.
How it works:
Short a first red candle. Long a first green candle.
You decide which Fibonacci % you prefer your stop loss to be, the plot and label will represent your decision.
Fibonacci logic is close --> open.
Recommendations:
Use a lower time frame interval like 3m.
Extra Notes:
On higher priced stocks, you may see some discrepancy (~$0.1!) when plotting a Fibonacci Retracement compared to the suggested stop loss.
Since this discrepancy happens on inherently more volatile stocks, I have chosen to neglect the discrepancy instead of going for point perfect stop loss exits.
Realistically, it won't matter unless you get very unlucky.
Fibonacci drawing is not a feature of what this indicator plots. It's there for reference, but I can add if requested.
I drafted this simple code to help me visualize automating this strategy.
"That's spoicy!"
ToDo: Add an optional two-sided ORB. Higher chance of success since it is meant for reversals.

Pivot-Based Channels & Bands [Misu]█ This Indicator is based on Pivot detection to show bands and channels.
The pivot price is similar to a resistance or support level. If the pivot level is breached, the price should continue in that direction. Or the price could reverse at or near this level.
█ Usages:
Use channels as a support & resistance zone.
Use bands as a support & resistance zone. It is also very powerfull to use it as a breakout.
Use mid bands & mid channels as a trend direction or trade filter as a more usual moving average.
█ Parameters:
Show Pivot Bands: show bands.
Show Pivot Mid Band: show mid bands.
Show Pivot Channels: show channels.
Show Pivot Mid Channel: show mid channels.
Deviation: deviation used to calculate pivot points.
Depth: depth used to calculate pivot points.

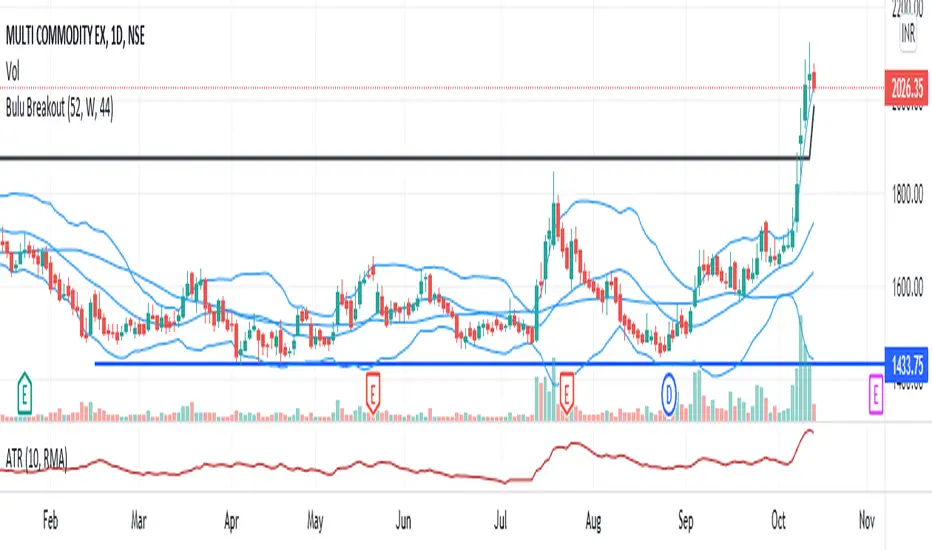
Bulu BreakoutI designed this indicator to trade 52 weeks high breakout. It tests three conditions 1)close above 52weeks high 2)close above upper Bollinger band 3) adx <30. any candle that satisfies all these condition will change its color to black. i also added 44sma to this script to find high probable trade. if the black candle is near 44 sma it is more reliable.
[KL] Double Bollinger Bands Strategy (for Crypto/FOREX)This strategy uses a setup consisting of two Bollinger Bands based on the 20 period 20-SMA +/-
(a) upper/lower bands of two standard deviations apart, and
(b) upper/lower bands of one standard deviation apart.
We consider price at +/- one standard deviation apart from 20-SMA as the "Neutral Zone".
If price closes above Neutral Zone after a period of consolidation, then it's an opportunity for entry. Strategy will long, anticipating for breakout.
The illustration below shows price closing above the Neutral Zone after a period of consolidation.
a.c-dn.net
Position is exited when prices closes at Neutral Zone (being lower than prior bars)

Beekay Range-BreakerIdentifies scripts that are trading within a range for quite some time.
How to read:
1. Both the orange and the blue boxes are overlapping each other indicates that the price has been in that range.
2. The white line shows the price direction.
3. The white line crossing up/down can be seen as a breakout.
NOTE: Kindly validate the signals based on further analysis before taking a call .


Johnny 5 Breakout IndicatorThis is an indicator to help you catch when coins breakout. You can set an alert with this indicator.
